South American Indian vs Immigrants from Czechoslovakia GED/Equivalency
COMPARE
South American Indian
Immigrants from Czechoslovakia
GED/Equivalency
GED/Equivalency Comparison
South American Indians
Immigrants from Czechoslovakia
85.2%
GED/EQUIVALENCY
22.8/ 100
METRIC RATING
191st/ 347
METRIC RANK
87.9%
GED/EQUIVALENCY
99.3/ 100
METRIC RATING
57th/ 347
METRIC RANK
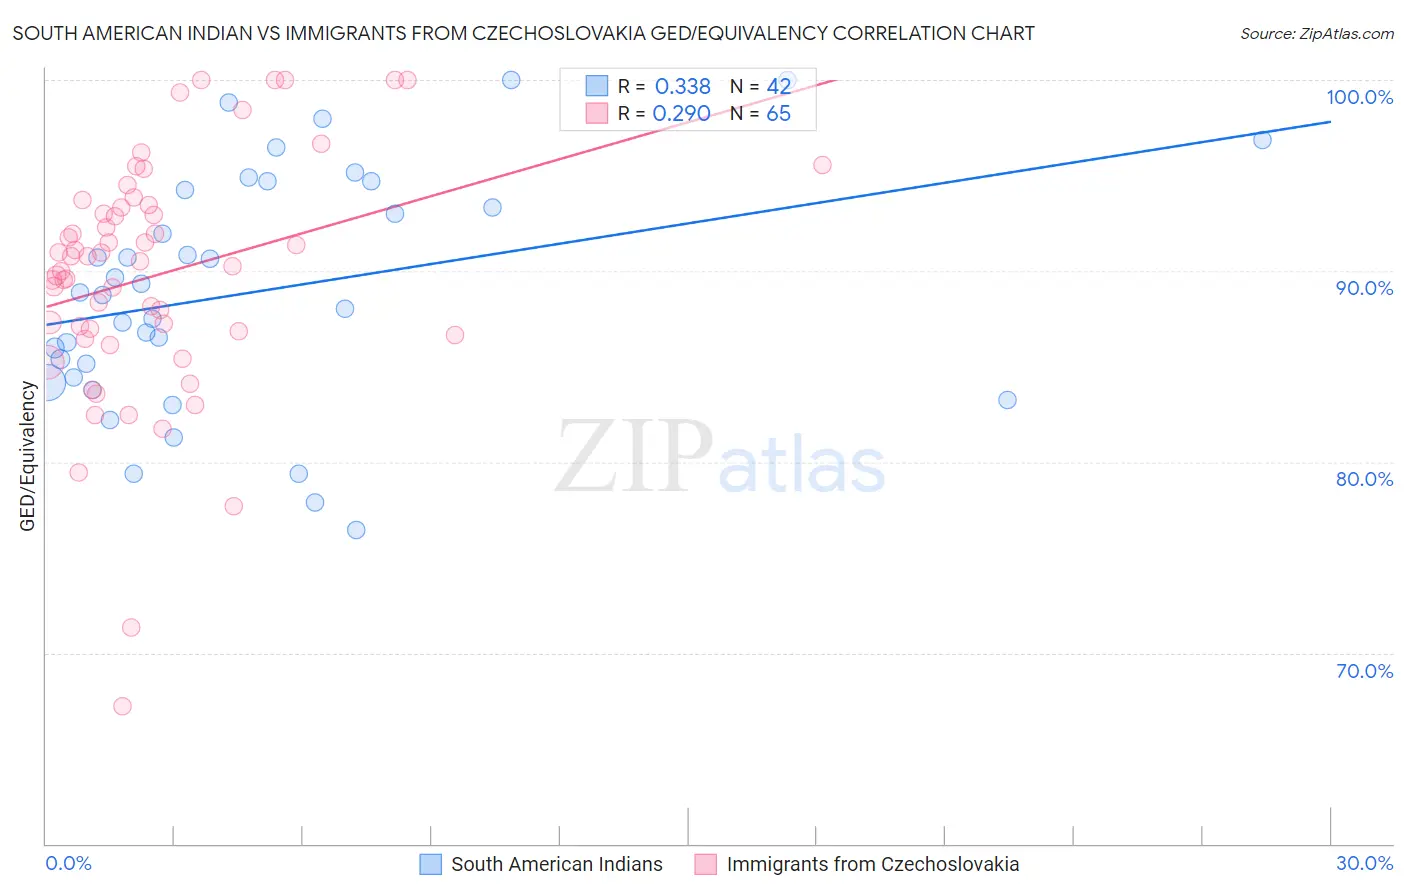
South American Indian vs Immigrants from Czechoslovakia GED/Equivalency Correlation Chart
The statistical analysis conducted on geographies consisting of 164,573,088 people shows a mild positive correlation between the proportion of South American Indians and percentage of population with at least ged/equivalency education in the United States with a correlation coefficient (R) of 0.338 and weighted average of 85.2%. Similarly, the statistical analysis conducted on geographies consisting of 195,448,106 people shows a weak positive correlation between the proportion of Immigrants from Czechoslovakia and percentage of population with at least ged/equivalency education in the United States with a correlation coefficient (R) of 0.290 and weighted average of 87.9%, a difference of 3.2%.
GED/Equivalency Correlation Summary
| Measurement | South American Indian | Immigrants from Czechoslovakia |
| Minimum | 76.5% | 67.2% |
| Maximum | 100.0% | 100.0% |
| Range | 23.5% | 32.8% |
| Mean | 88.9% | 89.8% |
| Median | 88.8% | 90.5% |
| Interquartile 25% (IQ1) | 84.4% | 86.7% |
| Interquartile 75% (IQ3) | 94.2% | 93.4% |
| Interquartile Range (IQR) | 9.8% | 6.6% |
| Standard Deviation (Sample) | 6.1% | 6.3% |
| Standard Deviation (Population) | 6.0% | 6.3% |
Similar Demographics by GED/Equivalency
Demographics Similar to South American Indians by GED/Equivalency
In terms of ged/equivalency, the demographic groups most similar to South American Indians are Nonimmigrants (85.2%, a difference of 0.0%), Delaware (85.2%, a difference of 0.020%), Puget Sound Salish (85.2%, a difference of 0.060%), Chippewa (85.2%, a difference of 0.060%), and Tongan (85.2%, a difference of 0.060%).
| Demographics | Rating | Rank | GED/Equivalency |
| Immigrants | Oceania | 33.6 /100 | #184 | Fair 85.5% |
| Spanish | 32.8 /100 | #185 | Fair 85.4% |
| Spaniards | 31.9 /100 | #186 | Fair 85.4% |
| Immigrants | Afghanistan | 29.8 /100 | #187 | Fair 85.4% |
| Immigrants | Sierra Leone | 29.0 /100 | #188 | Fair 85.4% |
| Guamanians/Chamorros | 28.4 /100 | #189 | Fair 85.3% |
| Alaskan Athabascans | 27.5 /100 | #190 | Fair 85.3% |
| South American Indians | 22.8 /100 | #191 | Fair 85.2% |
| Immigrants | Nonimmigrants | 22.7 /100 | #192 | Fair 85.2% |
| Delaware | 22.2 /100 | #193 | Fair 85.2% |
| Puget Sound Salish | 20.8 /100 | #194 | Fair 85.2% |
| Chippewa | 20.8 /100 | #195 | Fair 85.2% |
| Tongans | 20.7 /100 | #196 | Fair 85.2% |
| Costa Ricans | 20.4 /100 | #197 | Fair 85.2% |
| Immigrants | Africa | 17.5 /100 | #198 | Poor 85.1% |
Demographics Similar to Immigrants from Czechoslovakia by GED/Equivalency
In terms of ged/equivalency, the demographic groups most similar to Immigrants from Czechoslovakia are Northern European (87.9%, a difference of 0.0%), Serbian (87.9%, a difference of 0.010%), Scandinavian (87.9%, a difference of 0.020%), European (87.9%, a difference of 0.020%), and German (87.9%, a difference of 0.040%).
| Demographics | Rating | Rank | GED/Equivalency |
| Immigrants | Korea | 99.5 /100 | #50 | Exceptional 88.1% |
| Immigrants | Netherlands | 99.4 /100 | #51 | Exceptional 88.0% |
| Zimbabweans | 99.4 /100 | #52 | Exceptional 88.0% |
| Immigrants | South Africa | 99.4 /100 | #53 | Exceptional 88.0% |
| Soviet Union | 99.4 /100 | #54 | Exceptional 88.0% |
| New Zealanders | 99.4 /100 | #55 | Exceptional 88.0% |
| Immigrants | Denmark | 99.4 /100 | #56 | Exceptional 88.0% |
| Immigrants | Czechoslovakia | 99.3 /100 | #57 | Exceptional 87.9% |
| Northern Europeans | 99.3 /100 | #58 | Exceptional 87.9% |
| Serbians | 99.3 /100 | #59 | Exceptional 87.9% |
| Scandinavians | 99.3 /100 | #60 | Exceptional 87.9% |
| Europeans | 99.3 /100 | #61 | Exceptional 87.9% |
| Germans | 99.3 /100 | #62 | Exceptional 87.9% |
| Immigrants | Turkey | 99.2 /100 | #63 | Exceptional 87.9% |
| Immigrants | Canada | 99.2 /100 | #64 | Exceptional 87.9% |