French American Indian vs Immigrants from Hungary GED/Equivalency
COMPARE
French American Indian
Immigrants from Hungary
GED/Equivalency
GED/Equivalency Comparison
French American Indians
Immigrants from Hungary
84.6%
GED/EQUIVALENCY
6.3/ 100
METRIC RATING
224th/ 347
METRIC RANK
87.2%
GED/EQUIVALENCY
96.0/ 100
METRIC RATING
104th/ 347
METRIC RANK
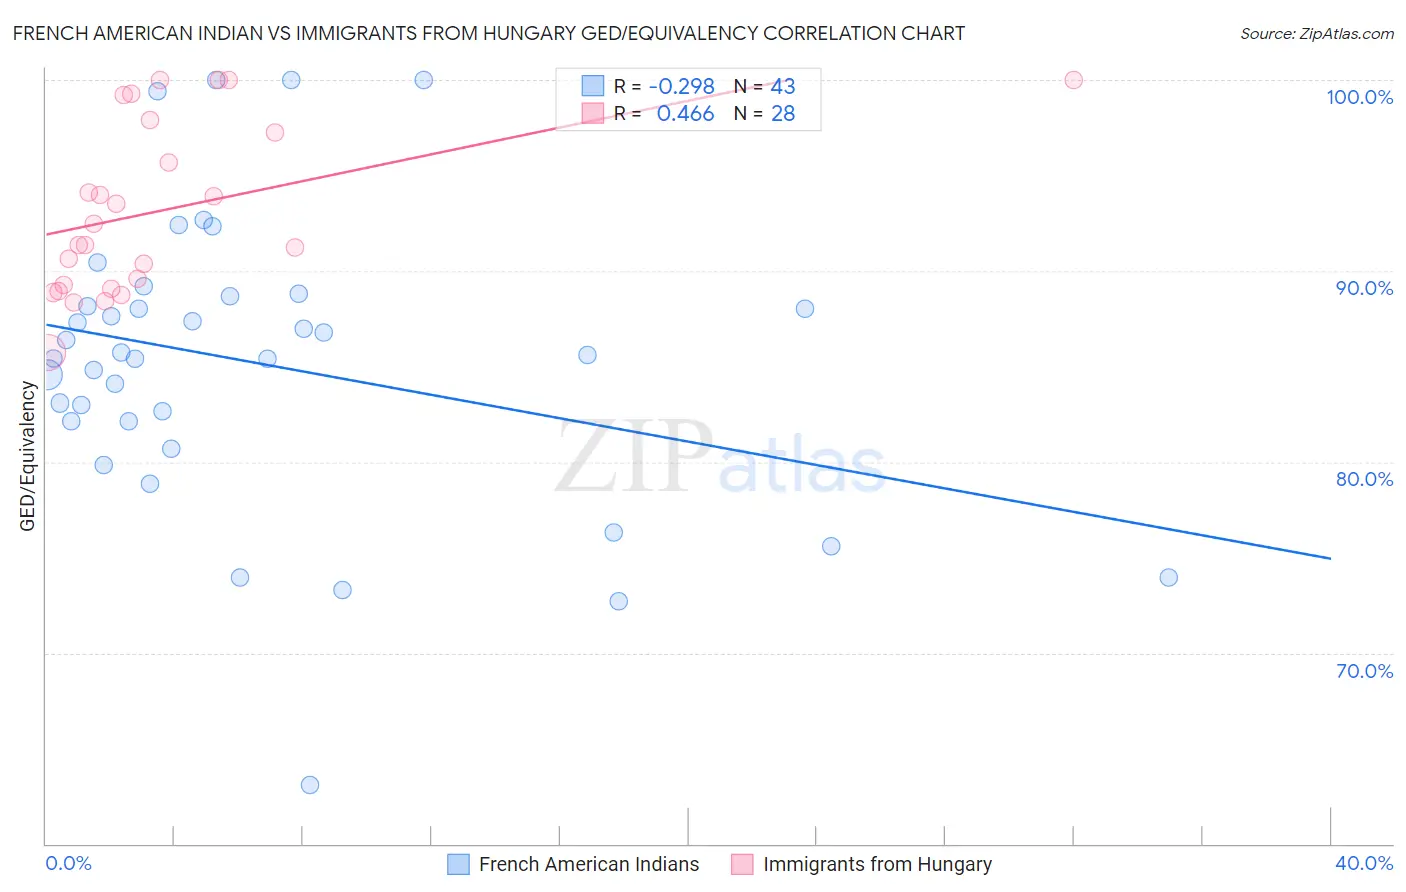
French American Indian vs Immigrants from Hungary GED/Equivalency Correlation Chart
The statistical analysis conducted on geographies consisting of 131,976,269 people shows a weak negative correlation between the proportion of French American Indians and percentage of population with at least ged/equivalency education in the United States with a correlation coefficient (R) of -0.298 and weighted average of 84.6%. Similarly, the statistical analysis conducted on geographies consisting of 195,707,305 people shows a moderate positive correlation between the proportion of Immigrants from Hungary and percentage of population with at least ged/equivalency education in the United States with a correlation coefficient (R) of 0.466 and weighted average of 87.2%, a difference of 3.1%.
GED/Equivalency Correlation Summary
| Measurement | French American Indian | Immigrants from Hungary |
| Minimum | 63.0% | 85.7% |
| Maximum | 100.0% | 100.0% |
| Range | 37.0% | 14.3% |
| Mean | 85.2% | 93.2% |
| Median | 85.6% | 91.9% |
| Interquartile 25% (IQ1) | 82.1% | 89.2% |
| Interquartile 75% (IQ3) | 88.7% | 97.6% |
| Interquartile Range (IQR) | 6.6% | 8.4% |
| Standard Deviation (Sample) | 7.7% | 4.4% |
| Standard Deviation (Population) | 7.6% | 4.4% |
Similar Demographics by GED/Equivalency
Demographics Similar to French American Indians by GED/Equivalency
In terms of ged/equivalency, the demographic groups most similar to French American Indians are Immigrants from Thailand (84.5%, a difference of 0.050%), Immigrants from Uzbekistan (84.6%, a difference of 0.070%), Immigrants from Zaire (84.5%, a difference of 0.080%), Iroquois (84.6%, a difference of 0.090%), and Immigrants from Costa Rica (84.5%, a difference of 0.090%).
| Demographics | Rating | Rank | GED/Equivalency |
| Nigerians | 8.6 /100 | #217 | Tragic 84.7% |
| Alaska Natives | 8.6 /100 | #218 | Tragic 84.7% |
| Potawatomi | 8.2 /100 | #219 | Tragic 84.7% |
| Americans | 8.2 /100 | #220 | Tragic 84.7% |
| Taiwanese | 8.1 /100 | #221 | Tragic 84.7% |
| Iroquois | 7.5 /100 | #222 | Tragic 84.6% |
| Immigrants | Uzbekistan | 7.1 /100 | #223 | Tragic 84.6% |
| French American Indians | 6.3 /100 | #224 | Tragic 84.6% |
| Immigrants | Thailand | 5.8 /100 | #225 | Tragic 84.5% |
| Immigrants | Zaire | 5.5 /100 | #226 | Tragic 84.5% |
| Immigrants | Costa Rica | 5.4 /100 | #227 | Tragic 84.5% |
| Immigrants | Liberia | 4.9 /100 | #228 | Tragic 84.4% |
| Immigrants | Uruguay | 4.6 /100 | #229 | Tragic 84.4% |
| Immigrants | Colombia | 4.5 /100 | #230 | Tragic 84.4% |
| Immigrants | Middle Africa | 4.3 /100 | #231 | Tragic 84.4% |
Demographics Similar to Immigrants from Hungary by GED/Equivalency
In terms of ged/equivalency, the demographic groups most similar to Immigrants from Hungary are Jordanian (87.2%, a difference of 0.010%), Indian (Asian) (87.1%, a difference of 0.010%), Lebanese (87.2%, a difference of 0.020%), Immigrants from Zimbabwe (87.1%, a difference of 0.030%), and Icelander (87.1%, a difference of 0.030%).
| Demographics | Rating | Rank | GED/Equivalency |
| Immigrants | Western Europe | 97.3 /100 | #97 | Exceptional 87.3% |
| Immigrants | Croatia | 96.9 /100 | #98 | Exceptional 87.3% |
| Immigrants | Belarus | 96.9 /100 | #99 | Exceptional 87.3% |
| Palestinians | 96.8 /100 | #100 | Exceptional 87.3% |
| Syrians | 96.6 /100 | #101 | Exceptional 87.2% |
| Lebanese | 96.2 /100 | #102 | Exceptional 87.2% |
| Jordanians | 96.1 /100 | #103 | Exceptional 87.2% |
| Immigrants | Hungary | 96.0 /100 | #104 | Exceptional 87.2% |
| Indians (Asian) | 95.9 /100 | #105 | Exceptional 87.1% |
| Immigrants | Zimbabwe | 95.8 /100 | #106 | Exceptional 87.1% |
| Icelanders | 95.7 /100 | #107 | Exceptional 87.1% |
| Canadians | 95.6 /100 | #108 | Exceptional 87.1% |
| Immigrants | Eastern Europe | 95.5 /100 | #109 | Exceptional 87.1% |
| Egyptians | 95.3 /100 | #110 | Exceptional 87.1% |
| French | 95.2 /100 | #111 | Exceptional 87.1% |