French American Indian vs Maltese GED/Equivalency
COMPARE
French American Indian
Maltese
GED/Equivalency
GED/Equivalency Comparison
French American Indians
Maltese
84.6%
GED/EQUIVALENCY
6.3/ 100
METRIC RATING
224th/ 347
METRIC RANK
88.6%
GED/EQUIVALENCY
99.9/ 100
METRIC RATING
20th/ 347
METRIC RANK
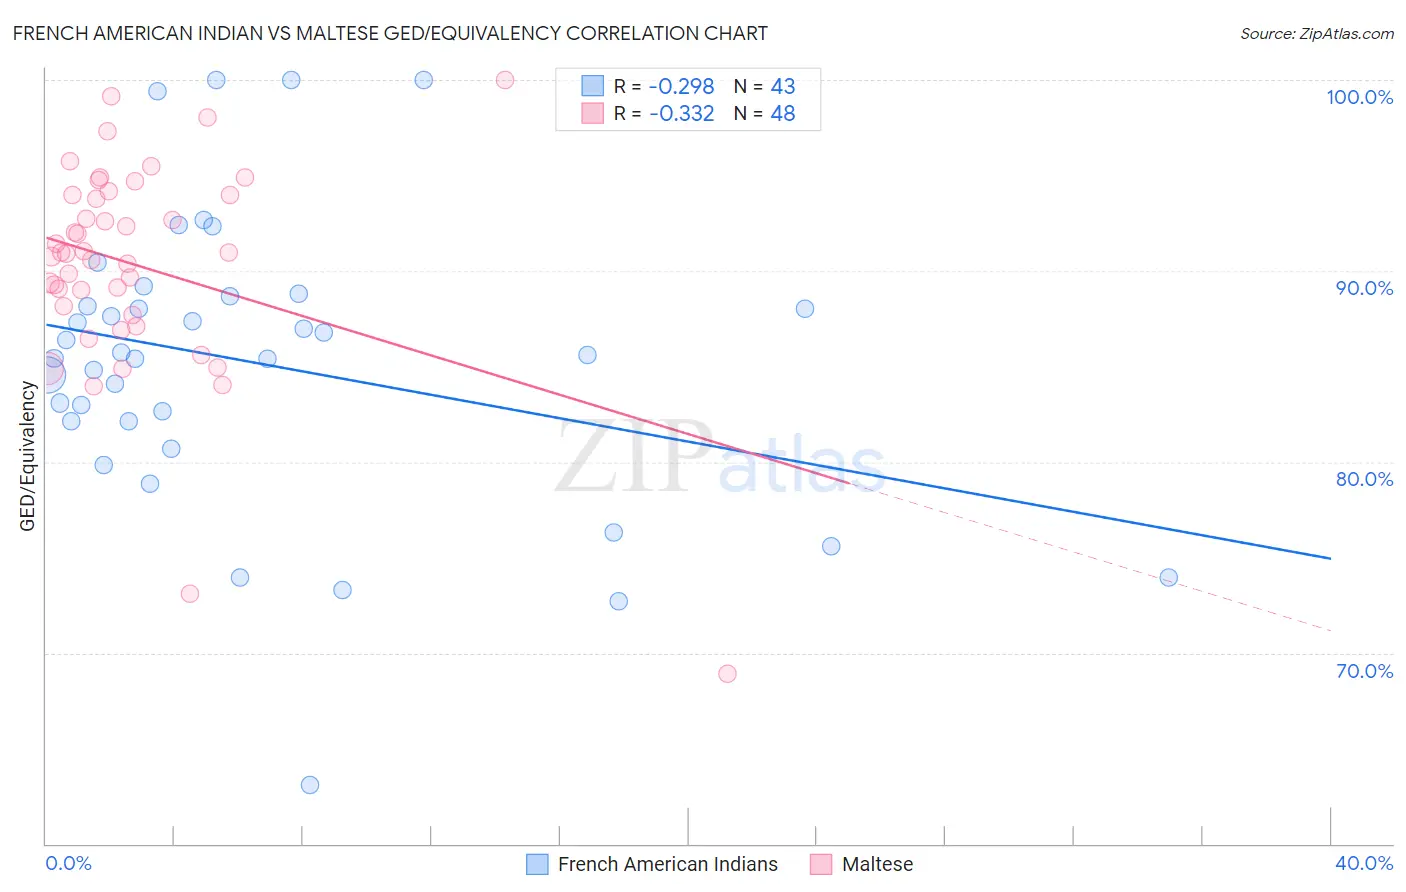
French American Indian vs Maltese GED/Equivalency Correlation Chart
The statistical analysis conducted on geographies consisting of 131,976,269 people shows a weak negative correlation between the proportion of French American Indians and percentage of population with at least ged/equivalency education in the United States with a correlation coefficient (R) of -0.298 and weighted average of 84.6%. Similarly, the statistical analysis conducted on geographies consisting of 126,478,070 people shows a mild negative correlation between the proportion of Maltese and percentage of population with at least ged/equivalency education in the United States with a correlation coefficient (R) of -0.332 and weighted average of 88.6%, a difference of 4.8%.
GED/Equivalency Correlation Summary
| Measurement | French American Indian | Maltese |
| Minimum | 63.0% | 68.9% |
| Maximum | 100.0% | 100.0% |
| Range | 37.0% | 31.1% |
| Mean | 85.2% | 90.3% |
| Median | 85.6% | 90.9% |
| Interquartile 25% (IQ1) | 82.1% | 87.9% |
| Interquartile 75% (IQ3) | 88.7% | 94.0% |
| Interquartile Range (IQR) | 6.6% | 6.0% |
| Standard Deviation (Sample) | 7.7% | 5.7% |
| Standard Deviation (Population) | 7.6% | 5.6% |
Similar Demographics by GED/Equivalency
Demographics Similar to French American Indians by GED/Equivalency
In terms of ged/equivalency, the demographic groups most similar to French American Indians are Immigrants from Thailand (84.5%, a difference of 0.050%), Immigrants from Uzbekistan (84.6%, a difference of 0.070%), Immigrants from Zaire (84.5%, a difference of 0.080%), Iroquois (84.6%, a difference of 0.090%), and Immigrants from Costa Rica (84.5%, a difference of 0.090%).
| Demographics | Rating | Rank | GED/Equivalency |
| Nigerians | 8.6 /100 | #217 | Tragic 84.7% |
| Alaska Natives | 8.6 /100 | #218 | Tragic 84.7% |
| Potawatomi | 8.2 /100 | #219 | Tragic 84.7% |
| Americans | 8.2 /100 | #220 | Tragic 84.7% |
| Taiwanese | 8.1 /100 | #221 | Tragic 84.7% |
| Iroquois | 7.5 /100 | #222 | Tragic 84.6% |
| Immigrants | Uzbekistan | 7.1 /100 | #223 | Tragic 84.6% |
| French American Indians | 6.3 /100 | #224 | Tragic 84.6% |
| Immigrants | Thailand | 5.8 /100 | #225 | Tragic 84.5% |
| Immigrants | Zaire | 5.5 /100 | #226 | Tragic 84.5% |
| Immigrants | Costa Rica | 5.4 /100 | #227 | Tragic 84.5% |
| Immigrants | Liberia | 4.9 /100 | #228 | Tragic 84.4% |
| Immigrants | Uruguay | 4.6 /100 | #229 | Tragic 84.4% |
| Immigrants | Colombia | 4.5 /100 | #230 | Tragic 84.4% |
| Immigrants | Middle Africa | 4.3 /100 | #231 | Tragic 84.4% |
Demographics Similar to Maltese by GED/Equivalency
In terms of ged/equivalency, the demographic groups most similar to Maltese are Luxembourger (88.6%, a difference of 0.010%), Immigrants from Ireland (88.6%, a difference of 0.020%), Russian (88.6%, a difference of 0.040%), Slovak (88.6%, a difference of 0.040%), and Estonian (88.6%, a difference of 0.040%).
| Demographics | Rating | Rank | GED/Equivalency |
| Immigrants | Iran | 99.9 /100 | #13 | Exceptional 88.9% |
| Cypriots | 99.9 /100 | #14 | Exceptional 88.9% |
| Okinawans | 99.9 /100 | #15 | Exceptional 88.9% |
| Immigrants | Taiwan | 99.9 /100 | #16 | Exceptional 88.8% |
| Croatians | 99.9 /100 | #17 | Exceptional 88.8% |
| Slovenes | 99.9 /100 | #18 | Exceptional 88.8% |
| Swedes | 99.9 /100 | #19 | Exceptional 88.8% |
| Maltese | 99.9 /100 | #20 | Exceptional 88.6% |
| Luxembourgers | 99.8 /100 | #21 | Exceptional 88.6% |
| Immigrants | Ireland | 99.8 /100 | #22 | Exceptional 88.6% |
| Russians | 99.8 /100 | #23 | Exceptional 88.6% |
| Slovaks | 99.8 /100 | #24 | Exceptional 88.6% |
| Estonians | 99.8 /100 | #25 | Exceptional 88.6% |
| Immigrants | Australia | 99.8 /100 | #26 | Exceptional 88.6% |
| Immigrants | Lithuania | 99.8 /100 | #27 | Exceptional 88.6% |