Comanche vs Hawaiian GED/Equivalency
COMPARE
Comanche
Hawaiian
GED/Equivalency
GED/Equivalency Comparison
Comanche
Hawaiians
83.6%
GED/EQUIVALENCY
0.7/ 100
METRIC RATING
253rd/ 347
METRIC RANK
85.0%
GED/EQUIVALENCY
15.2/ 100
METRIC RATING
204th/ 347
METRIC RANK
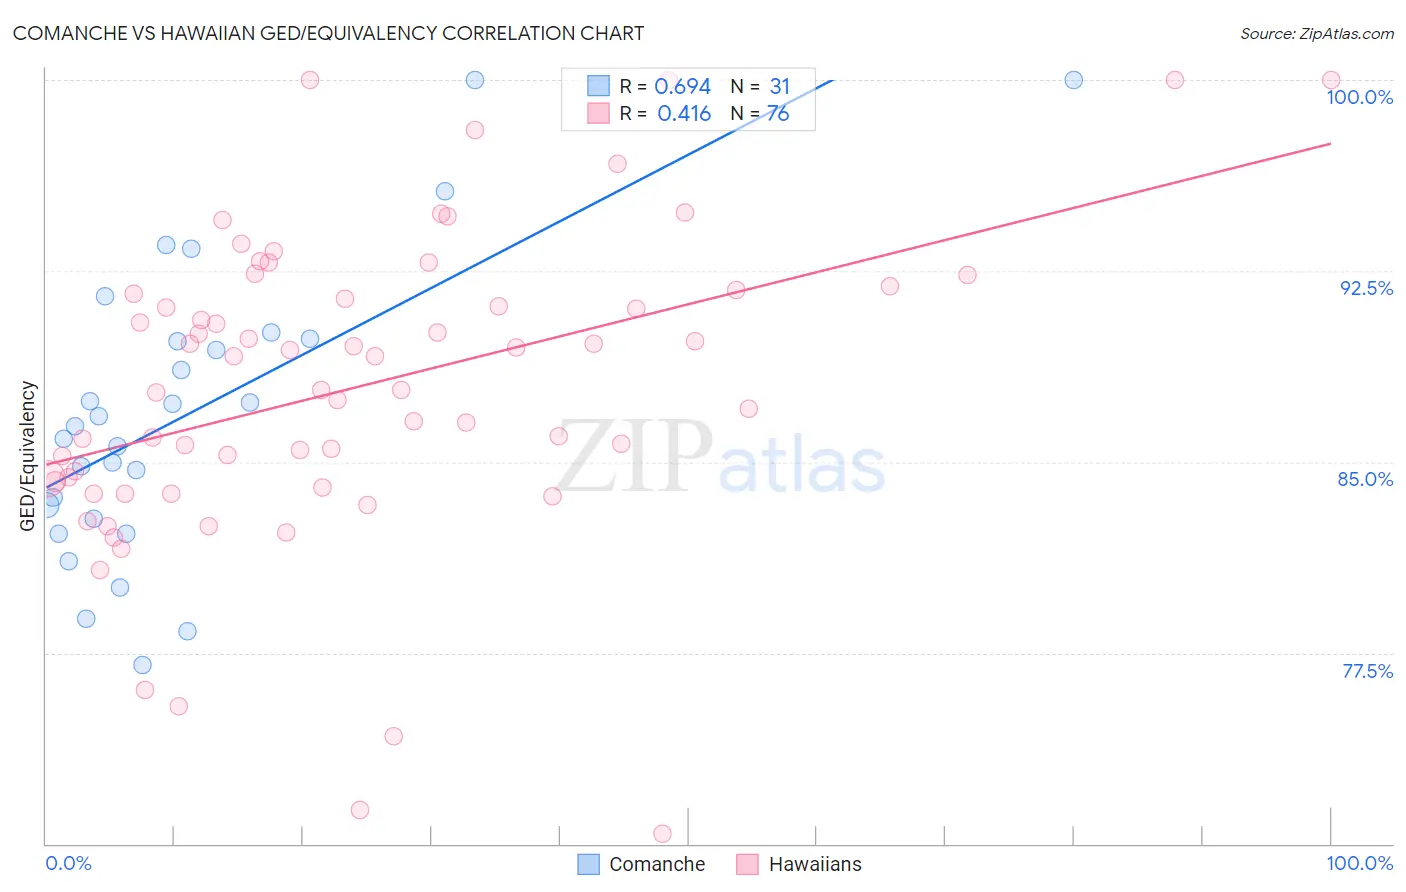
Comanche vs Hawaiian GED/Equivalency Correlation Chart
The statistical analysis conducted on geographies consisting of 109,786,530 people shows a significant positive correlation between the proportion of Comanche and percentage of population with at least ged/equivalency education in the United States with a correlation coefficient (R) of 0.694 and weighted average of 83.6%. Similarly, the statistical analysis conducted on geographies consisting of 327,620,955 people shows a moderate positive correlation between the proportion of Hawaiians and percentage of population with at least ged/equivalency education in the United States with a correlation coefficient (R) of 0.416 and weighted average of 85.0%, a difference of 1.7%.
GED/Equivalency Correlation Summary
| Measurement | Comanche | Hawaiian |
| Minimum | 77.0% | 70.4% |
| Maximum | 100.0% | 100.0% |
| Range | 23.0% | 29.6% |
| Mean | 86.9% | 87.9% |
| Median | 86.4% | 88.5% |
| Interquartile 25% (IQ1) | 82.8% | 84.3% |
| Interquartile 75% (IQ3) | 89.8% | 91.7% |
| Interquartile Range (IQR) | 7.1% | 7.4% |
| Standard Deviation (Sample) | 5.7% | 6.1% |
| Standard Deviation (Population) | 5.6% | 6.0% |
Similar Demographics by GED/Equivalency
Demographics Similar to Comanche by GED/Equivalency
In terms of ged/equivalency, the demographic groups most similar to Comanche are Creek (83.6%, a difference of 0.030%), Spanish American (83.6%, a difference of 0.060%), Bahamian (83.6%, a difference of 0.060%), Colville (83.4%, a difference of 0.20%), and African (83.4%, a difference of 0.20%).
| Demographics | Rating | Rank | GED/Equivalency |
| Chickasaw | 1.2 /100 | #246 | Tragic 83.8% |
| Immigrants | Western Africa | 1.1 /100 | #247 | Tragic 83.8% |
| Blackfeet | 1.1 /100 | #248 | Tragic 83.8% |
| Crow | 1.1 /100 | #249 | Tragic 83.8% |
| Shoshone | 1.0 /100 | #250 | Tragic 83.7% |
| Spanish Americans | 0.8 /100 | #251 | Tragic 83.6% |
| Bahamians | 0.8 /100 | #252 | Tragic 83.6% |
| Comanche | 0.7 /100 | #253 | Tragic 83.6% |
| Creek | 0.7 /100 | #254 | Tragic 83.6% |
| Colville | 0.5 /100 | #255 | Tragic 83.4% |
| Africans | 0.5 /100 | #256 | Tragic 83.4% |
| Jamaicans | 0.4 /100 | #257 | Tragic 83.3% |
| Malaysians | 0.4 /100 | #258 | Tragic 83.3% |
| Immigrants | Vietnam | 0.3 /100 | #259 | Tragic 83.2% |
| Choctaw | 0.3 /100 | #260 | Tragic 83.1% |
Demographics Similar to Hawaiians by GED/Equivalency
In terms of ged/equivalency, the demographic groups most similar to Hawaiians are Panamanian (85.0%, a difference of 0.0%), Uruguayan (85.0%, a difference of 0.030%), Portuguese (85.0%, a difference of 0.030%), Cree (85.0%, a difference of 0.030%), and Liberian (85.0%, a difference of 0.030%).
| Demographics | Rating | Rank | GED/Equivalency |
| Costa Ricans | 20.4 /100 | #197 | Fair 85.2% |
| Immigrants | Africa | 17.5 /100 | #198 | Poor 85.1% |
| Somalis | 16.4 /100 | #199 | Poor 85.0% |
| Uruguayans | 16.0 /100 | #200 | Poor 85.0% |
| Portuguese | 15.9 /100 | #201 | Poor 85.0% |
| Cree | 15.9 /100 | #202 | Poor 85.0% |
| Panamanians | 15.3 /100 | #203 | Poor 85.0% |
| Hawaiians | 15.2 /100 | #204 | Poor 85.0% |
| Liberians | 14.6 /100 | #205 | Poor 85.0% |
| Samoans | 13.7 /100 | #206 | Poor 84.9% |
| Hmong | 13.1 /100 | #207 | Poor 84.9% |
| Marshallese | 12.5 /100 | #208 | Poor 84.9% |
| Colombians | 12.3 /100 | #209 | Poor 84.9% |
| Immigrants | Cameroon | 12.1 /100 | #210 | Poor 84.9% |
| South Americans | 10.9 /100 | #211 | Poor 84.8% |