Immigrants from Ecuador Disability
COMPARE
Immigrants from Ecuador
Select to Compare
Disability
Immigrants from Ecuador Disability
11.2%
DISABILITY
98.0/ 100
METRIC RATING
93rd/ 347
METRIC RANK
Immigrants from Ecuador Disability Correlation Chart
The statistical analysis conducted on geographies consisting of 270,984,648 people shows a significant positive correlation between the proportion of Immigrants from Ecuador and percentage of population with a disability in the United States with a correlation coefficient (R) of 0.687 and weighted average of 11.2%. On average, for every 1% (one percent) increase in Immigrants from Ecuador within a typical geography, there is an increase of 0.41% in percentage of population with a disability.
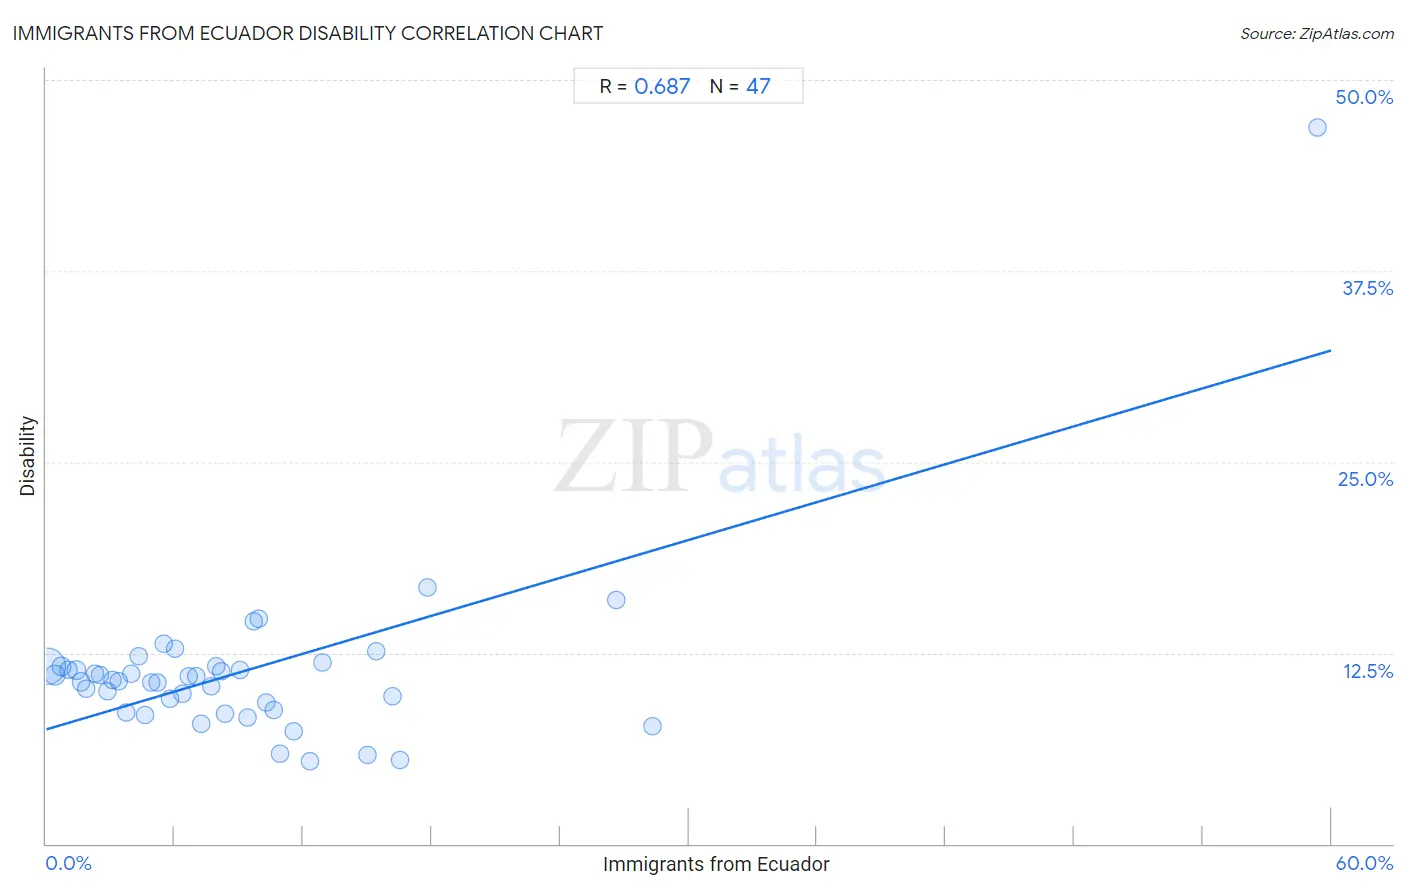
It is essential to understand that the correlation between the percentage of Immigrants from Ecuador and percentage of population with a disability does not imply a direct cause-and-effect relationship. It remains uncertain whether the presence of Immigrants from Ecuador influences an upward or downward trend in the level of percentage of population with a disability within an area, or if Immigrants from Ecuador simply ended up residing in those areas with higher or lower levels of percentage of population with a disability due to other factors.
Demographics Similar to Immigrants from Ecuador by Disability
In terms of disability, the demographic groups most similar to Immigrants from Ecuador are Ecuadorian (11.2%, a difference of 0.0%), Immigrants from Western Asia (11.2%, a difference of 0.040%), Immigrants from Brazil (11.2%, a difference of 0.060%), Immigrants from South Africa (11.2%, a difference of 0.11%), and Immigrants from Morocco (11.2%, a difference of 0.12%).
| Demographics | Rating | Rank | Disability |
| Immigrants from Russia | 98.9 /100 | #86 | Exceptional 11.1% |
| Palestinians | 98.9 /100 | #87 | Exceptional 11.1% |
| Immigrants from Romania | 98.5 /100 | #88 | Exceptional 11.2% |
| Immigrants from South Africa | 98.2 /100 | #89 | Exceptional 11.2% |
| Immigrants from Brazil | 98.1 /100 | #90 | Exceptional 11.2% |
| Immigrants from Western Asia | 98.1 /100 | #91 | Exceptional 11.2% |
| Ecuadorians | 98.0 /100 | #92 | Exceptional 11.2% |
| Immigrants from Ecuador | 98.0 /100 | #93 | Exceptional 11.2% |
| Immigrants from Morocco | 97.8 /100 | #94 | Exceptional 11.2% |
| Eastern Europeans | 97.8 /100 | #95 | Exceptional 11.2% |
| Immigrants from Zimbabwe | 97.7 /100 | #96 | Exceptional 11.2% |
| Bhutanese | 97.4 /100 | #97 | Exceptional 11.2% |
| Uruguayans | 97.4 /100 | #98 | Exceptional 11.2% |
| Immigrants from Czechoslovakia | 97.4 /100 | #99 | Exceptional 11.2% |
| Immigrants from Greece | 96.9 /100 | #100 | Exceptional 11.3% |
Immigrants from Ecuador Disability Correlation Summary
| Measurement | Immigrants from Ecuador Data | Disability Data |
| Minimum | 0.080% | 5.4% |
| Maximum | 59.4% | 46.9% |
| Range | 59.3% | 41.5% |
| Mean | 9.1% | 11.2% |
| Median | 7.0% | 10.8% |
| Interquartile 25% (IQ1) | 3.4% | 8.7% |
| Interquartile 75% (IQ3) | 10.9% | 11.7% |
| Interquartile Range (IQR) | 7.5% | 2.9% |
| Standard Deviation (Sample) | 9.7% | 5.8% |
| Standard Deviation (Population) | 9.6% | 5.8% |
Correlation Details
| Immigrants from Ecuador Percentile | Sample Size | Disability |
[ 0.0% - 0.5% ] 0.080% | 209,785,015 | 11.7% |
[ 0.0% - 0.5% ] 0.42% | 26,069,069 | 11.0% |
[ 0.5% - 1.0% ] 0.73% | 8,423,001 | 11.6% |
[ 1.0% - 1.5% ] 1.03% | 5,755,727 | 11.4% |
[ 1.0% - 1.5% ] 1.42% | 12,136,318 | 11.4% |
[ 1.5% - 2.0% ] 1.61% | 2,096,346 | 10.6% |
[ 1.5% - 2.0% ] 1.88% | 989,395 | 10.1% |
[ 2.0% - 2.5% ] 2.25% | 900,350 | 11.2% |
[ 2.5% - 3.0% ] 2.51% | 615,613 | 11.0% |
[ 2.5% - 3.0% ] 2.84% | 374,254 | 10.0% |
[ 3.0% - 3.5% ] 3.11% | 349,510 | 10.8% |
[ 3.0% - 3.5% ] 3.38% | 171,989 | 10.7% |
[ 3.5% - 4.0% ] 3.71% | 177,201 | 8.6% |
[ 3.5% - 4.0% ] 3.99% | 145,666 | 11.1% |
[ 4.0% - 4.5% ] 4.29% | 203,298 | 12.2% |
[ 4.5% - 5.0% ] 4.62% | 212,515 | 8.4% |
[ 4.5% - 5.0% ] 4.88% | 384,726 | 10.5% |
[ 5.0% - 5.5% ] 5.20% | 108,545 | 10.5% |
[ 5.0% - 5.5% ] 5.46% | 38,530 | 13.1% |
[ 5.5% - 6.0% ] 5.77% | 241,294 | 9.5% |
[ 6.0% - 6.5% ] 6.03% | 506,053 | 12.8% |
[ 6.0% - 6.5% ] 6.37% | 44,256 | 9.8% |
[ 6.5% - 7.0% ] 6.68% | 170,386 | 11.0% |
[ 6.5% - 7.0% ] 7.00% | 87,829 | 11.0% |
[ 7.0% - 7.5% ] 7.24% | 167,696 | 7.9% |
[ 7.5% - 8.0% ] 7.68% | 32,177 | 10.3% |
[ 7.5% - 8.0% ] 7.91% | 128,918 | 11.7% |
[ 8.0% - 8.5% ] 8.14% | 117,803 | 11.3% |
[ 8.0% - 8.5% ] 8.37% | 124,391 | 8.5% |
[ 9.0% - 9.5% ] 9.03% | 58,717 | 11.4% |
[ 9.0% - 9.5% ] 9.41% | 5,864 | 8.3% |
[ 9.5% - 10.0% ] 9.66% | 28,230 | 14.5% |
[ 9.5% - 10.0% ] 9.94% | 79,800 | 14.7% |
[ 10.0% - 10.5% ] 10.30% | 14,649 | 9.3% |
[ 10.5% - 11.0% ] 10.62% | 640 | 8.7% |
[ 10.5% - 11.0% ] 10.89% | 8,776 | 5.9% |
[ 11.5% - 12.0% ] 11.54% | 8,178 | 7.4% |
[ 12.0% - 12.5% ] 12.30% | 21,040 | 5.4% |
[ 12.5% - 13.0% ] 12.90% | 6,951 | 11.9% |
[ 15.0% - 15.5% ] 15.02% | 10,026 | 5.8% |
[ 15.0% - 15.5% ] 15.38% | 4,407 | 12.6% |
[ 16.0% - 16.5% ] 16.14% | 112,750 | 9.7% |
[ 16.5% - 17.0% ] 16.50% | 5,587 | 5.5% |
[ 17.5% - 18.0% ] 17.80% | 57,927 | 16.8% |
[ 26.5% - 27.0% ] 26.60% | 485 | 15.9% |
[ 28.0% - 28.5% ] 28.33% | 2,718 | 7.7% |
[ 59.0% - 59.5% ] 59.38% | 32 | 46.9% |