Guamanian/Chamorro vs Immigrants from Russia Disability
COMPARE
Guamanian/Chamorro
Immigrants from Russia
Disability
Disability Comparison
Guamanians/Chamorros
Immigrants from Russia
12.3%
DISABILITY
1.4/ 100
METRIC RATING
248th/ 347
METRIC RANK
11.1%
DISABILITY
98.9/ 100
METRIC RATING
86th/ 347
METRIC RANK
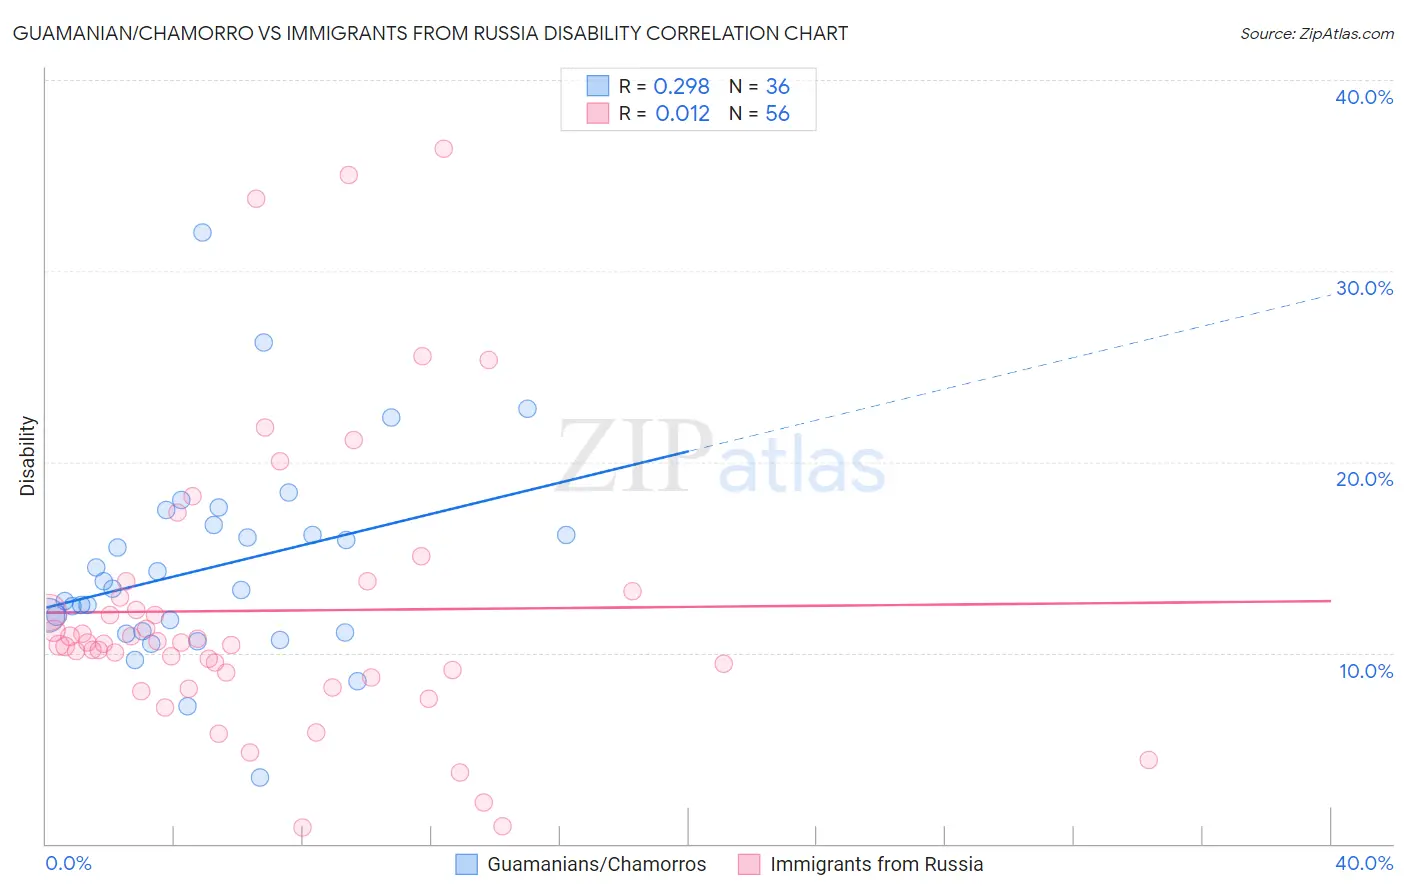
Guamanian/Chamorro vs Immigrants from Russia Disability Correlation Chart
The statistical analysis conducted on geographies consisting of 221,898,550 people shows a weak positive correlation between the proportion of Guamanians/Chamorros and percentage of population with a disability in the United States with a correlation coefficient (R) of 0.298 and weighted average of 12.3%. Similarly, the statistical analysis conducted on geographies consisting of 347,926,154 people shows no correlation between the proportion of Immigrants from Russia and percentage of population with a disability in the United States with a correlation coefficient (R) of 0.012 and weighted average of 11.1%, a difference of 10.2%.
Disability Correlation Summary
| Measurement | Guamanian/Chamorro | Immigrants from Russia |
| Minimum | 3.4% | 0.87% |
| Maximum | 32.0% | 36.4% |
| Range | 28.6% | 35.5% |
| Mean | 14.4% | 12.2% |
| Median | 13.3% | 10.5% |
| Interquartile 25% (IQ1) | 11.1% | 8.9% |
| Interquartile 75% (IQ3) | 16.4% | 13.1% |
| Interquartile Range (IQR) | 5.3% | 4.2% |
| Standard Deviation (Sample) | 5.3% | 7.5% |
| Standard Deviation (Population) | 5.2% | 7.4% |
Similar Demographics by Disability
Demographics Similar to Guamanians/Chamorros by Disability
In terms of disability, the demographic groups most similar to Guamanians/Chamorros are Carpatho Rusyn (12.3%, a difference of 0.010%), Subsaharan African (12.3%, a difference of 0.020%), European (12.3%, a difference of 0.020%), Indonesian (12.2%, a difference of 0.040%), and Swiss (12.2%, a difference of 0.070%).
| Demographics | Rating | Rank | Disability |
| Yugoslavians | 1.7 /100 | #241 | Tragic 12.2% |
| Poles | 1.7 /100 | #242 | Tragic 12.2% |
| British | 1.5 /100 | #243 | Tragic 12.2% |
| Basques | 1.5 /100 | #244 | Tragic 12.2% |
| Liberians | 1.5 /100 | #245 | Tragic 12.2% |
| Swiss | 1.5 /100 | #246 | Tragic 12.2% |
| Indonesians | 1.4 /100 | #247 | Tragic 12.2% |
| Guamanians/Chamorros | 1.4 /100 | #248 | Tragic 12.3% |
| Carpatho Rusyns | 1.4 /100 | #249 | Tragic 12.3% |
| Sub-Saharan Africans | 1.4 /100 | #250 | Tragic 12.3% |
| Europeans | 1.4 /100 | #251 | Tragic 12.3% |
| Bermudans | 1.1 /100 | #252 | Tragic 12.3% |
| Belgians | 0.8 /100 | #253 | Tragic 12.3% |
| German Russians | 0.8 /100 | #254 | Tragic 12.3% |
| Slovenes | 0.6 /100 | #255 | Tragic 12.4% |
Demographics Similar to Immigrants from Russia by Disability
In terms of disability, the demographic groups most similar to Immigrants from Russia are Immigrants from Belarus (11.1%, a difference of 0.0%), Palestinian (11.1%, a difference of 0.040%), Immigrants from Sierra Leone (11.1%, a difference of 0.15%), Immigrants from Switzerland (11.1%, a difference of 0.17%), and Chilean (11.1%, a difference of 0.20%).
| Demographics | Rating | Rank | Disability |
| Immigrants | Jordan | 99.3 /100 | #79 | Exceptional 11.1% |
| Immigrants | Ireland | 99.3 /100 | #80 | Exceptional 11.1% |
| Immigrants | Poland | 99.1 /100 | #81 | Exceptional 11.1% |
| Chileans | 99.1 /100 | #82 | Exceptional 11.1% |
| Immigrants | Switzerland | 99.0 /100 | #83 | Exceptional 11.1% |
| Immigrants | Sierra Leone | 99.0 /100 | #84 | Exceptional 11.1% |
| Immigrants | Belarus | 98.9 /100 | #85 | Exceptional 11.1% |
| Immigrants | Russia | 98.9 /100 | #86 | Exceptional 11.1% |
| Palestinians | 98.9 /100 | #87 | Exceptional 11.1% |
| Immigrants | Romania | 98.5 /100 | #88 | Exceptional 11.2% |
| Immigrants | South Africa | 98.2 /100 | #89 | Exceptional 11.2% |
| Immigrants | Brazil | 98.1 /100 | #90 | Exceptional 11.2% |
| Immigrants | Western Asia | 98.1 /100 | #91 | Exceptional 11.2% |
| Ecuadorians | 98.0 /100 | #92 | Exceptional 11.2% |
| Immigrants | Ecuador | 98.0 /100 | #93 | Exceptional 11.2% |