Guamanian/Chamorro vs Croatian Disability
COMPARE
Guamanian/Chamorro
Croatian
Disability
Disability Comparison
Guamanians/Chamorros
Croatians
12.3%
DISABILITY
1.4/ 100
METRIC RATING
248th/ 347
METRIC RANK
12.1%
DISABILITY
4.9/ 100
METRIC RATING
219th/ 347
METRIC RANK
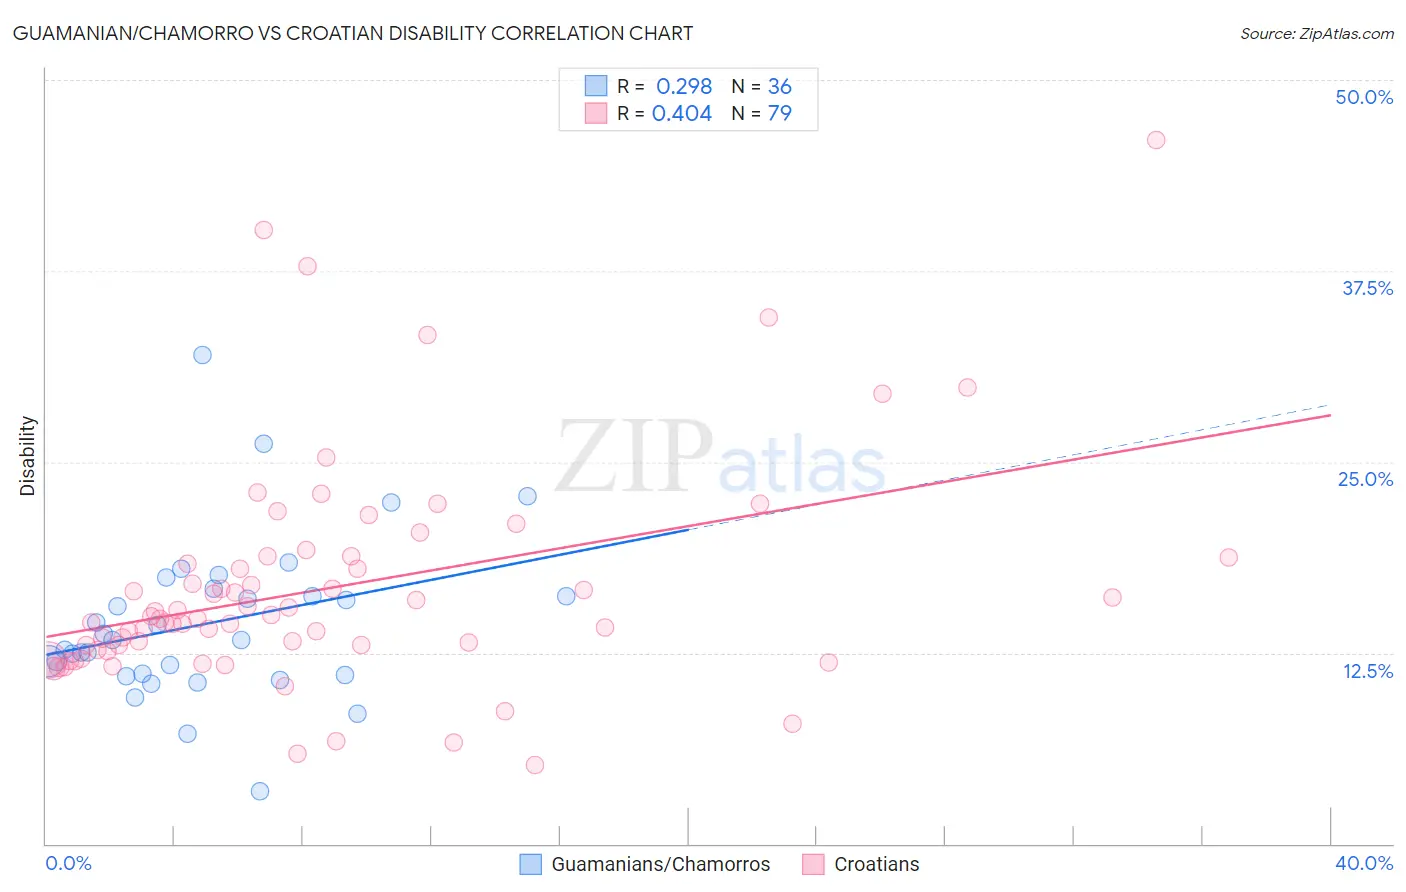
Guamanian/Chamorro vs Croatian Disability Correlation Chart
The statistical analysis conducted on geographies consisting of 221,898,550 people shows a weak positive correlation between the proportion of Guamanians/Chamorros and percentage of population with a disability in the United States with a correlation coefficient (R) of 0.298 and weighted average of 12.3%. Similarly, the statistical analysis conducted on geographies consisting of 375,710,969 people shows a moderate positive correlation between the proportion of Croatians and percentage of population with a disability in the United States with a correlation coefficient (R) of 0.404 and weighted average of 12.1%, a difference of 1.4%.
Disability Correlation Summary
| Measurement | Guamanian/Chamorro | Croatian |
| Minimum | 3.4% | 5.2% |
| Maximum | 32.0% | 46.0% |
| Range | 28.6% | 40.9% |
| Mean | 14.4% | 16.7% |
| Median | 13.3% | 14.7% |
| Interquartile 25% (IQ1) | 11.1% | 12.7% |
| Interquartile 75% (IQ3) | 16.4% | 18.8% |
| Interquartile Range (IQR) | 5.3% | 6.1% |
| Standard Deviation (Sample) | 5.3% | 7.4% |
| Standard Deviation (Population) | 5.2% | 7.3% |
Similar Demographics by Disability
Demographics Similar to Guamanians/Chamorros by Disability
In terms of disability, the demographic groups most similar to Guamanians/Chamorros are Carpatho Rusyn (12.3%, a difference of 0.010%), Subsaharan African (12.3%, a difference of 0.020%), European (12.3%, a difference of 0.020%), Indonesian (12.2%, a difference of 0.040%), and Swiss (12.2%, a difference of 0.070%).
| Demographics | Rating | Rank | Disability |
| Yugoslavians | 1.7 /100 | #241 | Tragic 12.2% |
| Poles | 1.7 /100 | #242 | Tragic 12.2% |
| British | 1.5 /100 | #243 | Tragic 12.2% |
| Basques | 1.5 /100 | #244 | Tragic 12.2% |
| Liberians | 1.5 /100 | #245 | Tragic 12.2% |
| Swiss | 1.5 /100 | #246 | Tragic 12.2% |
| Indonesians | 1.4 /100 | #247 | Tragic 12.2% |
| Guamanians/Chamorros | 1.4 /100 | #248 | Tragic 12.3% |
| Carpatho Rusyns | 1.4 /100 | #249 | Tragic 12.3% |
| Sub-Saharan Africans | 1.4 /100 | #250 | Tragic 12.3% |
| Europeans | 1.4 /100 | #251 | Tragic 12.3% |
| Bermudans | 1.1 /100 | #252 | Tragic 12.3% |
| Belgians | 0.8 /100 | #253 | Tragic 12.3% |
| German Russians | 0.8 /100 | #254 | Tragic 12.3% |
| Slovenes | 0.6 /100 | #255 | Tragic 12.4% |
Demographics Similar to Croatians by Disability
In terms of disability, the demographic groups most similar to Croatians are Immigrants from Jamaica (12.1%, a difference of 0.040%), Immigrants from Bahamas (12.1%, a difference of 0.040%), Panamanian (12.1%, a difference of 0.11%), Immigrants from North America (12.1%, a difference of 0.11%), and Northern European (12.1%, a difference of 0.16%).
| Demographics | Rating | Rank | Disability |
| Austrians | 7.2 /100 | #212 | Tragic 12.0% |
| Immigrants | Iraq | 7.1 /100 | #213 | Tragic 12.0% |
| Immigrants | Somalia | 6.8 /100 | #214 | Tragic 12.0% |
| Immigrants | Canada | 6.1 /100 | #215 | Tragic 12.1% |
| Panamanians | 5.4 /100 | #216 | Tragic 12.1% |
| Immigrants | North America | 5.3 /100 | #217 | Tragic 12.1% |
| Immigrants | Jamaica | 5.0 /100 | #218 | Tragic 12.1% |
| Croatians | 4.9 /100 | #219 | Tragic 12.1% |
| Immigrants | Bahamas | 4.7 /100 | #220 | Tragic 12.1% |
| Northern Europeans | 4.2 /100 | #221 | Tragic 12.1% |
| Spanish American Indians | 4.1 /100 | #222 | Tragic 12.1% |
| Hispanics or Latinos | 3.9 /100 | #223 | Tragic 12.1% |
| Mexicans | 3.7 /100 | #224 | Tragic 12.1% |
| Senegalese | 3.5 /100 | #225 | Tragic 12.1% |
| Jamaicans | 3.3 /100 | #226 | Tragic 12.1% |