Guamanian/Chamorro vs Navajo Disability
COMPARE
Guamanian/Chamorro
Navajo
Disability
Disability Comparison
Guamanians/Chamorros
Navajo
12.3%
DISABILITY
1.4/ 100
METRIC RATING
248th/ 347
METRIC RANK
14.3%
DISABILITY
0.0/ 100
METRIC RATING
330th/ 347
METRIC RANK
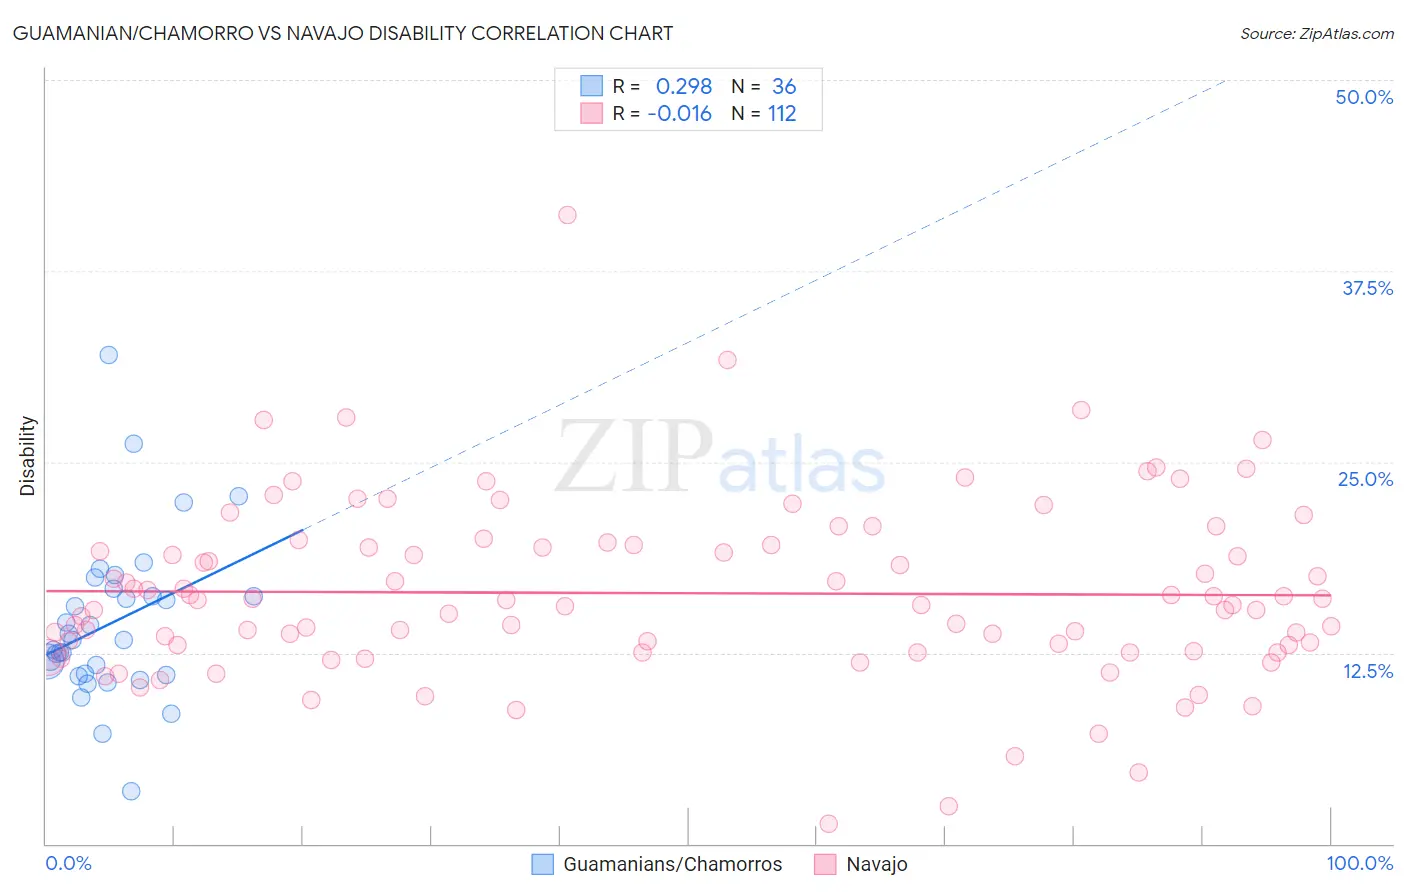
Guamanian/Chamorro vs Navajo Disability Correlation Chart
The statistical analysis conducted on geographies consisting of 221,898,550 people shows a weak positive correlation between the proportion of Guamanians/Chamorros and percentage of population with a disability in the United States with a correlation coefficient (R) of 0.298 and weighted average of 12.3%. Similarly, the statistical analysis conducted on geographies consisting of 224,790,018 people shows no correlation between the proportion of Navajo and percentage of population with a disability in the United States with a correlation coefficient (R) of -0.016 and weighted average of 14.3%, a difference of 16.4%.
Disability Correlation Summary
| Measurement | Guamanian/Chamorro | Navajo |
| Minimum | 3.4% | 1.3% |
| Maximum | 32.0% | 41.2% |
| Range | 28.6% | 39.9% |
| Mean | 14.4% | 16.4% |
| Median | 13.3% | 15.8% |
| Interquartile 25% (IQ1) | 11.1% | 12.8% |
| Interquartile 75% (IQ3) | 16.4% | 19.5% |
| Interquartile Range (IQR) | 5.3% | 6.7% |
| Standard Deviation (Sample) | 5.3% | 5.9% |
| Standard Deviation (Population) | 5.2% | 5.8% |
Similar Demographics by Disability
Demographics Similar to Guamanians/Chamorros by Disability
In terms of disability, the demographic groups most similar to Guamanians/Chamorros are Carpatho Rusyn (12.3%, a difference of 0.010%), Subsaharan African (12.3%, a difference of 0.020%), European (12.3%, a difference of 0.020%), Indonesian (12.2%, a difference of 0.040%), and Swiss (12.2%, a difference of 0.070%).
| Demographics | Rating | Rank | Disability |
| Yugoslavians | 1.7 /100 | #241 | Tragic 12.2% |
| Poles | 1.7 /100 | #242 | Tragic 12.2% |
| British | 1.5 /100 | #243 | Tragic 12.2% |
| Basques | 1.5 /100 | #244 | Tragic 12.2% |
| Liberians | 1.5 /100 | #245 | Tragic 12.2% |
| Swiss | 1.5 /100 | #246 | Tragic 12.2% |
| Indonesians | 1.4 /100 | #247 | Tragic 12.2% |
| Guamanians/Chamorros | 1.4 /100 | #248 | Tragic 12.3% |
| Carpatho Rusyns | 1.4 /100 | #249 | Tragic 12.3% |
| Sub-Saharan Africans | 1.4 /100 | #250 | Tragic 12.3% |
| Europeans | 1.4 /100 | #251 | Tragic 12.3% |
| Bermudans | 1.1 /100 | #252 | Tragic 12.3% |
| Belgians | 0.8 /100 | #253 | Tragic 12.3% |
| German Russians | 0.8 /100 | #254 | Tragic 12.3% |
| Slovenes | 0.6 /100 | #255 | Tragic 12.4% |
Demographics Similar to Navajo by Disability
In terms of disability, the demographic groups most similar to Navajo are Potawatomi (14.2%, a difference of 0.59%), Ottawa (14.2%, a difference of 0.71%), Immigrants from the Azores (14.2%, a difference of 0.71%), Osage (14.2%, a difference of 0.73%), and Native/Alaskan (14.2%, a difference of 0.76%).
| Demographics | Rating | Rank | Disability |
| Comanche | 0.0 /100 | #323 | Tragic 14.1% |
| Chippewa | 0.0 /100 | #324 | Tragic 14.1% |
| Natives/Alaskans | 0.0 /100 | #325 | Tragic 14.2% |
| Osage | 0.0 /100 | #326 | Tragic 14.2% |
| Ottawa | 0.0 /100 | #327 | Tragic 14.2% |
| Immigrants | Azores | 0.0 /100 | #328 | Tragic 14.2% |
| Potawatomi | 0.0 /100 | #329 | Tragic 14.2% |
| Navajo | 0.0 /100 | #330 | Tragic 14.3% |
| Alaskan Athabascans | 0.0 /100 | #331 | Tragic 14.4% |
| Pueblo | 0.0 /100 | #332 | Tragic 14.4% |
| Cajuns | 0.0 /100 | #333 | Tragic 14.6% |
| Yuman | 0.0 /100 | #334 | Tragic 14.6% |
| Tohono O'odham | 0.0 /100 | #335 | Tragic 14.8% |
| Cherokee | 0.0 /100 | #336 | Tragic 14.8% |
| Seminole | 0.0 /100 | #337 | Tragic 14.9% |