Guamanian/Chamorro vs Immigrants from Croatia Disability
COMPARE
Guamanian/Chamorro
Immigrants from Croatia
Disability
Disability Comparison
Guamanians/Chamorros
Immigrants from Croatia
12.3%
DISABILITY
1.4/ 100
METRIC RATING
248th/ 347
METRIC RANK
11.4%
DISABILITY
89.8/ 100
METRIC RATING
131st/ 347
METRIC RANK
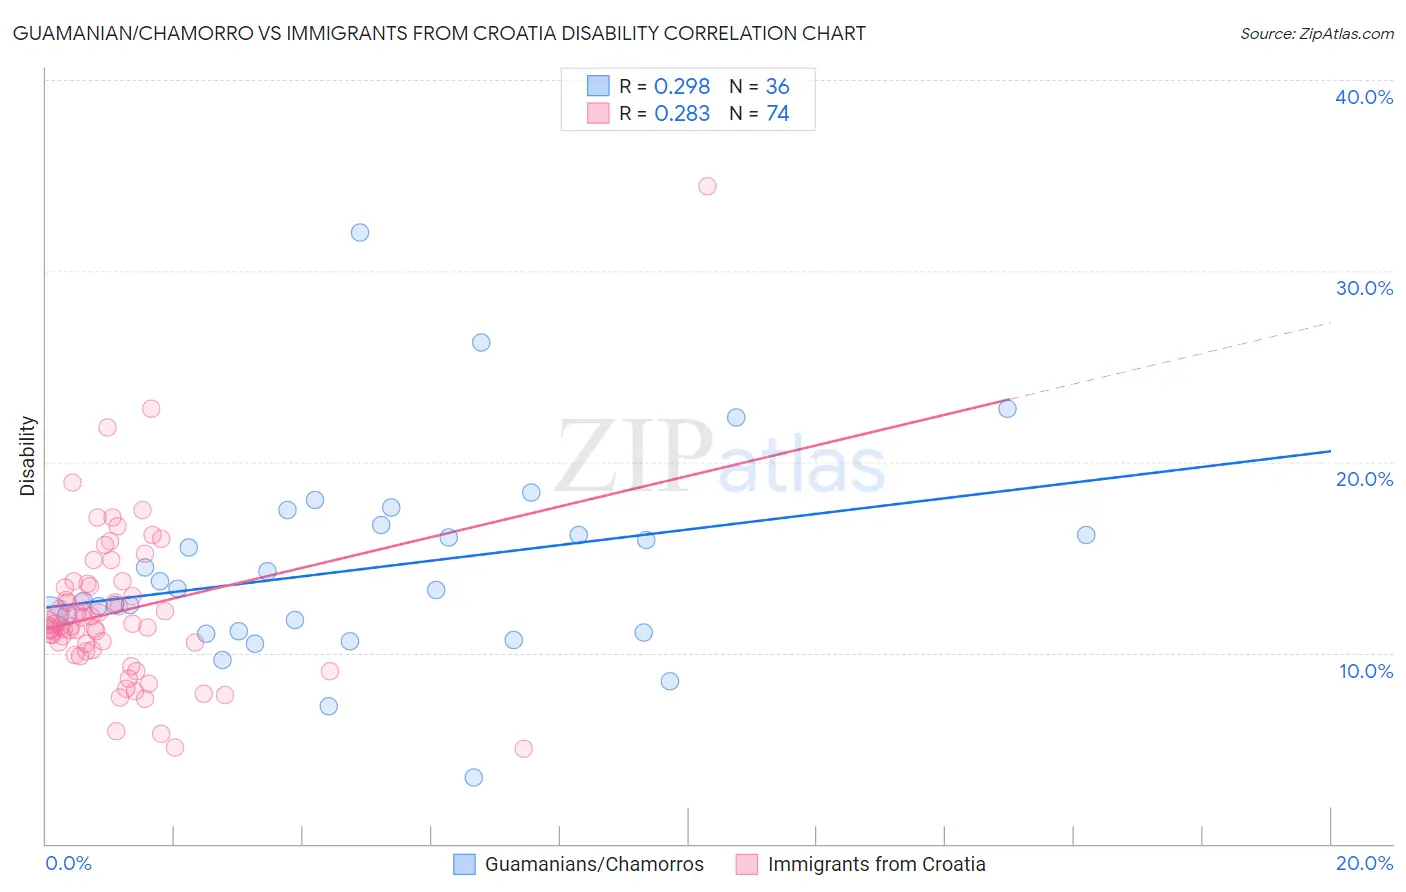
Guamanian/Chamorro vs Immigrants from Croatia Disability Correlation Chart
The statistical analysis conducted on geographies consisting of 221,898,550 people shows a weak positive correlation between the proportion of Guamanians/Chamorros and percentage of population with a disability in the United States with a correlation coefficient (R) of 0.298 and weighted average of 12.3%. Similarly, the statistical analysis conducted on geographies consisting of 132,571,649 people shows a weak positive correlation between the proportion of Immigrants from Croatia and percentage of population with a disability in the United States with a correlation coefficient (R) of 0.283 and weighted average of 11.4%, a difference of 7.3%.
Disability Correlation Summary
| Measurement | Guamanian/Chamorro | Immigrants from Croatia |
| Minimum | 3.4% | 5.0% |
| Maximum | 32.0% | 34.4% |
| Range | 28.6% | 29.5% |
| Mean | 14.4% | 12.2% |
| Median | 13.3% | 11.5% |
| Interquartile 25% (IQ1) | 11.1% | 10.1% |
| Interquartile 75% (IQ3) | 16.4% | 13.5% |
| Interquartile Range (IQR) | 5.3% | 3.4% |
| Standard Deviation (Sample) | 5.3% | 4.3% |
| Standard Deviation (Population) | 5.2% | 4.2% |
Similar Demographics by Disability
Demographics Similar to Guamanians/Chamorros by Disability
In terms of disability, the demographic groups most similar to Guamanians/Chamorros are Carpatho Rusyn (12.3%, a difference of 0.010%), Subsaharan African (12.3%, a difference of 0.020%), European (12.3%, a difference of 0.020%), Indonesian (12.2%, a difference of 0.040%), and Swiss (12.2%, a difference of 0.070%).
| Demographics | Rating | Rank | Disability |
| Yugoslavians | 1.7 /100 | #241 | Tragic 12.2% |
| Poles | 1.7 /100 | #242 | Tragic 12.2% |
| British | 1.5 /100 | #243 | Tragic 12.2% |
| Basques | 1.5 /100 | #244 | Tragic 12.2% |
| Liberians | 1.5 /100 | #245 | Tragic 12.2% |
| Swiss | 1.5 /100 | #246 | Tragic 12.2% |
| Indonesians | 1.4 /100 | #247 | Tragic 12.2% |
| Guamanians/Chamorros | 1.4 /100 | #248 | Tragic 12.3% |
| Carpatho Rusyns | 1.4 /100 | #249 | Tragic 12.3% |
| Sub-Saharan Africans | 1.4 /100 | #250 | Tragic 12.3% |
| Europeans | 1.4 /100 | #251 | Tragic 12.3% |
| Bermudans | 1.1 /100 | #252 | Tragic 12.3% |
| Belgians | 0.8 /100 | #253 | Tragic 12.3% |
| German Russians | 0.8 /100 | #254 | Tragic 12.3% |
| Slovenes | 0.6 /100 | #255 | Tragic 12.4% |
Demographics Similar to Immigrants from Croatia by Disability
In terms of disability, the demographic groups most similar to Immigrants from Croatia are Latvian (11.4%, a difference of 0.010%), Macedonian (11.4%, a difference of 0.060%), Immigrants from Africa (11.4%, a difference of 0.060%), Immigrants from Italy (11.4%, a difference of 0.080%), and Immigrants from Europe (11.4%, a difference of 0.080%).
| Demographics | Rating | Rank | Disability |
| South American Indians | 92.2 /100 | #124 | Exceptional 11.4% |
| Costa Ricans | 91.9 /100 | #125 | Exceptional 11.4% |
| Immigrants | Latvia | 90.9 /100 | #126 | Exceptional 11.4% |
| Immigrants | Italy | 90.4 /100 | #127 | Exceptional 11.4% |
| Immigrants | Europe | 90.4 /100 | #128 | Exceptional 11.4% |
| Macedonians | 90.3 /100 | #129 | Exceptional 11.4% |
| Latvians | 89.8 /100 | #130 | Excellent 11.4% |
| Immigrants | Croatia | 89.8 /100 | #131 | Excellent 11.4% |
| Immigrants | Africa | 89.3 /100 | #132 | Excellent 11.4% |
| Arabs | 89.1 /100 | #133 | Excellent 11.4% |
| Immigrants | Guyana | 88.3 /100 | #134 | Excellent 11.4% |
| Ugandans | 87.9 /100 | #135 | Excellent 11.4% |
| Immigrants | St. Vincent and the Grenadines | 87.8 /100 | #136 | Excellent 11.4% |
| Kenyans | 87.1 /100 | #137 | Excellent 11.5% |
| New Zealanders | 87.0 /100 | #138 | Excellent 11.5% |