Uruguayan Disability
COMPARE
Uruguayan
Select to Compare
Disability
Uruguayan Disability
11.2%
DISABILITY
97.4/ 100
METRIC RATING
98th/ 347
METRIC RANK
Uruguayan Disability Correlation Chart
The statistical analysis conducted on geographies consisting of 144,784,951 people shows a mild positive correlation between the proportion of Uruguayans and percentage of population with a disability in the United States with a correlation coefficient (R) of 0.378 and weighted average of 11.2%. On average, for every 1% (one percent) increase in Uruguayans within a typical geography, there is an increase of 0.46% in percentage of population with a disability.
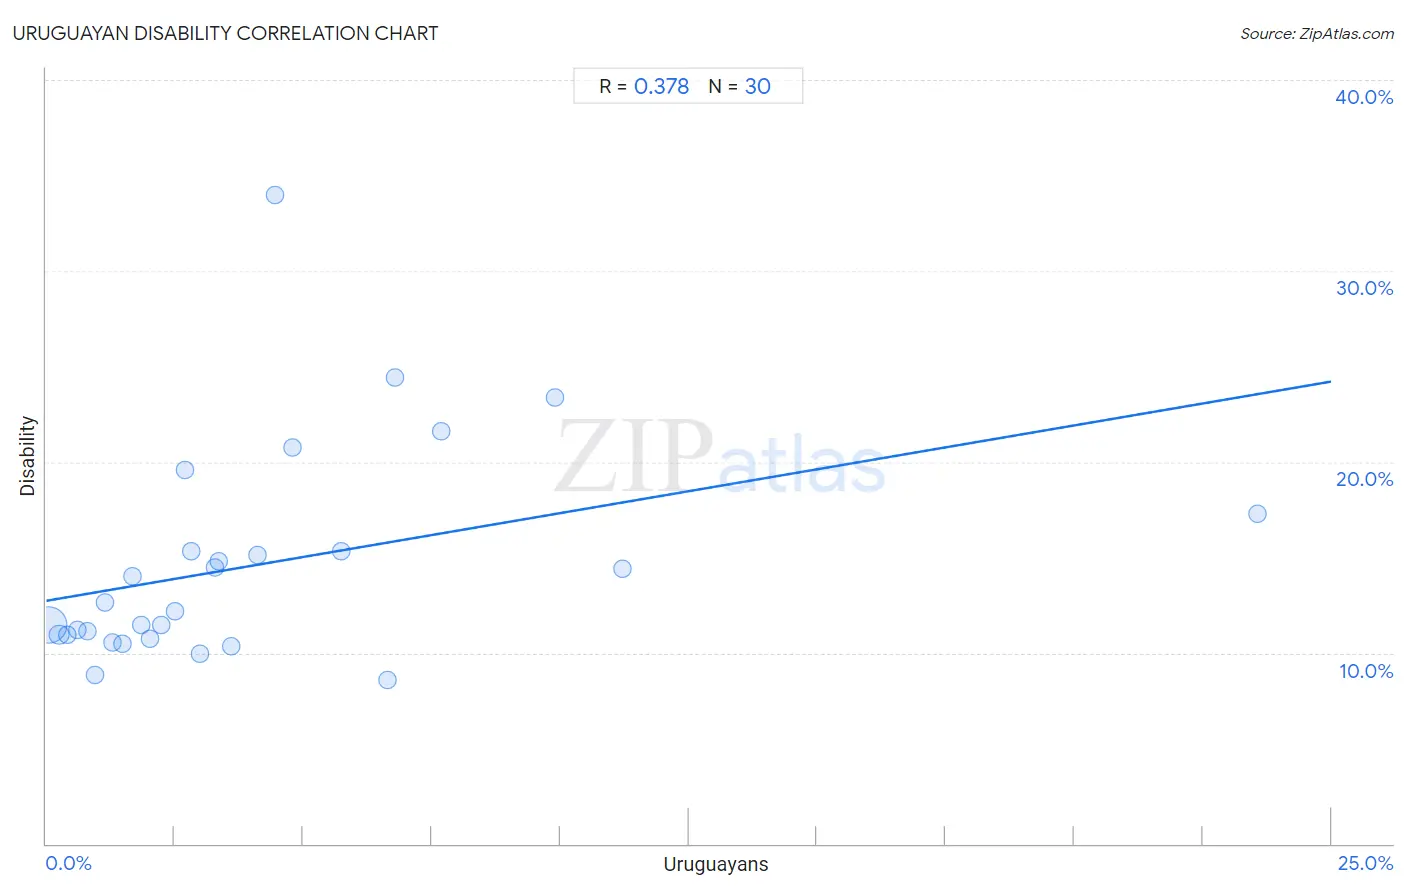
It is essential to understand that the correlation between the percentage of Uruguayans and percentage of population with a disability does not imply a direct cause-and-effect relationship. It remains uncertain whether the presence of Uruguayans influences an upward or downward trend in the level of percentage of population with a disability within an area, or if Uruguayans simply ended up residing in those areas with higher or lower levels of percentage of population with a disability due to other factors.
Demographics Similar to Uruguayans by Disability
In terms of disability, the demographic groups most similar to Uruguayans are Bhutanese (11.2%, a difference of 0.0%), Immigrants from Czechoslovakia (11.2%, a difference of 0.010%), Immigrants from Zimbabwe (11.2%, a difference of 0.14%), Immigrants from Greece (11.3%, a difference of 0.18%), and Immigrants from Morocco (11.2%, a difference of 0.21%).
| Demographics | Rating | Rank | Disability |
| Immigrants from Western Asia | 98.1 /100 | #91 | Exceptional 11.2% |
| Ecuadorians | 98.0 /100 | #92 | Exceptional 11.2% |
| Immigrants from Ecuador | 98.0 /100 | #93 | Exceptional 11.2% |
| Immigrants from Morocco | 97.8 /100 | #94 | Exceptional 11.2% |
| Eastern Europeans | 97.8 /100 | #95 | Exceptional 11.2% |
| Immigrants from Zimbabwe | 97.7 /100 | #96 | Exceptional 11.2% |
| Bhutanese | 97.4 /100 | #97 | Exceptional 11.2% |
| Uruguayans | 97.4 /100 | #98 | Exceptional 11.2% |
| Immigrants from Czechoslovakia | 97.4 /100 | #99 | Exceptional 11.2% |
| Immigrants from Greece | 96.9 /100 | #100 | Exceptional 11.3% |
| Immigrants from Nicaragua | 96.8 /100 | #101 | Exceptional 11.3% |
| Immigrants from Eastern Africa | 96.7 /100 | #102 | Exceptional 11.3% |
| Immigrants from Uruguay | 96.4 /100 | #103 | Exceptional 11.3% |
| Immigrants | 96.4 /100 | #104 | Exceptional 11.3% |
| Immigrants from Kazakhstan | 96.4 /100 | #105 | Exceptional 11.3% |
Uruguayan Disability Correlation Summary
| Measurement | Uruguayan Data | Disability Data |
| Minimum | 0.040% | 8.6% |
| Maximum | 23.6% | 34.0% |
| Range | 23.5% | 25.4% |
| Mean | 4.0% | 14.6% |
| Median | 2.8% | 12.4% |
| Interquartile 25% (IQ1) | 1.3% | 10.9% |
| Interquartile 75% (IQ3) | 4.8% | 15.3% |
| Interquartile Range (IQR) | 3.5% | 4.4% |
| Standard Deviation (Sample) | 4.6% | 5.6% |
| Standard Deviation (Population) | 4.6% | 5.5% |
Correlation Details
| Uruguayan Percentile | Sample Size | Disability |
[ 0.0% - 0.5% ] 0.040% | 126,094,254 | 11.5% |
[ 0.0% - 0.5% ] 0.25% | 11,802,378 | 10.9% |
[ 0.0% - 0.5% ] 0.42% | 2,738,401 | 10.9% |
[ 0.5% - 1.0% ] 0.61% | 1,673,075 | 11.2% |
[ 0.5% - 1.0% ] 0.80% | 874,768 | 11.1% |
[ 0.5% - 1.0% ] 0.94% | 519,332 | 8.8% |
[ 1.0% - 1.5% ] 1.13% | 223,890 | 12.6% |
[ 1.0% - 1.5% ] 1.29% | 257,352 | 10.5% |
[ 1.0% - 1.5% ] 1.48% | 237,582 | 10.5% |
[ 1.5% - 2.0% ] 1.67% | 133,798 | 14.0% |
[ 1.5% - 2.0% ] 1.85% | 71,071 | 11.4% |
[ 2.0% - 2.5% ] 2.02% | 52,551 | 10.7% |
[ 2.0% - 2.5% ] 2.23% | 69,004 | 11.4% |
[ 2.0% - 2.5% ] 2.50% | 9,969 | 12.2% |
[ 2.5% - 3.0% ] 2.69% | 1,747 | 19.6% |
[ 2.5% - 3.0% ] 2.83% | 1,659 | 15.3% |
[ 2.5% - 3.0% ] 3.00% | 1,067 | 9.9% |
[ 3.0% - 3.5% ] 3.28% | 1,250 | 14.5% |
[ 3.0% - 3.5% ] 3.36% | 506 | 14.8% |
[ 3.5% - 4.0% ] 3.61% | 887 | 10.4% |
[ 4.0% - 4.5% ] 4.11% | 7,857 | 15.1% |
[ 4.0% - 4.5% ] 4.46% | 830 | 34.0% |
[ 4.5% - 5.0% ] 4.79% | 313 | 20.8% |
[ 5.5% - 6.0% ] 5.75% | 2,367 | 15.3% |
[ 6.5% - 7.0% ] 6.63% | 4,553 | 8.6% |
[ 6.5% - 7.0% ] 6.79% | 324 | 24.4% |
[ 7.5% - 8.0% ] 7.69% | 611 | 21.6% |
[ 9.5% - 10.0% ] 9.89% | 3,114 | 23.3% |
[ 11.0% - 11.5% ] 11.20% | 250 | 14.4% |
[ 23.5% - 24.0% ] 23.56% | 191 | 17.3% |