Zip Codes with the Highest Percentage of Population Employed in Legal Services & Support in Phoenix, AZ
RELATED REPORTS & OPTIONS
Legal Services & Support
Phoenix
Compare Zip Codes
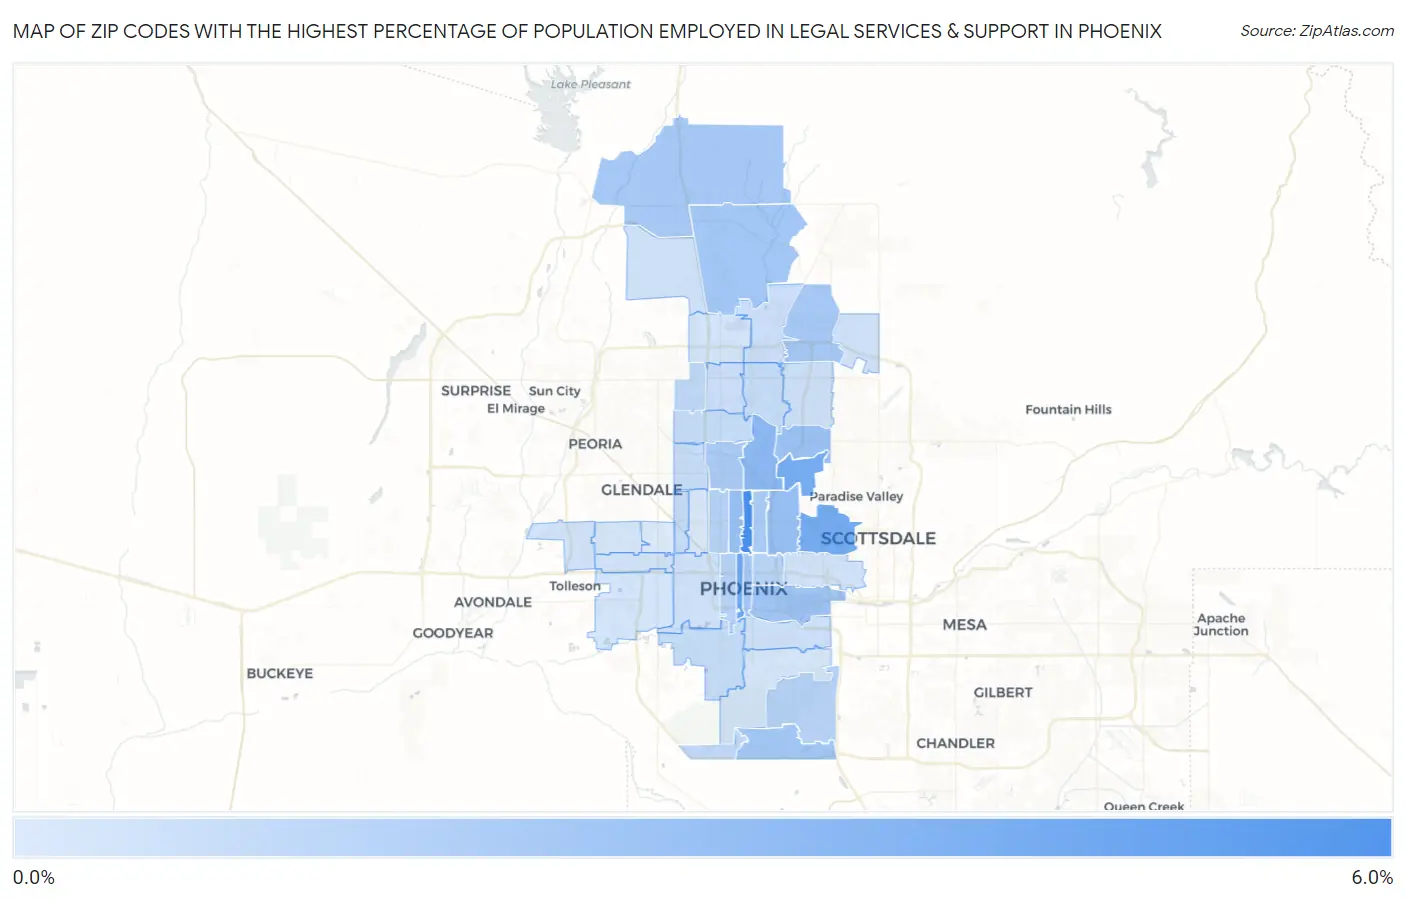
Map of Zip Codes with the Highest Percentage of Population Employed in Legal Services & Support in Phoenix
0.080%
6.0%
Zip Codes with the Highest Percentage of Population Employed in Legal Services & Support in Phoenix, AZ
| Zip Code | % Employed | vs State | vs National | |
| 1. | 85012 | 6.0% | 0.99%(+5.01)#2 | 1.2%(+4.81)#480 |
| 2. | 85003 | 4.4% | 0.99%(+3.43)#5 | 1.2%(+3.23)#931 |
| 3. | 85018 | 4.1% | 0.99%(+3.12)#7 | 1.2%(+2.92)#1,075 |
| 4. | 85020 | 3.2% | 0.99%(+2.20)#12 | 1.2%(+2.00)#1,664 |
| 5. | 85013 | 2.8% | 0.99%(+1.82)#17 | 1.2%(+1.62)#2,080 |
| 6. | 85016 | 2.7% | 0.99%(+1.74)#18 | 1.2%(+1.54)#2,171 |
| 7. | 85028 | 2.6% | 0.99%(+1.58)#21 | 1.2%(+1.38)#2,418 |
| 8. | 85034 | 2.4% | 0.99%(+1.37)#24 | 1.2%(+1.18)#2,734 |
| 9. | 85048 | 2.3% | 0.99%(+1.34)#25 | 1.2%(+1.15)#2,792 |
| 10. | 85004 | 2.3% | 0.99%(+1.34)#26 | 1.2%(+1.14)#2,794 |
| 11. | 85085 | 2.3% | 0.99%(+1.34)#27 | 1.2%(+1.14)#2,799 |
| 12. | 85086 | 2.2% | 0.99%(+1.24)#31 | 1.2%(+1.04)#2,978 |
| 13. | 85050 | 2.2% | 0.99%(+1.22)#32 | 1.2%(+1.02)#3,035 |
| 14. | 85021 | 2.1% | 0.99%(+1.10)#36 | 1.2%(+0.902)#3,256 |
| 15. | 85014 | 2.0% | 0.99%(+1.06)#37 | 1.2%(+0.859)#3,359 |
| 16. | 85015 | 1.6% | 0.99%(+0.640)#55 | 1.2%(+0.443)#4,584 |
| 17. | 85007 | 1.6% | 0.99%(+0.601)#59 | 1.2%(+0.403)#4,723 |
| 18. | 85044 | 1.5% | 0.99%(+0.475)#63 | 1.2%(+0.277)#5,208 |
| 19. | 85006 | 1.4% | 0.99%(+0.410)#71 | 1.2%(+0.212)#5,499 |
| 20. | 85053 | 1.2% | 0.99%(+0.219)#83 | 1.2%(+0.021)#6,460 |
| 21. | 85045 | 1.2% | 0.99%(+0.200)#86 | 1.2%(+0.002)#6,606 |
| 22. | 85029 | 0.98% | 0.99%(-0.007)#107 | 1.2%(-0.205)#7,968 |
| 23. | 85019 | 0.96% | 0.99%(-0.022)#113 | 1.2%(-0.220)#8,095 |
| 24. | 85041 | 0.94% | 0.99%(-0.047)#114 | 1.2%(-0.244)#8,283 |
| 25. | 85022 | 0.94% | 0.99%(-0.048)#115 | 1.2%(-0.246)#8,293 |
| 26. | 85051 | 0.85% | 0.99%(-0.133)#125 | 1.2%(-0.331)#8,992 |
| 27. | 85024 | 0.82% | 0.99%(-0.163)#134 | 1.2%(-0.361)#9,255 |
| 28. | 85023 | 0.78% | 0.99%(-0.202)#140 | 1.2%(-0.400)#9,605 |
| 29. | 85032 | 0.71% | 0.99%(-0.277)#151 | 1.2%(-0.475)#10,325 |
| 30. | 85040 | 0.67% | 0.99%(-0.314)#158 | 1.2%(-0.512)#10,712 |
| 31. | 85054 | 0.65% | 0.99%(-0.332)#161 | 1.2%(-0.530)#10,898 |
| 32. | 85009 | 0.63% | 0.99%(-0.354)#162 | 1.2%(-0.551)#11,102 |
| 33. | 85083 | 0.62% | 0.99%(-0.371)#164 | 1.2%(-0.568)#11,301 |
| 34. | 85008 | 0.53% | 0.99%(-0.461)#174 | 1.2%(-0.658)#12,307 |
| 35. | 85035 | 0.51% | 0.99%(-0.475)#180 | 1.2%(-0.673)#12,498 |
| 36. | 85037 | 0.49% | 0.99%(-0.501)#182 | 1.2%(-0.699)#12,820 |
| 37. | 85027 | 0.47% | 0.99%(-0.512)#186 | 1.2%(-0.710)#12,963 |
| 38. | 85043 | 0.42% | 0.99%(-0.566)#193 | 1.2%(-0.763)#13,596 |
| 39. | 85042 | 0.34% | 0.99%(-0.647)#208 | 1.2%(-0.845)#14,601 |
| 40. | 85033 | 0.33% | 0.99%(-0.660)#211 | 1.2%(-0.858)#14,755 |
| 41. | 85017 | 0.28% | 0.99%(-0.703)#214 | 1.2%(-0.901)#15,224 |
| 42. | 85031 | 0.080% | 0.99%(-0.906)#233 | 1.2%(-1.10)#17,268 |
1
Common Questions
What are the Top 10 Zip Codes with the Highest Percentage of Population Employed in Legal Services & Support in Phoenix, AZ?
Top 10 Zip Codes with the Highest Percentage of Population Employed in Legal Services & Support in Phoenix, AZ are:
What zip code has the Highest Percentage of Population Employed in Legal Services & Support in Phoenix, AZ?
85012 has the Highest Percentage of Population Employed in Legal Services & Support in Phoenix, AZ with 6.0%.
What is the Percentage of Population Employed in Legal Services & Support in Phoenix, AZ?
Percentage of Population Employed in Legal Services & Support in Phoenix is 1.2%.
What is the Percentage of Population Employed in Legal Services & Support in Arizona?
Percentage of Population Employed in Legal Services & Support in Arizona is 0.99%.
What is the Percentage of Population Employed in Legal Services & Support in the United States?
Percentage of Population Employed in Legal Services & Support in the United States is 1.2%.