Zip Codes with the Highest Percentage of Population Employed in Accommodation & Food Services in Phoenix, AZ
RELATED REPORTS & OPTIONS
Accommodation & Food Services
Phoenix
Compare Zip Codes
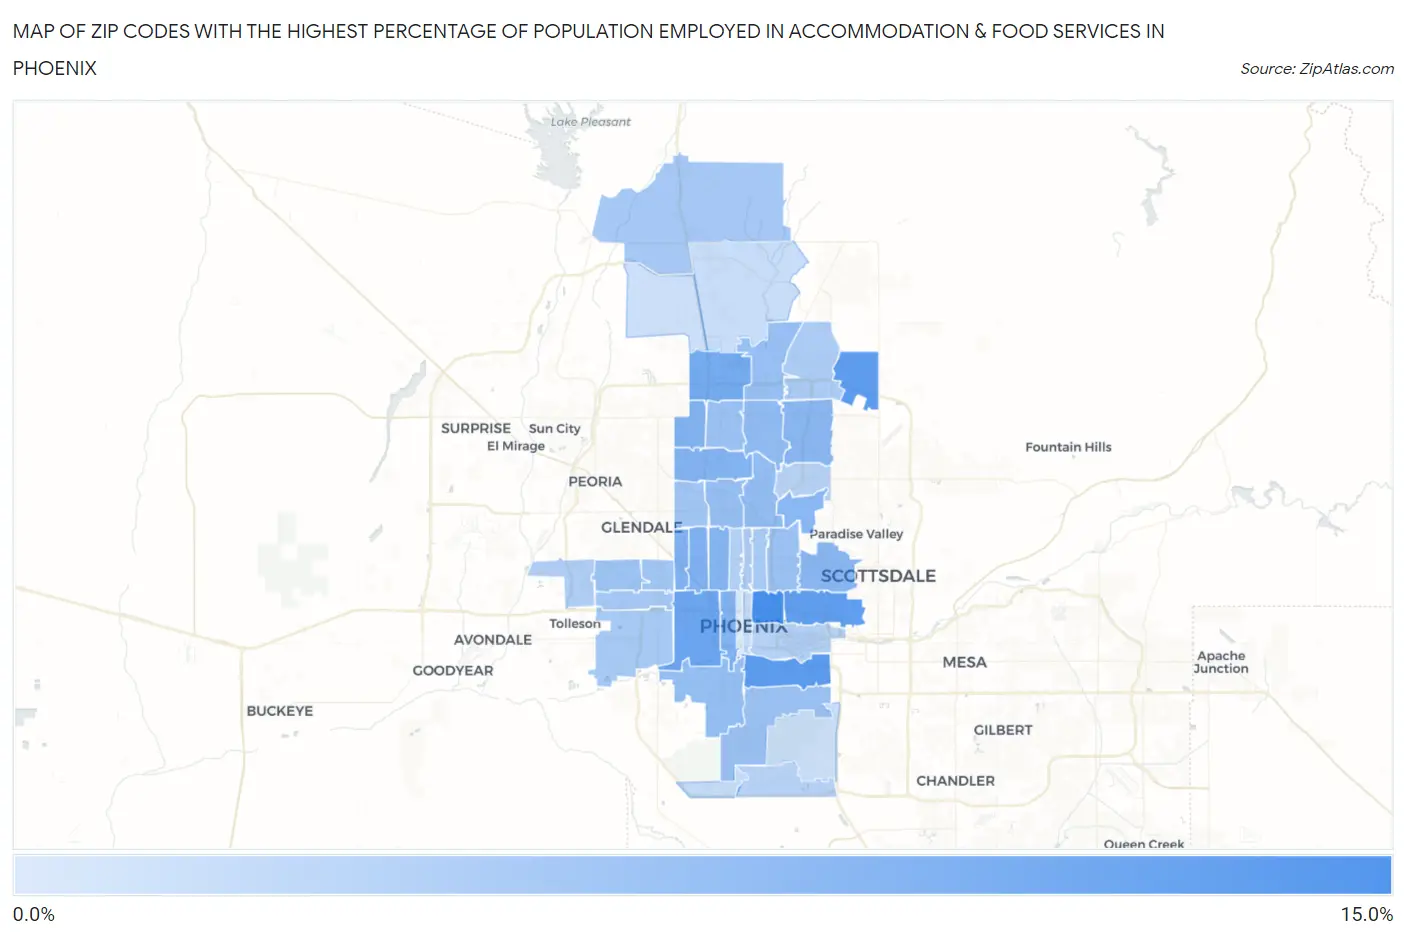
Map of Zip Codes with the Highest Percentage of Population Employed in Accommodation & Food Services in Phoenix
3.1%
14.0%
Zip Codes with the Highest Percentage of Population Employed in Accommodation & Food Services in Phoenix, AZ
| Zip Code | % Employed | vs State | vs National | |
| 1. | 85006 | 14.0% | 7.6%(+6.47)#51 | 6.9%(+7.14)#1,963 |
| 2. | 85040 | 12.4% | 7.6%(+4.86)#66 | 6.9%(+5.53)#2,631 |
| 3. | 85054 | 12.2% | 7.6%(+4.64)#71 | 6.9%(+5.31)#2,720 |
| 4. | 85008 | 12.1% | 7.6%(+4.55)#74 | 6.9%(+5.23)#2,771 |
| 5. | 85009 | 11.3% | 7.6%(+3.71)#85 | 6.9%(+4.38)#3,346 |
| 6. | 85027 | 10.5% | 7.6%(+2.95)#93 | 6.9%(+3.62)#3,993 |
| 7. | 85019 | 9.7% | 7.6%(+2.18)#109 | 6.9%(+2.85)#4,888 |
| 8. | 85017 | 9.7% | 7.6%(+2.15)#110 | 6.9%(+2.83)#4,915 |
| 9. | 85007 | 9.7% | 7.6%(+2.11)#111 | 6.9%(+2.78)#4,975 |
| 10. | 85029 | 9.5% | 7.6%(+1.98)#113 | 6.9%(+2.65)#5,161 |
| 11. | 85053 | 9.5% | 7.6%(+1.94)#116 | 6.9%(+2.62)#5,217 |
| 12. | 85015 | 9.4% | 7.6%(+1.86)#119 | 6.9%(+2.53)#5,333 |
| 13. | 85032 | 9.0% | 7.6%(+1.42)#132 | 6.9%(+2.10)#5,998 |
| 14. | 85018 | 9.0% | 7.6%(+1.42)#133 | 6.9%(+2.09)#6,008 |
| 15. | 85022 | 8.5% | 7.6%(+0.954)#143 | 6.9%(+1.63)#6,811 |
| 16. | 85020 | 8.2% | 7.6%(+0.689)#153 | 6.9%(+1.36)#7,333 |
| 17. | 85041 | 8.2% | 7.6%(+0.640)#154 | 6.9%(+1.31)#7,423 |
| 18. | 85024 | 8.0% | 7.6%(+0.443)#157 | 6.9%(+1.12)#7,825 |
| 19. | 85021 | 7.9% | 7.6%(+0.363)#161 | 6.9%(+1.04)#7,991 |
| 20. | 85016 | 7.8% | 7.6%(+0.279)#166 | 6.9%(+0.952)#8,189 |
| 21. | 85023 | 7.8% | 7.6%(+0.270)#167 | 6.9%(+0.943)#8,205 |
| 22. | 85042 | 7.6% | 7.6%(+0.088)#169 | 6.9%(+0.762)#8,646 |
| 23. | 85033 | 7.4% | 7.6%(-0.126)#176 | 6.9%(+0.548)#9,176 |
| 24. | 85031 | 7.1% | 7.6%(-0.420)#186 | 6.9%(+0.254)#9,970 |
| 25. | 85051 | 7.1% | 7.6%(-0.452)#187 | 6.9%(+0.221)#10,045 |
| 26. | 85035 | 7.0% | 7.6%(-0.573)#193 | 6.9%(+0.101)#10,367 |
| 27. | 85086 | 7.0% | 7.6%(-0.576)#194 | 6.9%(+0.097)#10,386 |
| 28. | 85043 | 6.7% | 7.6%(-0.823)#200 | 6.9%(-0.149)#11,105 |
| 29. | 85014 | 6.7% | 7.6%(-0.843)#202 | 6.9%(-0.170)#11,174 |
| 30. | 85012 | 6.5% | 7.6%(-1.06)#214 | 6.9%(-0.389)#11,876 |
| 31. | 85050 | 6.5% | 7.6%(-1.08)#216 | 6.9%(-0.409)#11,937 |
| 32. | 85037 | 6.3% | 7.6%(-1.25)#221 | 6.9%(-0.575)#12,462 |
| 33. | 85034 | 5.8% | 7.6%(-1.77)#249 | 6.9%(-1.10)#14,131 |
| 34. | 85013 | 5.8% | 7.6%(-1.78)#250 | 6.9%(-1.10)#14,143 |
| 35. | 85028 | 5.7% | 7.6%(-1.83)#253 | 6.9%(-1.15)#14,282 |
| 36. | 85048 | 5.6% | 7.6%(-1.98)#263 | 6.9%(-1.30)#14,778 |
| 37. | 85004 | 4.8% | 7.6%(-2.75)#291 | 6.9%(-2.08)#17,484 |
| 38. | 85045 | 4.7% | 7.6%(-2.88)#295 | 6.9%(-2.21)#17,918 |
| 39. | 85085 | 4.5% | 7.6%(-3.08)#298 | 6.9%(-2.40)#18,578 |
| 40. | 85083 | 4.2% | 7.6%(-3.32)#304 | 6.9%(-2.64)#19,390 |
| 41. | 85044 | 4.1% | 7.6%(-3.44)#310 | 6.9%(-2.77)#19,775 |
| 42. | 85003 | 3.1% | 7.6%(-4.49)#337 | 6.9%(-3.82)#23,049 |
1
Common Questions
What are the Top 10 Zip Codes with the Highest Percentage of Population Employed in Accommodation & Food Services in Phoenix, AZ?
Top 10 Zip Codes with the Highest Percentage of Population Employed in Accommodation & Food Services in Phoenix, AZ are:
What zip code has the Highest Percentage of Population Employed in Accommodation & Food Services in Phoenix, AZ?
85006 has the Highest Percentage of Population Employed in Accommodation & Food Services in Phoenix, AZ with 14.0%.
What is the Percentage of Population Employed in Accommodation & Food Services in Phoenix, AZ?
Percentage of Population Employed in Accommodation & Food Services in Phoenix is 7.9%.
What is the Percentage of Population Employed in Accommodation & Food Services in Arizona?
Percentage of Population Employed in Accommodation & Food Services in Arizona is 7.6%.
What is the Percentage of Population Employed in Accommodation & Food Services in the United States?
Percentage of Population Employed in Accommodation & Food Services in the United States is 6.9%.