Zip Codes with the Lowest Poverty Level Among Children Under the Age of 5 in Phoenix, AZ

RELATED REPORTS & OPTIONS

Lowest Poverty | Child 0-5
Population
Families and Households
Female Fertility
Female Fertility (Unmarried)
Race (Community Size)
Race (Percentage)
Ancestry (Community Size)
AfghanAfricanAlaska NativeAlaskan AthabascanAlbanianAmericanApacheArabArgentineanArmenianAssyrian / Chaldean / SyriacAustralianAustrianBahamianBangladeshiBarbadianBasqueBelgianBelizeanBhutaneseBlackfeetBolivianBrazilianBritishBritish West IndianBulgarianBurmeseCajunCanadianCape VerdeanCarpatho RusynCelticCentral AmericanCentral American IndianCherokeeCheyenneChickasawChileanChippewaChoctawColombianColvilleComancheCosta RicanCreeCreekCroatianCubanCypriotCzechCzechoslovakianDanishDelawareDominicanDutchEastern EuropeanEcuadorianEgyptianEnglishEstonianEthiopianEuropeanFijianFilipinoFinnishFrenchFrench American IndianFrench CanadianGermanGerman RussianGhanaianGreekGuamanian / ChamorroGuatemalanGuyaneseHaitianHonduranHopiHungarianIcelanderIndian (Asian)IndonesianInupiatIranianIraqiIrishIroquoisIsraeliItalianJamaicanJapaneseJordanianKenyanKiowaKoreanLaotianLatvianLebaneseLiberianLithuanianLuxembourgerMacedonianMalaysianMalteseMexicanMexican American IndianMongolianMoroccanNative HawaiianNavajoNew ZealanderNicaraguanNigerianNorthern EuropeanNorwegianOsagePaiutePakistaniPalestinianPanamanianParaguayanPennsylvania GermanPeruvianPimaPolishPortuguesePotawatomiPuebloPuerto RicanPuget Sound SalishRomanianRussianSalvadoranSamoanScandinavianScotch-IrishScottishSeminoleSenegaleseSerbianShoshoneSierra LeoneanSiouxSlavicSlovakSloveneSomaliSouth AfricanSouth AmericanSouth American IndianSoviet UnionSpaniardSpanishSpanish AmericanSpanish American IndianSri LankanSubsaharan AfricanSudaneseSwedishSwissSyrianThaiTlingit-HaidaTohono O'OdhamTonganTrinidadian and TobagonianTurkishUgandanUkrainianUruguayanUteVenezuelanVietnameseWelshWest IndianYakamaYaquiYugoslavianYumanZimbabwean
Ancestry (Percentage)
AfghanAfricanAlaska NativeAlaskan AthabascanAlbanianAmericanApacheArabArgentineanArmenianAssyrian / Chaldean / SyriacAustralianAustrianBahamianBangladeshiBarbadianBasqueBelgianBelizeanBhutaneseBlackfeetBolivianBrazilianBritishBritish West IndianBulgarianBurmeseCajunCanadianCape VerdeanCarpatho RusynCelticCentral AmericanCentral American IndianCherokeeCheyenneChickasawChileanChippewaChoctawColombianColvilleComancheCosta RicanCreeCreekCroatianCubanCypriotCzechCzechoslovakianDanishDelawareDominicanDutchEastern EuropeanEcuadorianEgyptianEnglishEstonianEthiopianEuropeanFijianFilipinoFinnishFrenchFrench American IndianFrench CanadianGermanGerman RussianGhanaianGreekGuamanian / ChamorroGuatemalanGuyaneseHaitianHonduranHopiHungarianIcelanderIndian (Asian)IndonesianInupiatIranianIraqiIrishIroquoisIsraeliItalianJamaicanJapaneseJordanianKenyanKiowaKoreanLaotianLatvianLebaneseLiberianLithuanianLuxembourgerMacedonianMalaysianMalteseMexicanMexican American IndianMongolianMoroccanNative HawaiianNavajoNew ZealanderNicaraguanNigerianNorthern EuropeanNorwegianOsagePaiutePakistaniPalestinianPanamanianParaguayanPennsylvania GermanPeruvianPimaPolishPortuguesePotawatomiPuebloPuerto RicanPuget Sound SalishRomanianRussianSalvadoranSamoanScandinavianScotch-IrishScottishSeminoleSenegaleseSerbianShoshoneSierra LeoneanSiouxSlavicSlovakSloveneSomaliSouth AfricanSouth AmericanSouth American IndianSoviet UnionSpaniardSpanishSpanish AmericanSpanish American IndianSri LankanSubsaharan AfricanSudaneseSwedishSwissSyrianThaiTlingit-HaidaTohono O'OdhamTonganTrinidadian and TobagonianTurkishUgandanUkrainianUruguayanUteVenezuelanVietnameseWelshWest IndianYakamaYaquiYugoslavianYumanZimbabwean
Immigrant Origin (Total)
AfghanistanAfricaAlbaniaArgentinaArmeniaAsiaAustraliaAustriaBahamasBangladeshBarbadosBelarusBelgiumBelizeBoliviaBosnia and HerzegovinaBrazilBulgariaBurma / MyanmarCambodiaCameroonCanadaCaribbeanCentral AmericaChileChinaColombiaCongoCosta RicaCroatiaCubaCzechoslovakiaDenmarkDominicaDominican RepublicEastern AfricaEastern AsiaEastern EuropeEcuadorEgyptEl SalvadorEnglandEritreaEthiopiaEuropeFranceGermanyGhanaGreeceGuatemalaGuyanaHaitiHondurasHong KongHungaryIndiaIndonesiaIranIraqIrelandIsraelItalyJamaicaJapanJordanKazakhstanKenyaKoreaKuwaitLaosLatin AmericaLebanonLiberiaLithuaniaMalaysiaMexicoMicronesiaMiddle AfricaMoldovaMoroccoNepalNetherlandsNicaraguaNigeriaNorthern AfricaNorthern EuropeNorwayOceaniaPakistanPanamaPeruPhilippinesPolandPortugalRomaniaRussiaSaudi ArabiaScotlandSerbiaSierra LeoneSingaporeSomaliaSouth AfricaSouth AmericaSouth Central AsiaSouth Eastern AsiaSouthern EuropeSpainSri LankaSudanSwedenSwitzerlandSyriaTaiwanThailandTrinidad and TobagoTurkeyUgandaUkraineUruguayUzbekistanVenezuelaVietnamWestern AfricaWestern AsiaWestern EuropeZaireZimbabwe
Immigrant Origin (Percentage)
AfghanistanAfricaAlbaniaArgentinaArmeniaAsiaAustraliaAustriaBahamasBangladeshBarbadosBelarusBelgiumBelizeBoliviaBosnia and HerzegovinaBrazilBulgariaBurma / MyanmarCambodiaCameroonCanadaCaribbeanCentral AmericaChileChinaColombiaCongoCosta RicaCroatiaCubaCzechoslovakiaDenmarkDominicaDominican RepublicEastern AfricaEastern AsiaEastern EuropeEcuadorEgyptEl SalvadorEnglandEritreaEthiopiaEuropeFranceGermanyGhanaGreeceGuatemalaGuyanaHaitiHondurasHong KongHungaryIndiaIndonesiaIranIraqIrelandIsraelItalyJamaicaJapanJordanKazakhstanKenyaKoreaKuwaitLaosLatin AmericaLebanonLiberiaLithuaniaMalaysiaMexicoMicronesiaMiddle AfricaMoldovaMoroccoNepalNetherlandsNicaraguaNigeriaNorthern AfricaNorthern EuropeNorwayOceaniaPakistanPanamaPeruPhilippinesPolandPortugalRomaniaRussiaSaudi ArabiaScotlandSerbiaSierra LeoneSingaporeSomaliaSouth AfricaSouth AmericaSouth Central AsiaSouth Eastern AsiaSouthern EuropeSpainSri LankaSudanSwedenSwitzerlandSyriaTaiwanThailandTrinidad and TobagoTurkeyUgandaUkraineUruguayUzbekistanVenezuelaVietnamWestern AfricaWestern AsiaWestern EuropeZaireZimbabwe
Income
Income (Families)
Income (Households)
Poverty
Poverty (Families)
Unemployment
Employment Occupations
Employment Industries
Employer Class
Commute Time
Commute Means
School Enrollment
Education by Degree Field
Occupancy
Finances
Physical Characteristics
Phoenix
Compare Zip Codes
Comparison Subject

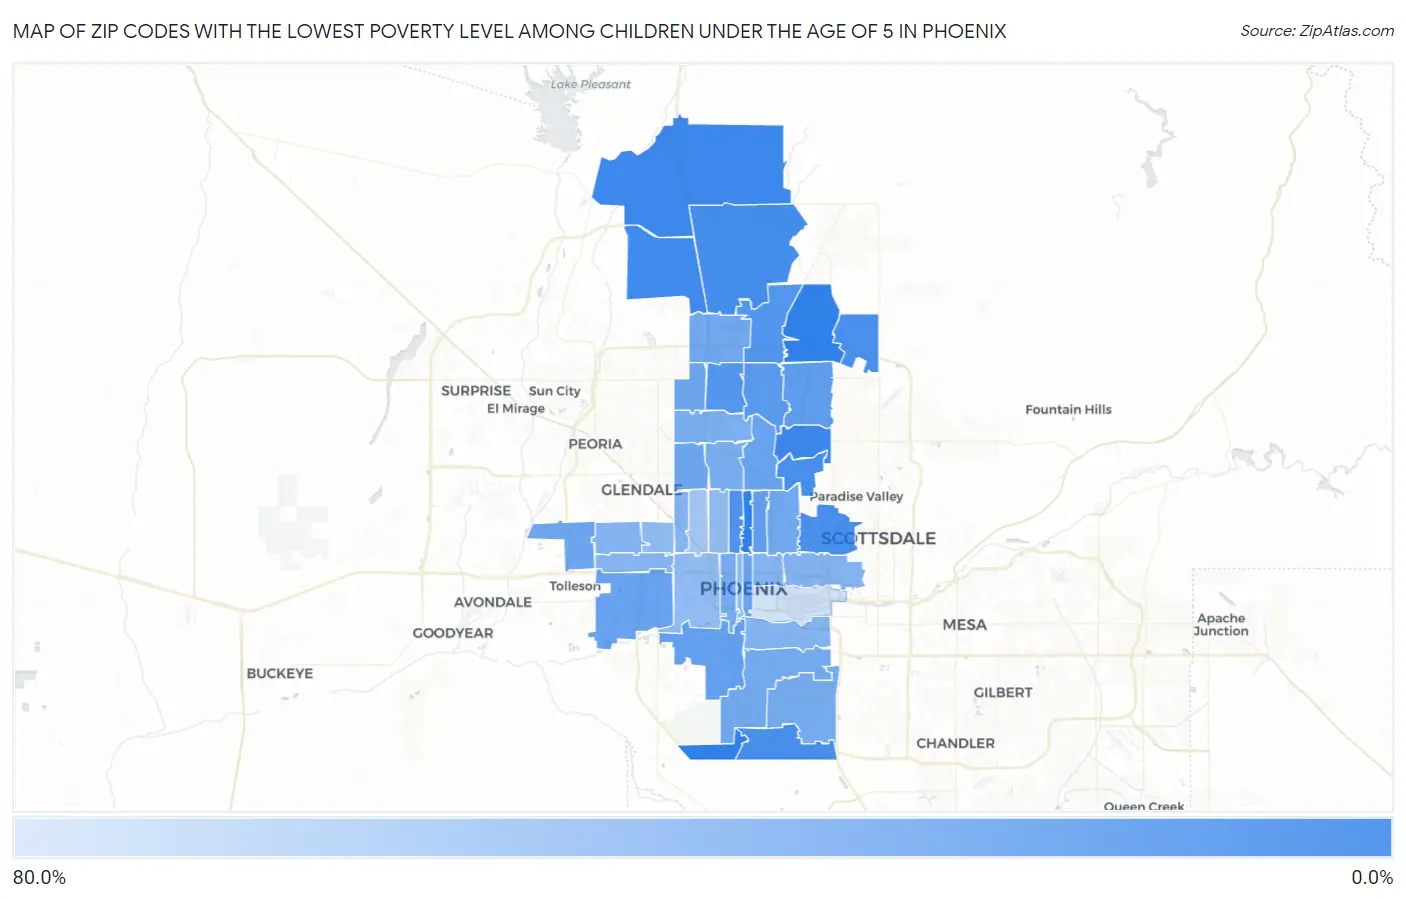
Map of Zip Codes with the Lowest Poverty Level Among Children Under the Age of 5 in Phoenix

80.0%
0.0%
Zip Codes with the Lowest Poverty Level Among Children Under the Age of 5 in Phoenix Map

Zip Codes with the Lowest Poverty Level Among Children Under the Age of 5 in Phoenix, AZ

Zip Code Child Poverty vs State vs National
1.850280.65%19.3%(-18.7)#218.1%(-17.4)#111
2.850860.95%19.3%(-18.4)#418.1%(-17.1)#254
3.850832.7%19.3%(-16.6)#1318.1%(-15.4)#1,270
4.850853.7%19.3%(-15.6)#2018.1%(-14.3)#1,984
5.850484.6%19.3%(-14.7)#2918.1%(-13.5)#2,625
6.850185.4%19.3%(-13.9)#3818.1%(-12.6)#3,189
7.850545.8%19.3%(-13.5)#4118.1%(-12.3)#3,439
8.850137.7%19.3%(-11.6)#5618.1%(-10.4)#4,709
9.850239.2%19.3%(-10.1)#7118.1%(-8.90)#5,726
10.850249.8%19.3%(-9.49)#7418.1%(-8.26)#6,141
11.8502212.1%19.3%(-7.21)#9218.1%(-5.97)#7,521
12.8501414.8%19.3%(-4.48)#11718.1%(-3.24)#9,110
13.8503215.0%19.3%(-4.34)#11918.1%(-3.10)#9,184
14.8504116.4%19.3%(-2.90)#13018.1%(-1.66)#9,981
15.8504318.0%19.3%(-1.35)#13918.1%(-0.109)#10,693
16.8500419.6%19.3%(+0.337)#14418.1%(+1.57)#11,463
17.8502019.7%19.3%(+0.411)#14618.1%(+1.65)#11,496
18.8505120.8%19.3%(+1.47)#14918.1%(+2.71)#11,980
19.8503720.9%19.3%(+1.61)#15018.1%(+2.85)#12,038
20.8505321.5%19.3%(+2.21)#15418.1%(+3.44)#12,293
21.8502723.2%19.3%(+3.86)#16418.1%(+5.10)#12,969
22.8501623.3%19.3%(+3.99)#16518.1%(+5.22)#13,020
23.8504224.5%19.3%(+5.18)#17418.1%(+6.42)#13,490
24.8500725.5%19.3%(+6.18)#17918.1%(+7.42)#13,845
25.8504425.5%19.3%(+6.22)#18018.1%(+7.46)#13,859
26.8502126.5%19.3%(+7.23)#18618.1%(+8.47)#14,204
27.8502927.2%19.3%(+7.93)#18918.1%(+9.17)#14,434
28.8504030.6%19.3%(+11.3)#20818.1%(+12.5)#15,473
29.8500831.1%19.3%(+11.8)#20918.1%(+13.0)#15,612
30.8503331.5%19.3%(+12.2)#21218.1%(+13.4)#15,711
31.8501932.4%19.3%(+13.1)#21518.1%(+14.3)#15,927
32.8500632.5%19.3%(+13.2)#21618.1%(+14.5)#15,956
33.8503533.0%19.3%(+13.7)#21818.1%(+15.0)#16,092
34.8503137.3%19.3%(+18.0)#23418.1%(+19.2)#17,135
35.8501537.7%19.3%(+18.4)#23518.1%(+19.7)#17,217
36.8500938.2%19.3%(+18.9)#23818.1%(+20.2)#17,310
37.8500338.7%19.3%(+19.4)#24118.1%(+20.7)#17,412
38.8501748.7%19.3%(+29.4)#25718.1%(+30.7)#18,945
39.8503474.5%19.3%(+55.2)#28918.1%(+56.5)#20,687

Common Questions

What are the Top 10 Zip Codes with the Lowest Poverty Level Among Children Under the Age of 5 in Phoenix, AZ?
Top 10 Zip Codes with the Lowest Poverty Level Among Children Under the Age of 5 in Phoenix, AZ are:
#1
0.0%
#2
0.0%
#3
0.0%
#4
0.65%
#5
0.95%
#6
2.7%
#7
3.7%
#8
4.6%
#9
5.4%
#10
5.8%
What zip code has the Lowest Poverty Level Among Children Under the Age of 5 in Phoenix, AZ?
85028 has the Lowest Poverty Level Among Children Under the Age of 5 in Phoenix, AZ with 0.65%.
What is the Poverty Level Among Children Under the Age of 5 in Phoenix, AZ?
Poverty Level Among Children Under the Age of 5 in Phoenix is 21.0%.
What is the Poverty Level Among Children Under the Age of 5 in Arizona?
Poverty Level Among Children Under the Age of 5 in Arizona is 19.3%.
What is the Poverty Level Among Children Under the Age of 5 in the United States?
Poverty Level Among Children Under the Age of 5 in the United States is 18.1%.