Zip Codes with the Highest Percentage of Population Employed in Computer & Mathematics in Phoenix, AZ

RELATED REPORTS & OPTIONS

Computer & Mathematics
Population
Families and Households
Female Fertility
Female Fertility (Unmarried)
Race (Community Size)
Race (Percentage)
Ancestry (Community Size)
AfghanAfricanAlaska NativeAlaskan AthabascanAlbanianAmericanApacheArabArgentineanArmenianAssyrian / Chaldean / SyriacAustralianAustrianBahamianBangladeshiBarbadianBasqueBelgianBelizeanBhutaneseBlackfeetBolivianBrazilianBritishBritish West IndianBulgarianBurmeseCajunCanadianCape VerdeanCarpatho RusynCelticCentral AmericanCentral American IndianCherokeeCheyenneChickasawChileanChippewaChoctawColombianColvilleComancheCosta RicanCreeCreekCroatianCubanCypriotCzechCzechoslovakianDanishDelawareDominicanDutchEastern EuropeanEcuadorianEgyptianEnglishEstonianEthiopianEuropeanFijianFilipinoFinnishFrenchFrench American IndianFrench CanadianGermanGerman RussianGhanaianGreekGuamanian / ChamorroGuatemalanGuyaneseHaitianHonduranHopiHungarianIcelanderIndian (Asian)IndonesianInupiatIranianIraqiIrishIroquoisIsraeliItalianJamaicanJapaneseJordanianKenyanKiowaKoreanLaotianLatvianLebaneseLiberianLithuanianLuxembourgerMacedonianMalaysianMalteseMexicanMexican American IndianMongolianMoroccanNative HawaiianNavajoNew ZealanderNicaraguanNigerianNorthern EuropeanNorwegianOsagePaiutePakistaniPalestinianPanamanianParaguayanPennsylvania GermanPeruvianPimaPolishPortuguesePotawatomiPuebloPuerto RicanPuget Sound SalishRomanianRussianSalvadoranSamoanScandinavianScotch-IrishScottishSeminoleSenegaleseSerbianShoshoneSierra LeoneanSiouxSlavicSlovakSloveneSomaliSouth AfricanSouth AmericanSouth American IndianSoviet UnionSpaniardSpanishSpanish AmericanSpanish American IndianSri LankanSubsaharan AfricanSudaneseSwedishSwissSyrianThaiTlingit-HaidaTohono O'OdhamTonganTrinidadian and TobagonianTurkishUgandanUkrainianUruguayanUteVenezuelanVietnameseWelshWest IndianYakamaYaquiYugoslavianYumanZimbabwean
Ancestry (Percentage)
AfghanAfricanAlaska NativeAlaskan AthabascanAlbanianAmericanApacheArabArgentineanArmenianAssyrian / Chaldean / SyriacAustralianAustrianBahamianBangladeshiBarbadianBasqueBelgianBelizeanBhutaneseBlackfeetBolivianBrazilianBritishBritish West IndianBulgarianBurmeseCajunCanadianCape VerdeanCarpatho RusynCelticCentral AmericanCentral American IndianCherokeeCheyenneChickasawChileanChippewaChoctawColombianColvilleComancheCosta RicanCreeCreekCroatianCubanCypriotCzechCzechoslovakianDanishDelawareDominicanDutchEastern EuropeanEcuadorianEgyptianEnglishEstonianEthiopianEuropeanFijianFilipinoFinnishFrenchFrench American IndianFrench CanadianGermanGerman RussianGhanaianGreekGuamanian / ChamorroGuatemalanGuyaneseHaitianHonduranHopiHungarianIcelanderIndian (Asian)IndonesianInupiatIranianIraqiIrishIroquoisIsraeliItalianJamaicanJapaneseJordanianKenyanKiowaKoreanLaotianLatvianLebaneseLiberianLithuanianLuxembourgerMacedonianMalaysianMalteseMexicanMexican American IndianMongolianMoroccanNative HawaiianNavajoNew ZealanderNicaraguanNigerianNorthern EuropeanNorwegianOsagePaiutePakistaniPalestinianPanamanianParaguayanPennsylvania GermanPeruvianPimaPolishPortuguesePotawatomiPuebloPuerto RicanPuget Sound SalishRomanianRussianSalvadoranSamoanScandinavianScotch-IrishScottishSeminoleSenegaleseSerbianShoshoneSierra LeoneanSiouxSlavicSlovakSloveneSomaliSouth AfricanSouth AmericanSouth American IndianSoviet UnionSpaniardSpanishSpanish AmericanSpanish American IndianSri LankanSubsaharan AfricanSudaneseSwedishSwissSyrianThaiTlingit-HaidaTohono O'OdhamTonganTrinidadian and TobagonianTurkishUgandanUkrainianUruguayanUteVenezuelanVietnameseWelshWest IndianYakamaYaquiYugoslavianYumanZimbabwean
Immigrant Origin (Total)
AfghanistanAfricaAlbaniaArgentinaArmeniaAsiaAustraliaAustriaBahamasBangladeshBarbadosBelarusBelgiumBelizeBoliviaBosnia and HerzegovinaBrazilBulgariaBurma / MyanmarCambodiaCameroonCanadaCaribbeanCentral AmericaChileChinaColombiaCongoCosta RicaCroatiaCubaCzechoslovakiaDenmarkDominicaDominican RepublicEastern AfricaEastern AsiaEastern EuropeEcuadorEgyptEl SalvadorEnglandEritreaEthiopiaEuropeFranceGermanyGhanaGreeceGuatemalaGuyanaHaitiHondurasHong KongHungaryIndiaIndonesiaIranIraqIrelandIsraelItalyJamaicaJapanJordanKazakhstanKenyaKoreaKuwaitLaosLatin AmericaLebanonLiberiaLithuaniaMalaysiaMexicoMicronesiaMiddle AfricaMoldovaMoroccoNepalNetherlandsNicaraguaNigeriaNorthern AfricaNorthern EuropeNorwayOceaniaPakistanPanamaPeruPhilippinesPolandPortugalRomaniaRussiaSaudi ArabiaScotlandSerbiaSierra LeoneSingaporeSomaliaSouth AfricaSouth AmericaSouth Central AsiaSouth Eastern AsiaSouthern EuropeSpainSri LankaSudanSwedenSwitzerlandSyriaTaiwanThailandTrinidad and TobagoTurkeyUgandaUkraineUruguayUzbekistanVenezuelaVietnamWestern AfricaWestern AsiaWestern EuropeZaireZimbabwe
Immigrant Origin (Percentage)
AfghanistanAfricaAlbaniaArgentinaArmeniaAsiaAustraliaAustriaBahamasBangladeshBarbadosBelarusBelgiumBelizeBoliviaBosnia and HerzegovinaBrazilBulgariaBurma / MyanmarCambodiaCameroonCanadaCaribbeanCentral AmericaChileChinaColombiaCongoCosta RicaCroatiaCubaCzechoslovakiaDenmarkDominicaDominican RepublicEastern AfricaEastern AsiaEastern EuropeEcuadorEgyptEl SalvadorEnglandEritreaEthiopiaEuropeFranceGermanyGhanaGreeceGuatemalaGuyanaHaitiHondurasHong KongHungaryIndiaIndonesiaIranIraqIrelandIsraelItalyJamaicaJapanJordanKazakhstanKenyaKoreaKuwaitLaosLatin AmericaLebanonLiberiaLithuaniaMalaysiaMexicoMicronesiaMiddle AfricaMoldovaMoroccoNepalNetherlandsNicaraguaNigeriaNorthern AfricaNorthern EuropeNorwayOceaniaPakistanPanamaPeruPhilippinesPolandPortugalRomaniaRussiaSaudi ArabiaScotlandSerbiaSierra LeoneSingaporeSomaliaSouth AfricaSouth AmericaSouth Central AsiaSouth Eastern AsiaSouthern EuropeSpainSri LankaSudanSwedenSwitzerlandSyriaTaiwanThailandTrinidad and TobagoTurkeyUgandaUkraineUruguayUzbekistanVenezuelaVietnamWestern AfricaWestern AsiaWestern EuropeZaireZimbabwe
Income
Income (Families)
Income (Households)
Poverty
Poverty (Families)
Unemployment
Employment Occupations
Employment Industries
Employer Class
Commute Time
Commute Means
School Enrollment
Education by Degree Field
Occupancy
Finances
Physical Characteristics
Phoenix
Compare Zip Codes
Comparison Subject

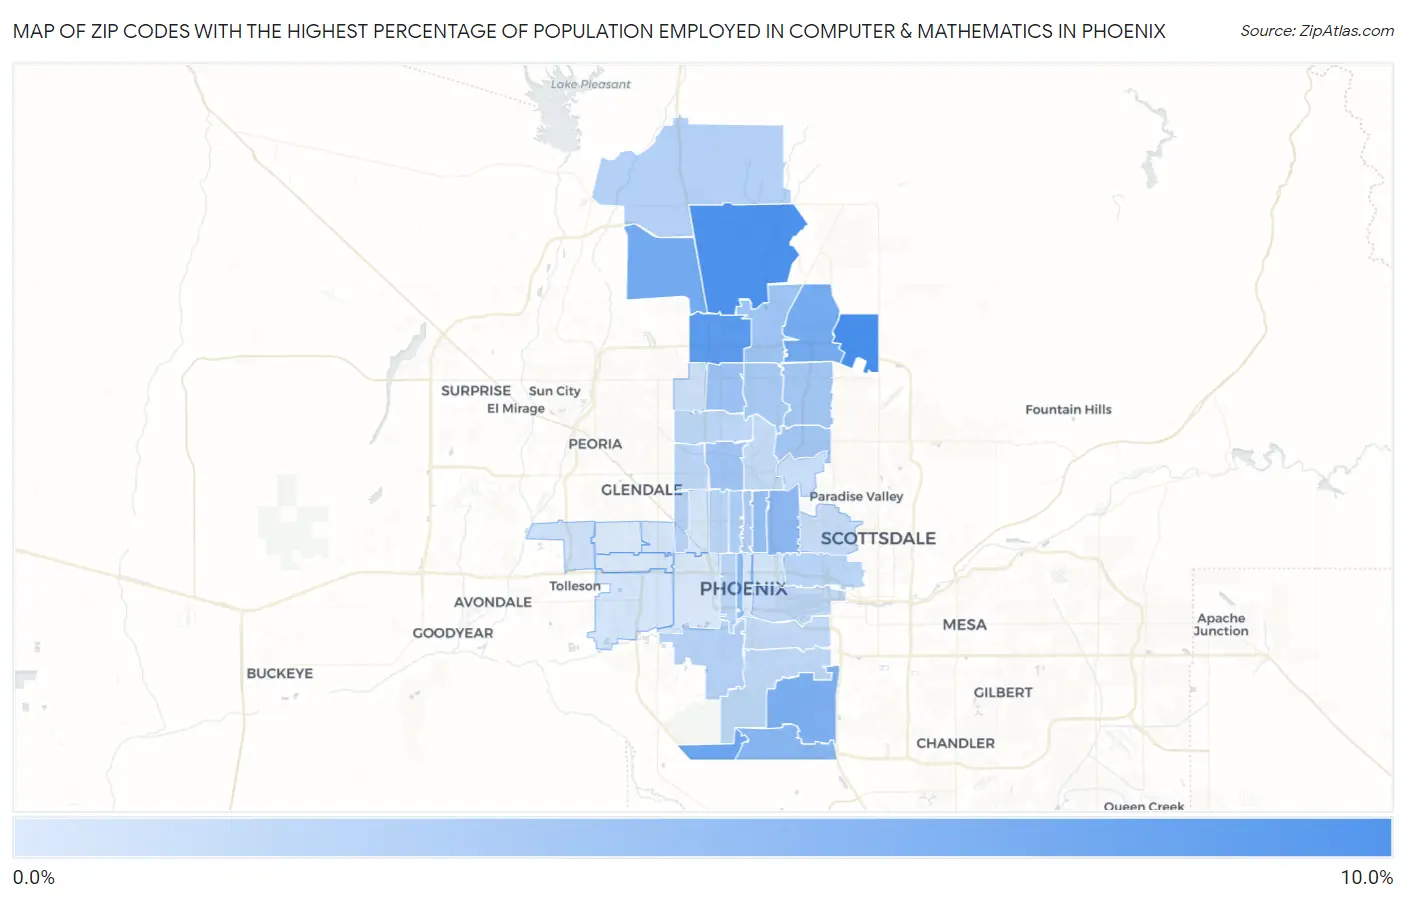
Map of Zip Codes with the Highest Percentage of Population Employed in Computer & Mathematics in Phoenix

0.0%
10.0%
Zip Codes with the Highest Percentage of Population Employed in Computer & Mathematics in Phoenix Map

Zip Codes with the Highest Percentage of Population Employed in Computer & Mathematics in Phoenix, AZ

Zip Code % Employed vs State vs National
1.850549.9%3.6%(+6.37)#23.5%(+6.41)#718
2.850859.6%3.6%(+6.09)#43.5%(+6.12)#764
3.850278.7%3.6%(+5.18)#73.5%(+5.21)#974
4.850457.6%3.6%(+4.02)#113.5%(+4.05)#1,356
5.850837.3%3.6%(+3.76)#123.5%(+3.79)#1,457
6.850507.1%3.6%(+3.53)#173.5%(+3.56)#1,581
7.850446.6%3.6%(+3.05)#233.5%(+3.08)#1,851
8.850486.0%3.6%(+2.49)#333.5%(+2.53)#2,271
9.850165.7%3.6%(+2.11)#403.5%(+2.14)#2,619
10.850035.4%3.6%(+1.87)#453.5%(+1.90)#2,862
11.850145.2%3.6%(+1.63)#473.5%(+1.66)#3,143
12.850234.8%3.6%(+1.22)#563.5%(+1.25)#3,680
13.850244.6%3.6%(+1.07)#623.5%(+1.10)#3,903
14.850214.4%3.6%(+0.883)#653.5%(+0.915)#4,201
15.850324.4%3.6%(+0.827)#673.5%(+0.859)#4,290
16.850284.3%3.6%(+0.740)#693.5%(+0.772)#4,438
17.850224.1%3.6%(+0.581)#753.5%(+0.613)#4,735
18.850123.8%3.6%(+0.221)#873.5%(+0.253)#5,538
19.850133.6%3.6%(+0.089)#933.5%(+0.121)#5,853
20.850863.5%3.6%(-0.100)#1013.5%(-0.068)#6,319
21.850193.3%3.6%(-0.249)#1093.5%(-0.217)#6,753
22.850413.2%3.6%(-0.338)#1143.5%(-0.306)#7,039
23.850073.1%3.6%(-0.493)#1203.5%(-0.461)#7,515
24.850153.0%3.6%(-0.584)#1303.5%(-0.552)#7,835
25.850083.0%3.6%(-0.590)#1313.5%(-0.558)#7,853
26.850292.9%3.6%(-0.615)#1323.5%(-0.583)#7,959
27.850512.9%3.6%(-0.679)#1373.5%(-0.647)#8,183
28.850422.7%3.6%(-0.818)#1413.5%(-0.786)#8,675
29.850342.6%3.6%(-1.000)#1493.5%(-0.968)#9,392
30.850402.6%3.6%(-1.00)#1503.5%(-0.969)#9,401
31.850202.4%3.6%(-1.11)#1553.5%(-1.08)#9,857
32.850182.2%3.6%(-1.35)#1673.5%(-1.32)#10,854
33.850531.9%3.6%(-1.61)#1863.5%(-1.58)#12,048
34.850371.8%3.6%(-1.78)#2003.5%(-1.75)#12,846
35.850061.5%3.6%(-2.02)#2153.5%(-1.99)#14,179
36.850431.5%3.6%(-2.05)#2173.5%(-2.01)#14,303
37.850311.4%3.6%(-2.11)#2183.5%(-2.08)#14,673
38.850041.4%3.6%(-2.11)#2193.5%(-2.08)#14,674
39.850171.4%3.6%(-2.13)#2213.5%(-2.10)#14,815
40.850351.3%3.6%(-2.23)#2283.5%(-2.20)#15,392
41.850091.2%3.6%(-2.33)#2363.5%(-2.29)#15,956
42.850331.0%3.6%(-2.53)#2493.5%(-2.50)#17,239

Common Questions

What are the Top 10 Zip Codes with the Highest Percentage of Population Employed in Computer & Mathematics in Phoenix, AZ?
Top 10 Zip Codes with the Highest Percentage of Population Employed in Computer & Mathematics in Phoenix, AZ are:
#1
9.9%
#2
9.6%
#3
8.7%
#4
7.6%
#5
7.3%
#6
7.1%
#7
6.6%
#8
6.0%
#9
5.7%
#10
5.4%
What zip code has the Highest Percentage of Population Employed in Computer & Mathematics in Phoenix, AZ?
85054 has the Highest Percentage of Population Employed in Computer & Mathematics in Phoenix, AZ with 9.9%.
What is the Percentage of Population Employed in Computer & Mathematics in Phoenix, AZ?
Percentage of Population Employed in Computer & Mathematics in Phoenix is 3.9%.
What is the Percentage of Population Employed in Computer & Mathematics in Arizona?
Percentage of Population Employed in Computer & Mathematics in Arizona is 3.6%.
What is the Percentage of Population Employed in Computer & Mathematics in the United States?
Percentage of Population Employed in Computer & Mathematics in the United States is 3.5%.