Zip Codes with the Highest Percentage of Population with a Degree in Visual and Performing Arts in Phoenix, AZ
RELATED REPORTS & OPTIONS
Visual and Performing Arts
Phoenix
Compare Zip Codes
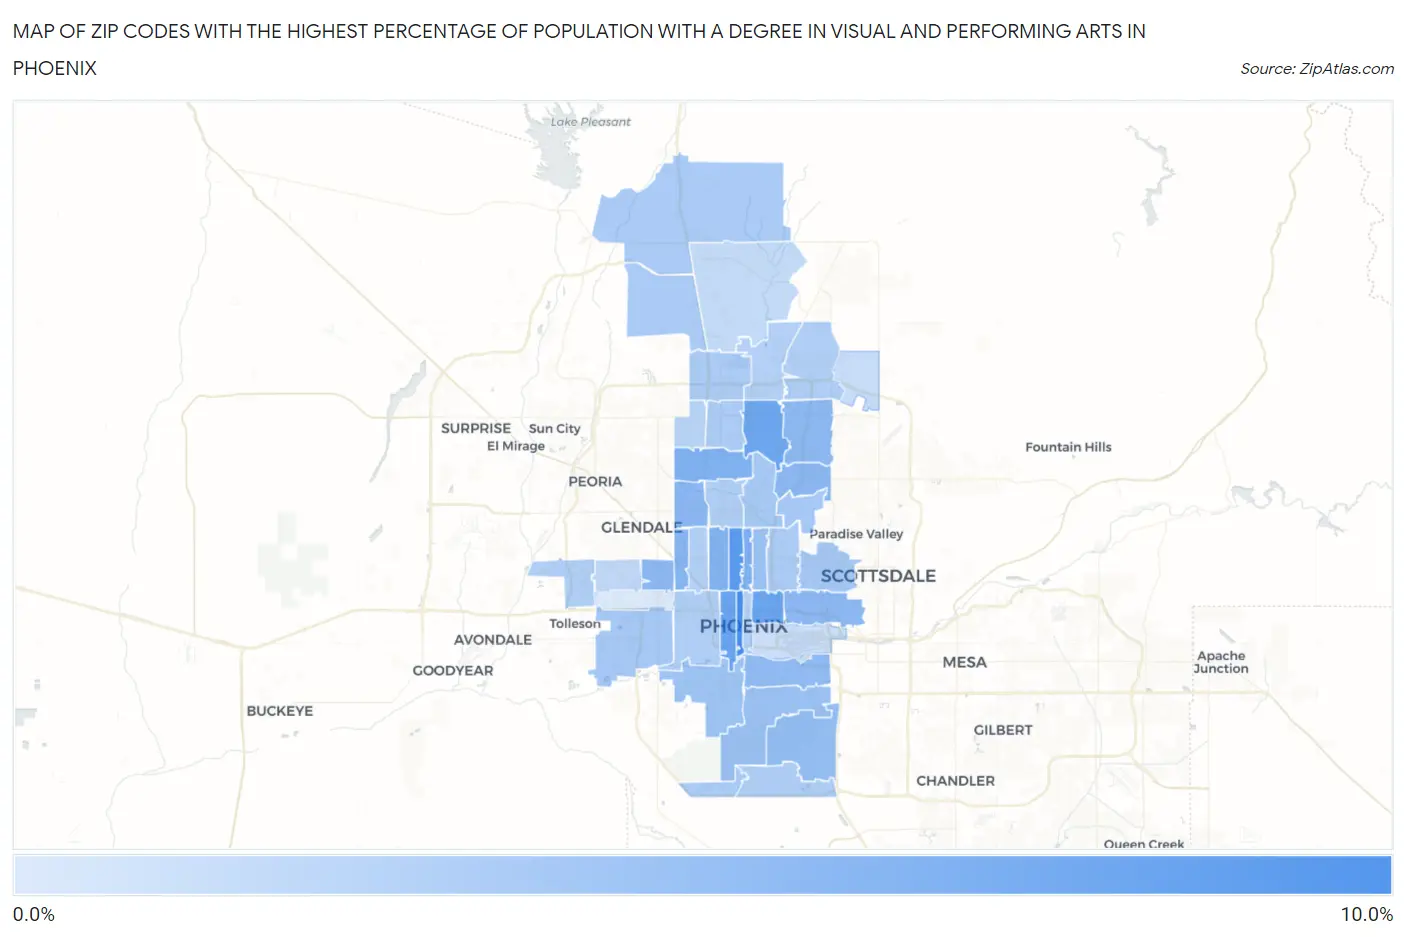
Map of Zip Codes with the Highest Percentage of Population with a Degree in Visual and Performing Arts in Phoenix
0.49%
9.0%
Zip Codes with the Highest Percentage of Population with a Degree in Visual and Performing Arts in Phoenix, AZ
| Zip Code | % Graduates | vs State | vs National | |
| 1. | 85003 | 9.0% | 3.6%(+5.47)#11 | 4.3%(+4.80)#2,243 |
| 2. | 85013 | 8.0% | 3.6%(+4.38)#19 | 4.3%(+3.71)#2,887 |
| 3. | 85007 | 7.1% | 3.6%(+3.50)#31 | 4.3%(+2.82)#3,586 |
| 4. | 85006 | 6.9% | 3.6%(+3.32)#33 | 4.3%(+2.64)#3,767 |
| 5. | 85022 | 6.7% | 3.6%(+3.14)#35 | 4.3%(+2.46)#3,968 |
| 6. | 85012 | 5.9% | 3.6%(+2.29)#52 | 4.3%(+1.61)#5,082 |
| 7. | 85029 | 5.7% | 3.6%(+2.15)#57 | 4.3%(+1.47)#5,296 |
| 8. | 85015 | 5.5% | 3.6%(+1.91)#63 | 4.3%(+1.23)#5,716 |
| 9. | 85019 | 5.2% | 3.6%(+1.65)#69 | 4.3%(+0.970)#6,202 |
| 10. | 85028 | 5.1% | 3.6%(+1.48)#70 | 4.3%(+0.802)#6,516 |
| 11. | 85031 | 5.0% | 3.6%(+1.46)#72 | 4.3%(+0.786)#6,544 |
| 12. | 85008 | 5.0% | 3.6%(+1.42)#74 | 4.3%(+0.742)#6,663 |
| 13. | 85051 | 5.0% | 3.6%(+1.39)#76 | 4.3%(+0.712)#6,724 |
| 14. | 85032 | 4.8% | 3.6%(+1.26)#80 | 4.3%(+0.583)#7,006 |
| 15. | 85040 | 4.8% | 3.6%(+1.22)#82 | 4.3%(+0.539)#7,097 |
| 16. | 85044 | 4.5% | 3.6%(+0.907)#94 | 4.3%(+0.230)#7,859 |
| 17. | 85042 | 4.2% | 3.6%(+0.631)#111 | 4.3%(-0.047)#8,607 |
| 18. | 85014 | 4.2% | 3.6%(+0.614)#113 | 4.3%(-0.064)#8,655 |
| 19. | 85041 | 4.0% | 3.6%(+0.411)#118 | 4.3%(-0.267)#9,305 |
| 20. | 85043 | 3.6% | 3.6%(+0.042)#127 | 4.3%(-0.636)#10,440 |
| 21. | 85018 | 3.5% | 3.6%(-0.063)#133 | 4.3%(-0.740)#10,839 |
| 22. | 85020 | 3.5% | 3.6%(-0.118)#135 | 4.3%(-0.796)#11,044 |
| 23. | 85086 | 3.3% | 3.6%(-0.230)#140 | 4.3%(-0.907)#11,437 |
| 24. | 85083 | 3.3% | 3.6%(-0.263)#142 | 4.3%(-0.940)#11,557 |
| 25. | 85023 | 3.2% | 3.6%(-0.360)#154 | 4.3%(-1.04)#11,930 |
| 26. | 85027 | 3.2% | 3.6%(-0.388)#158 | 4.3%(-1.07)#12,038 |
| 27. | 85045 | 3.2% | 3.6%(-0.418)#160 | 4.3%(-1.09)#12,133 |
| 28. | 85016 | 3.1% | 3.6%(-0.447)#161 | 4.3%(-1.12)#12,235 |
| 29. | 85048 | 3.0% | 3.6%(-0.572)#170 | 4.3%(-1.25)#12,719 |
| 30. | 85037 | 3.0% | 3.6%(-0.592)#172 | 4.3%(-1.27)#12,794 |
| 31. | 85009 | 3.0% | 3.6%(-0.625)#176 | 4.3%(-1.30)#12,920 |
| 32. | 85050 | 2.9% | 3.6%(-0.668)#177 | 4.3%(-1.35)#13,076 |
| 33. | 85021 | 2.9% | 3.6%(-0.702)#181 | 4.3%(-1.38)#13,205 |
| 34. | 85004 | 2.8% | 3.6%(-0.776)#186 | 4.3%(-1.45)#13,494 |
| 35. | 85017 | 2.8% | 3.6%(-0.795)#187 | 4.3%(-1.47)#13,568 |
| 36. | 85024 | 2.7% | 3.6%(-0.841)#189 | 4.3%(-1.52)#13,765 |
| 37. | 85053 | 2.4% | 3.6%(-1.15)#207 | 4.3%(-1.83)#14,895 |
| 38. | 85033 | 2.0% | 3.6%(-1.58)#223 | 4.3%(-2.26)#16,479 |
| 39. | 85085 | 1.9% | 3.6%(-1.68)#229 | 4.3%(-2.35)#16,799 |
| 40. | 85054 | 1.7% | 3.6%(-1.91)#242 | 4.3%(-2.59)#17,603 |
| 41. | 85034 | 1.6% | 3.6%(-2.01)#248 | 4.3%(-2.69)#17,969 |
| 42. | 85035 | 0.49% | 3.6%(-3.08)#278 | 4.3%(-3.76)#20,794 |
1
Common Questions
What are the Top 10 Zip Codes with the Highest Percentage of Population with a Degree in Visual and Performing Arts in Phoenix, AZ?
Top 10 Zip Codes with the Highest Percentage of Population with a Degree in Visual and Performing Arts in Phoenix, AZ are:
What zip code has the Highest Percentage of Population with a Degree in Visual and Performing Arts in Phoenix, AZ?
85003 has the Highest Percentage of Population with a Degree in Visual and Performing Arts in Phoenix, AZ with 9.0%.
What is the Percentage of Population with a Degree in Visual and Performing Arts in Phoenix, AZ?
Percentage of Population with a Degree in Visual and Performing Arts in Phoenix is 3.9%.
What is the Percentage of Population with a Degree in Visual and Performing Arts in Arizona?
Percentage of Population with a Degree in Visual and Performing Arts in Arizona is 3.6%.
What is the Percentage of Population with a Degree in Visual and Performing Arts in the United States?
Percentage of Population with a Degree in Visual and Performing Arts in the United States is 4.3%.