Zip Codes with the Highest Percentage of Population Employed in Architecture & Engineering in Phoenix, AZ
RELATED REPORTS & OPTIONS
Architecture & Engineering
Phoenix
Compare Zip Codes
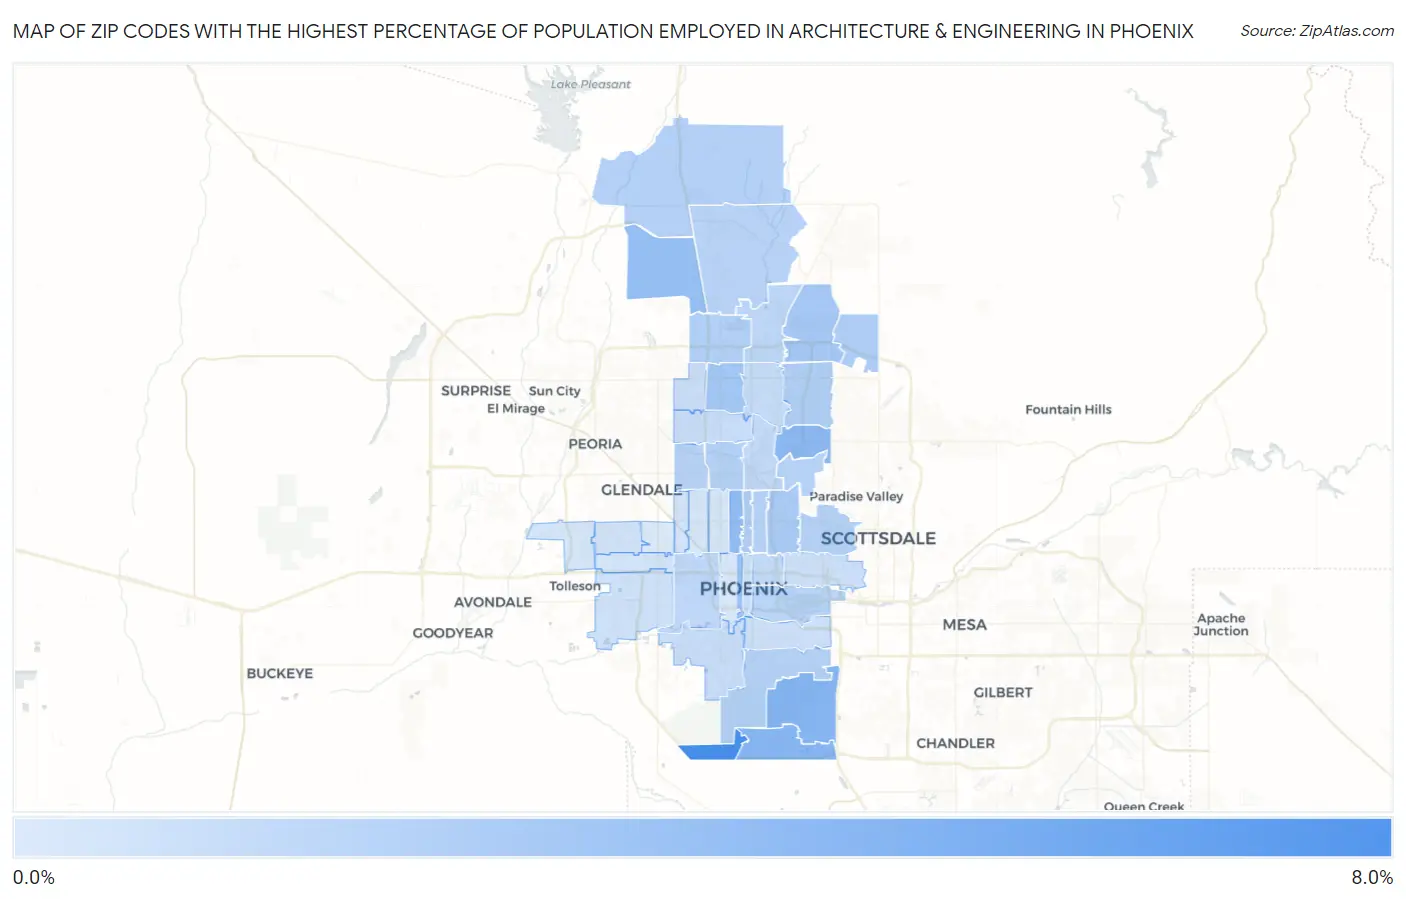
Map of Zip Codes with the Highest Percentage of Population Employed in Architecture & Engineering in Phoenix
0.40%
7.5%
Zip Codes with the Highest Percentage of Population Employed in Architecture & Engineering in Phoenix, AZ
| Zip Code | % Employed | vs State | vs National | |
| 1. | 85045 | 7.5% | 2.4%(+5.08)#9 | 2.1%(+5.33)#658 |
| 2. | 85044 | 4.4% | 2.4%(+1.99)#37 | 2.1%(+2.23)#2,282 |
| 3. | 85048 | 4.4% | 2.4%(+1.98)#38 | 2.1%(+2.22)#2,289 |
| 4. | 85028 | 4.1% | 2.4%(+1.67)#43 | 2.1%(+1.92)#2,676 |
| 5. | 85013 | 3.9% | 2.4%(+1.46)#47 | 2.1%(+1.70)#2,999 |
| 6. | 85083 | 3.8% | 2.4%(+1.36)#51 | 2.1%(+1.60)#3,193 |
| 7. | 85003 | 3.5% | 2.4%(+1.11)#62 | 2.1%(+1.36)#3,728 |
| 8. | 85023 | 3.1% | 2.4%(+0.704)#69 | 2.1%(+0.947)#4,754 |
| 9. | 85050 | 2.9% | 2.4%(+0.528)#81 | 2.1%(+0.770)#5,362 |
| 10. | 85016 | 2.7% | 2.4%(+0.300)#89 | 2.1%(+0.543)#6,196 |
| 11. | 85054 | 2.5% | 2.4%(+0.086)#103 | 2.1%(+0.328)#7,097 |
| 12. | 85012 | 2.5% | 2.4%(+0.083)#104 | 2.1%(+0.326)#7,111 |
| 13. | 85032 | 2.4% | 2.4%(-0.015)#112 | 2.1%(+0.227)#7,588 |
| 14. | 85086 | 2.4% | 2.4%(-0.038)#114 | 2.1%(+0.205)#7,702 |
| 15. | 85027 | 2.3% | 2.4%(-0.096)#119 | 2.1%(+0.146)#7,974 |
| 16. | 85021 | 2.2% | 2.4%(-0.185)#123 | 2.1%(+0.057)#8,446 |
| 17. | 85042 | 2.2% | 2.4%(-0.197)#124 | 2.1%(+0.046)#8,498 |
| 18. | 85018 | 2.2% | 2.4%(-0.236)#128 | 2.1%(+0.007)#8,716 |
| 19. | 85014 | 2.1% | 2.4%(-0.250)#129 | 2.1%(-0.007)#8,800 |
| 20. | 85051 | 2.1% | 2.4%(-0.338)#136 | 2.1%(-0.095)#9,298 |
| 21. | 85085 | 2.0% | 2.4%(-0.342)#137 | 2.1%(-0.100)#9,317 |
| 22. | 85034 | 2.0% | 2.4%(-0.425)#141 | 2.1%(-0.182)#9,814 |
| 23. | 85024 | 1.8% | 2.4%(-0.561)#152 | 2.1%(-0.319)#10,657 |
| 24. | 85009 | 1.8% | 2.4%(-0.638)#162 | 2.1%(-0.396)#11,117 |
| 25. | 85020 | 1.6% | 2.4%(-0.752)#182 | 2.1%(-0.510)#11,919 |
| 26. | 85006 | 1.5% | 2.4%(-0.874)#188 | 2.1%(-0.632)#12,753 |
| 27. | 85022 | 1.5% | 2.4%(-0.903)#190 | 2.1%(-0.661)#12,964 |
| 28. | 85004 | 1.4% | 2.4%(-0.992)#196 | 2.1%(-0.749)#13,586 |
| 29. | 85029 | 1.4% | 2.4%(-1.01)#197 | 2.1%(-0.765)#13,703 |
| 30. | 85041 | 1.4% | 2.4%(-1.01)#198 | 2.1%(-0.766)#13,707 |
| 31. | 85053 | 1.2% | 2.4%(-1.14)#209 | 2.1%(-0.902)#14,698 |
| 32. | 85008 | 1.2% | 2.4%(-1.21)#214 | 2.1%(-0.968)#15,230 |
| 33. | 85040 | 1.1% | 2.4%(-1.30)#219 | 2.1%(-1.05)#15,886 |
| 34. | 85043 | 1.1% | 2.4%(-1.33)#222 | 2.1%(-1.08)#16,138 |
| 35. | 85033 | 0.95% | 2.4%(-1.44)#231 | 2.1%(-1.20)#16,995 |
| 36. | 85035 | 0.84% | 2.4%(-1.55)#245 | 2.1%(-1.31)#17,830 |
| 37. | 85019 | 0.82% | 2.4%(-1.57)#247 | 2.1%(-1.33)#18,008 |
| 38. | 85037 | 0.73% | 2.4%(-1.66)#251 | 2.1%(-1.42)#18,692 |
| 39. | 85015 | 0.70% | 2.4%(-1.69)#253 | 2.1%(-1.45)#18,908 |
| 40. | 85017 | 0.68% | 2.4%(-1.72)#255 | 2.1%(-1.47)#19,070 |
| 41. | 85007 | 0.60% | 2.4%(-1.79)#259 | 2.1%(-1.55)#19,637 |
| 42. | 85031 | 0.40% | 2.4%(-1.99)#275 | 2.1%(-1.75)#20,966 |
1
Common Questions
What are the Top 10 Zip Codes with the Highest Percentage of Population Employed in Architecture & Engineering in Phoenix, AZ?
Top 10 Zip Codes with the Highest Percentage of Population Employed in Architecture & Engineering in Phoenix, AZ are:
What zip code has the Highest Percentage of Population Employed in Architecture & Engineering in Phoenix, AZ?
85045 has the Highest Percentage of Population Employed in Architecture & Engineering in Phoenix, AZ with 7.5%.
What is the Percentage of Population Employed in Architecture & Engineering in Phoenix, AZ?
Percentage of Population Employed in Architecture & Engineering in Phoenix is 1.9%.
What is the Percentage of Population Employed in Architecture & Engineering in Arizona?
Percentage of Population Employed in Architecture & Engineering in Arizona is 2.4%.
What is the Percentage of Population Employed in Architecture & Engineering in the United States?
Percentage of Population Employed in Architecture & Engineering in the United States is 2.1%.