Zip Codes with the Highest Percentage of Population with a Degree in Engineering in Phoenix, AZ
RELATED REPORTS & OPTIONS
Engineering
Phoenix
Compare Zip Codes
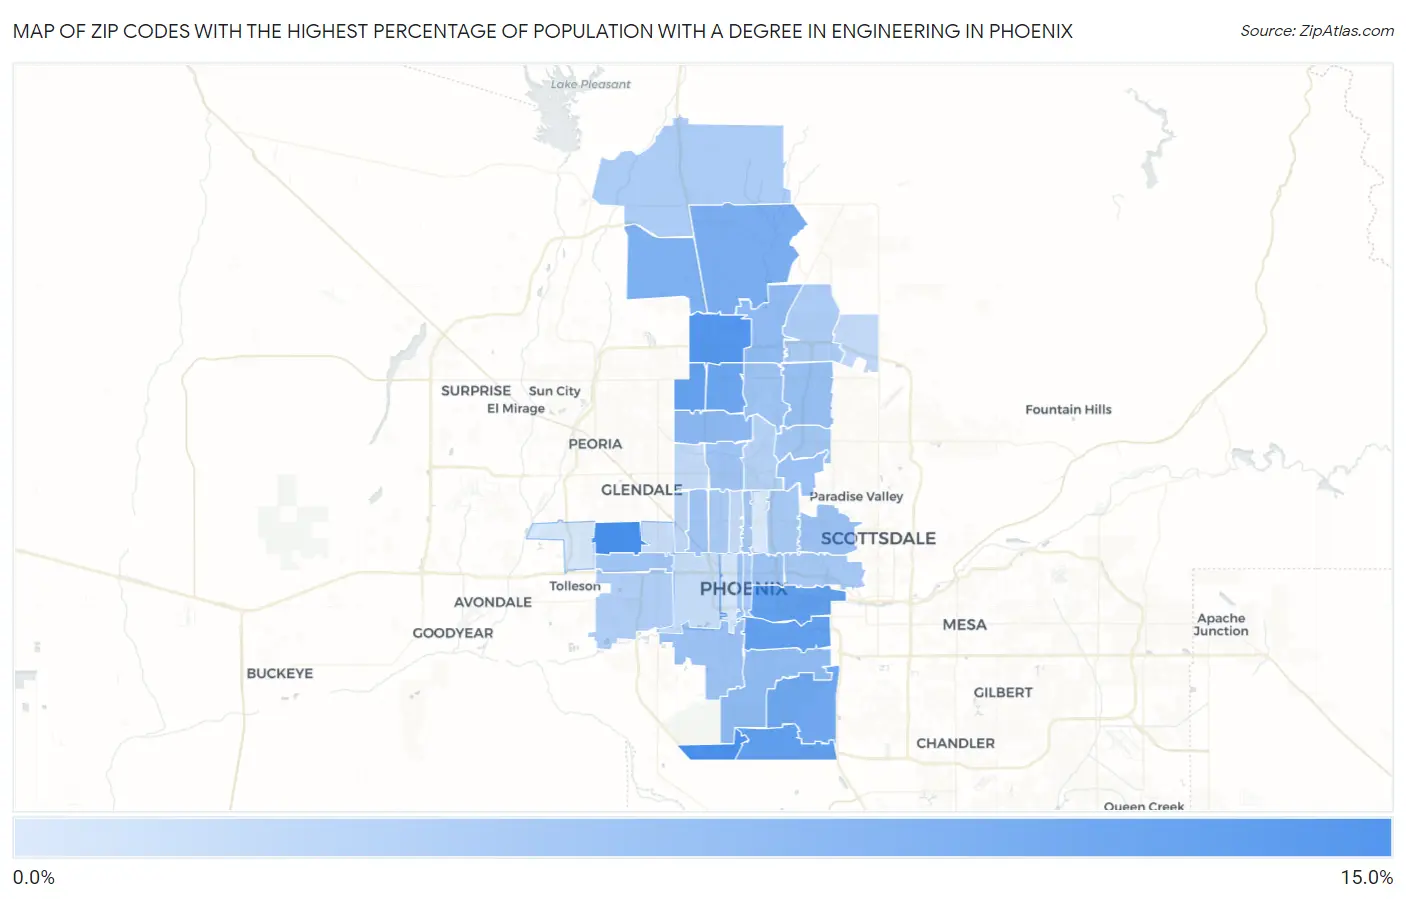
Map of Zip Codes with the Highest Percentage of Population with a Degree in Engineering in Phoenix
2.5%
12.8%
Zip Codes with the Highest Percentage of Population with a Degree in Engineering in Phoenix, AZ
| Zip Code | % Graduates | vs State | vs National | |
| 1. | 85033 | 12.8% | 8.0%(+4.80)#36 | 7.6%(+5.13)#2,501 |
| 2. | 85045 | 12.7% | 8.0%(+4.71)#37 | 7.6%(+5.04)#2,543 |
| 3. | 85027 | 11.8% | 8.0%(+3.82)#47 | 7.6%(+4.14)#3,001 |
| 4. | 85048 | 11.1% | 8.0%(+3.08)#52 | 7.6%(+3.41)#3,521 |
| 5. | 85040 | 10.9% | 8.0%(+2.88)#57 | 7.6%(+3.21)#3,650 |
| 6. | 85034 | 10.8% | 8.0%(+2.84)#58 | 7.6%(+3.17)#3,689 |
| 7. | 85053 | 10.6% | 8.0%(+2.63)#61 | 7.6%(+2.95)#3,880 |
| 8. | 85023 | 10.2% | 8.0%(+2.24)#68 | 7.6%(+2.57)#4,259 |
| 9. | 85044 | 9.9% | 8.0%(+1.95)#74 | 7.6%(+2.27)#4,512 |
| 10. | 85085 | 9.2% | 8.0%(+1.18)#87 | 7.6%(+1.51)#5,370 |
| 11. | 85083 | 8.9% | 8.0%(+0.887)#92 | 7.6%(+1.22)#5,785 |
| 12. | 85029 | 7.9% | 8.0%(-0.081)#115 | 7.6%(+0.247)#7,280 |
| 13. | 85042 | 7.7% | 8.0%(-0.288)#125 | 7.6%(+0.041)#7,675 |
| 14. | 85024 | 7.6% | 8.0%(-0.390)#128 | 7.6%(-0.061)#7,855 |
| 15. | 85032 | 7.1% | 8.0%(-0.871)#142 | 7.6%(-0.542)#8,761 |
| 16. | 85018 | 6.9% | 8.0%(-1.03)#152 | 7.6%(-0.701)#9,119 |
| 17. | 85041 | 6.9% | 8.0%(-1.12)#155 | 7.6%(-0.787)#9,283 |
| 18. | 85022 | 6.7% | 8.0%(-1.26)#161 | 7.6%(-0.936)#9,601 |
| 19. | 85006 | 6.7% | 8.0%(-1.28)#163 | 7.6%(-0.952)#9,638 |
| 20. | 85003 | 6.5% | 8.0%(-1.45)#170 | 7.6%(-1.12)#9,947 |
| 21. | 85035 | 6.5% | 8.0%(-1.45)#171 | 7.6%(-1.12)#9,956 |
| 22. | 85017 | 6.5% | 8.0%(-1.49)#172 | 7.6%(-1.16)#10,036 |
| 23. | 85021 | 6.5% | 8.0%(-1.50)#173 | 7.6%(-1.17)#10,066 |
| 24. | 85028 | 6.4% | 8.0%(-1.56)#175 | 7.6%(-1.23)#10,172 |
| 25. | 85012 | 6.4% | 8.0%(-1.56)#176 | 7.6%(-1.23)#10,176 |
| 26. | 85008 | 6.3% | 8.0%(-1.70)#182 | 7.6%(-1.37)#10,519 |
| 27. | 85016 | 6.1% | 8.0%(-1.85)#191 | 7.6%(-1.52)#10,889 |
| 28. | 85015 | 6.0% | 8.0%(-2.01)#195 | 7.6%(-1.68)#11,268 |
| 29. | 85004 | 5.9% | 8.0%(-2.06)#197 | 7.6%(-1.73)#11,381 |
| 30. | 85050 | 5.8% | 8.0%(-2.16)#200 | 7.6%(-1.83)#11,663 |
| 31. | 85086 | 5.7% | 8.0%(-2.24)#203 | 7.6%(-1.91)#11,842 |
| 32. | 85043 | 5.6% | 8.0%(-2.36)#209 | 7.6%(-2.03)#12,161 |
| 33. | 85020 | 5.1% | 8.0%(-2.86)#223 | 7.6%(-2.53)#13,375 |
| 34. | 85019 | 4.7% | 8.0%(-3.32)#240 | 7.6%(-2.99)#14,650 |
| 35. | 85054 | 4.3% | 8.0%(-3.68)#247 | 7.6%(-3.35)#15,565 |
| 36. | 85051 | 4.3% | 8.0%(-3.71)#249 | 7.6%(-3.38)#15,646 |
| 37. | 85013 | 4.2% | 8.0%(-3.79)#255 | 7.6%(-3.46)#15,840 |
| 38. | 85009 | 4.1% | 8.0%(-3.92)#259 | 7.6%(-3.60)#16,216 |
| 39. | 85031 | 3.8% | 8.0%(-4.13)#265 | 7.6%(-3.80)#16,794 |
| 40. | 85007 | 3.1% | 8.0%(-4.88)#277 | 7.6%(-4.55)#18,642 |
| 41. | 85037 | 3.0% | 8.0%(-5.01)#281 | 7.6%(-4.69)#18,987 |
| 42. | 85014 | 2.5% | 8.0%(-5.43)#288 | 7.6%(-5.10)#19,866 |
1
Common Questions
What are the Top 10 Zip Codes with the Highest Percentage of Population with a Degree in Engineering in Phoenix, AZ?
Top 10 Zip Codes with the Highest Percentage of Population with a Degree in Engineering in Phoenix, AZ are:
What zip code has the Highest Percentage of Population with a Degree in Engineering in Phoenix, AZ?
85033 has the Highest Percentage of Population with a Degree in Engineering in Phoenix, AZ with 12.8%.
What is the Percentage of Population with a Degree in Engineering in Phoenix, AZ?
Percentage of Population with a Degree in Engineering in Phoenix is 7.2%.
What is the Percentage of Population with a Degree in Engineering in Arizona?
Percentage of Population with a Degree in Engineering in Arizona is 8.0%.
What is the Percentage of Population with a Degree in Engineering in the United States?
Percentage of Population with a Degree in Engineering in the United States is 7.6%.