Zip Codes with the Highest Percentage of Households Without a Vehicle in Phoenix, AZ
RELATED REPORTS & OPTIONS
Households without a Cars
Phoenix
Compare Zip Codes
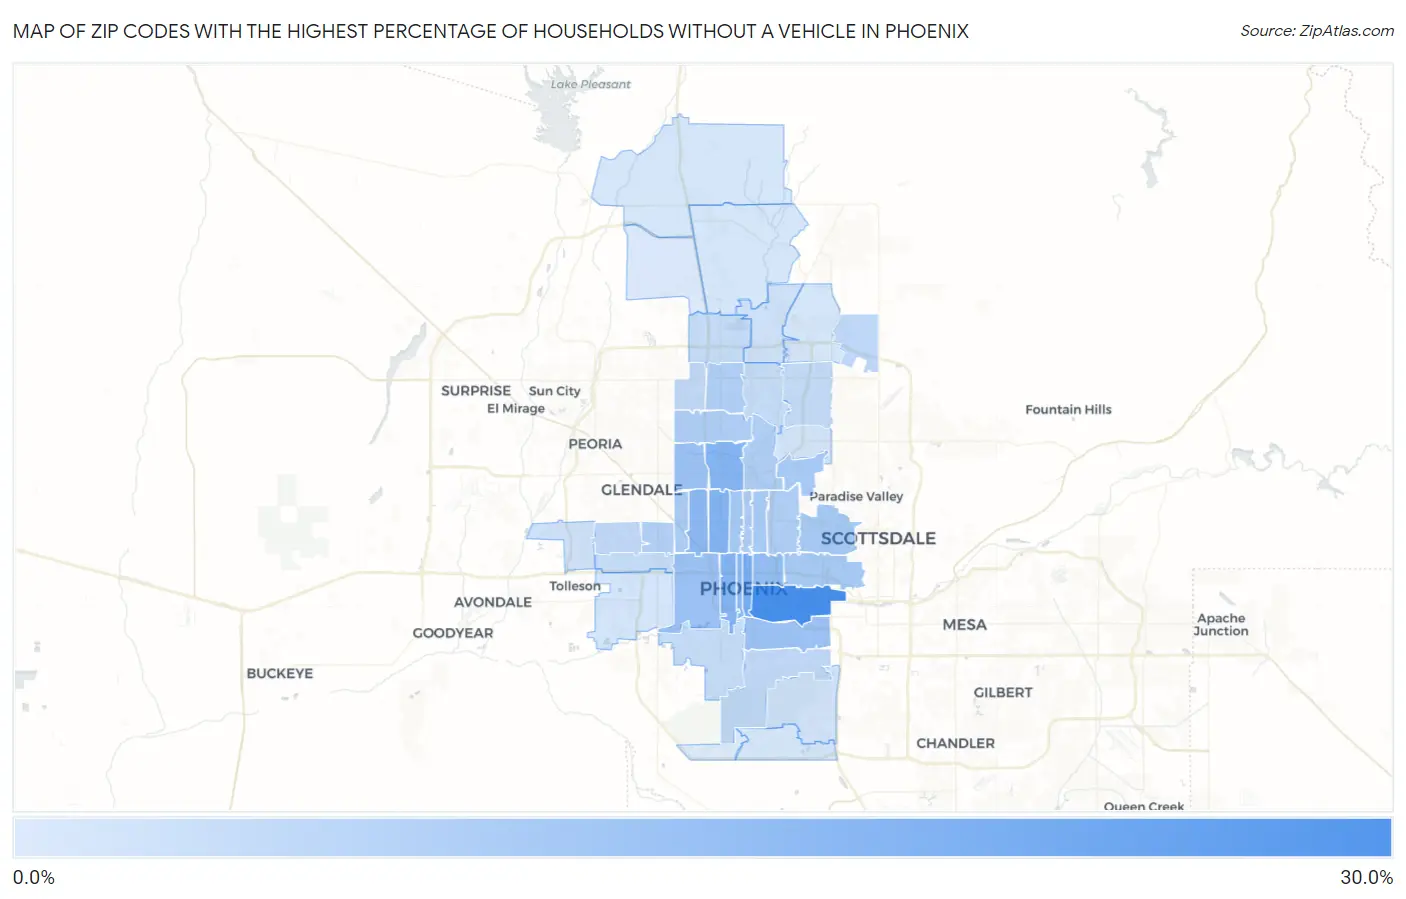
Map of Zip Codes with the Highest Percentage of Households Without a Vehicle in Phoenix
1.0%
27.1%
Zip Codes with the Highest Percentage of Households Without a Vehicle in Phoenix, AZ
| Zip Code | Housholds Without a Car | vs State | vs National | |
| 1. | 85034 | 27.1% | 5.5%(+21.6)#11 | 8.3%(+18.8)#935 |
| 2. | 85004 | 17.8% | 5.5%(+12.3)#30 | 8.3%(+9.50)#1,818 |
| 3. | 85015 | 16.1% | 5.5%(+10.6)#38 | 8.3%(+7.80)#2,125 |
| 4. | 85007 | 15.9% | 5.5%(+10.4)#40 | 8.3%(+7.60)#2,179 |
| 5. | 85021 | 15.6% | 5.5%(+10.1)#41 | 8.3%(+7.30)#2,231 |
| 6. | 85017 | 14.2% | 5.5%(+8.70)#50 | 8.3%(+5.90)#2,623 |
| 7. | 85003 | 14.2% | 5.5%(+8.70)#51 | 8.3%(+5.90)#2,636 |
| 8. | 85006 | 12.9% | 5.5%(+7.40)#59 | 8.3%(+4.60)#3,137 |
| 9. | 85051 | 11.8% | 5.5%(+6.30)#65 | 8.3%(+3.50)#3,659 |
| 10. | 85040 | 11.8% | 5.5%(+6.30)#66 | 8.3%(+3.50)#3,661 |
| 11. | 85009 | 11.6% | 5.5%(+6.10)#70 | 8.3%(+3.30)#3,749 |
| 12. | 85013 | 10.1% | 5.5%(+4.60)#80 | 8.3%(+1.80)#4,785 |
| 13. | 85008 | 9.6% | 5.5%(+4.10)#84 | 8.3%(+1.30)#5,176 |
| 14. | 85018 | 9.6% | 5.5%(+4.10)#85 | 8.3%(+1.30)#5,182 |
| 15. | 85014 | 9.0% | 5.5%(+3.50)#93 | 8.3%(+0.700)#5,740 |
| 16. | 85012 | 8.7% | 5.5%(+3.20)#95 | 8.3%(+0.400)#6,098 |
| 17. | 85019 | 8.6% | 5.5%(+3.10)#97 | 8.3%(+0.300)#6,181 |
| 18. | 85029 | 8.5% | 5.5%(+3.00)#100 | 8.3%(+0.200)#6,300 |
| 19. | 85020 | 8.5% | 5.5%(+3.00)#101 | 8.3%(+0.200)#6,310 |
| 20. | 85016 | 8.0% | 5.5%(+2.50)#104 | 8.3%(-0.300)#6,910 |
| 21. | 85023 | 7.9% | 5.5%(+2.40)#106 | 8.3%(-0.400)#7,080 |
| 22. | 85031 | 7.6% | 5.5%(+2.10)#110 | 8.3%(-0.700)#7,547 |
| 23. | 85054 | 5.7% | 5.5%(+0.200)#147 | 8.3%(-2.60)#11,197 |
| 24. | 85033 | 5.3% | 5.5%(-0.200)#156 | 8.3%(-3.00)#12,051 |
| 25. | 85042 | 5.2% | 5.5%(-0.300)#157 | 8.3%(-3.10)#12,318 |
| 26. | 85053 | 5.2% | 5.5%(-0.300)#158 | 8.3%(-3.10)#12,348 |
| 27. | 85032 | 4.9% | 5.5%(-0.600)#172 | 8.3%(-3.40)#13,064 |
| 28. | 85035 | 4.8% | 5.5%(-0.700)#176 | 8.3%(-3.50)#13,323 |
| 29. | 85022 | 4.7% | 5.5%(-0.800)#182 | 8.3%(-3.60)#13,624 |
| 30. | 85027 | 4.7% | 5.5%(-0.800)#183 | 8.3%(-3.60)#13,632 |
| 31. | 85041 | 4.5% | 5.5%(-1.00)#189 | 8.3%(-3.80)#14,165 |
| 32. | 85037 | 3.1% | 5.5%(-2.40)#240 | 8.3%(-5.20)#18,677 |
| 33. | 85024 | 3.1% | 5.5%(-2.40)#243 | 8.3%(-5.20)#18,746 |
| 34. | 85044 | 2.9% | 5.5%(-2.60)#252 | 8.3%(-5.40)#19,383 |
| 35. | 85043 | 2.5% | 5.5%(-3.00)#269 | 8.3%(-5.80)#20,722 |
| 36. | 85028 | 2.5% | 5.5%(-3.00)#274 | 8.3%(-5.80)#20,764 |
| 37. | 85086 | 2.2% | 5.5%(-3.30)#286 | 8.3%(-6.10)#21,711 |
| 38. | 85050 | 2.1% | 5.5%(-3.40)#291 | 8.3%(-6.20)#22,059 |
| 39. | 85048 | 1.9% | 5.5%(-3.60)#298 | 8.3%(-6.40)#22,769 |
| 40. | 85085 | 1.9% | 5.5%(-3.60)#300 | 8.3%(-6.40)#22,780 |
| 41. | 85083 | 1.2% | 5.5%(-4.30)#329 | 8.3%(-7.10)#25,069 |
| 42. | 85045 | 1.0% | 5.5%(-4.50)#331 | 8.3%(-7.30)#25,657 |
1
Common Questions
What are the Top 10 Zip Codes with the Highest Percentage of Households Without a Vehicle in Phoenix, AZ?
Top 10 Zip Codes with the Highest Percentage of Households Without a Vehicle in Phoenix, AZ are:
What zip code has the Highest Percentage of Households Without a Vehicle in Phoenix, AZ?
85034 has the Highest Percentage of Households Without a Vehicle in Phoenix, AZ with 27.1%.
What is the Percentage of Households Without a Vehicle in Phoenix, AZ?
Percentage of Households Without a Vehicle in Phoenix is 6.9%.
What is the Percentage of Households Without a Vehicle in Arizona?
Percentage of Households Without a Vehicle in Arizona is 5.5%.
What is the Percentage of Households Without a Vehicle in the United States?
Percentage of Households Without a Vehicle in the United States is 8.3%.