Zip Codes with the Highest Percentage of Population Employed in Installation, Maintenance & Repair in Phoenix, AZ
RELATED REPORTS & OPTIONS
Installation, Maintenance & Repair
Phoenix
Compare Zip Codes
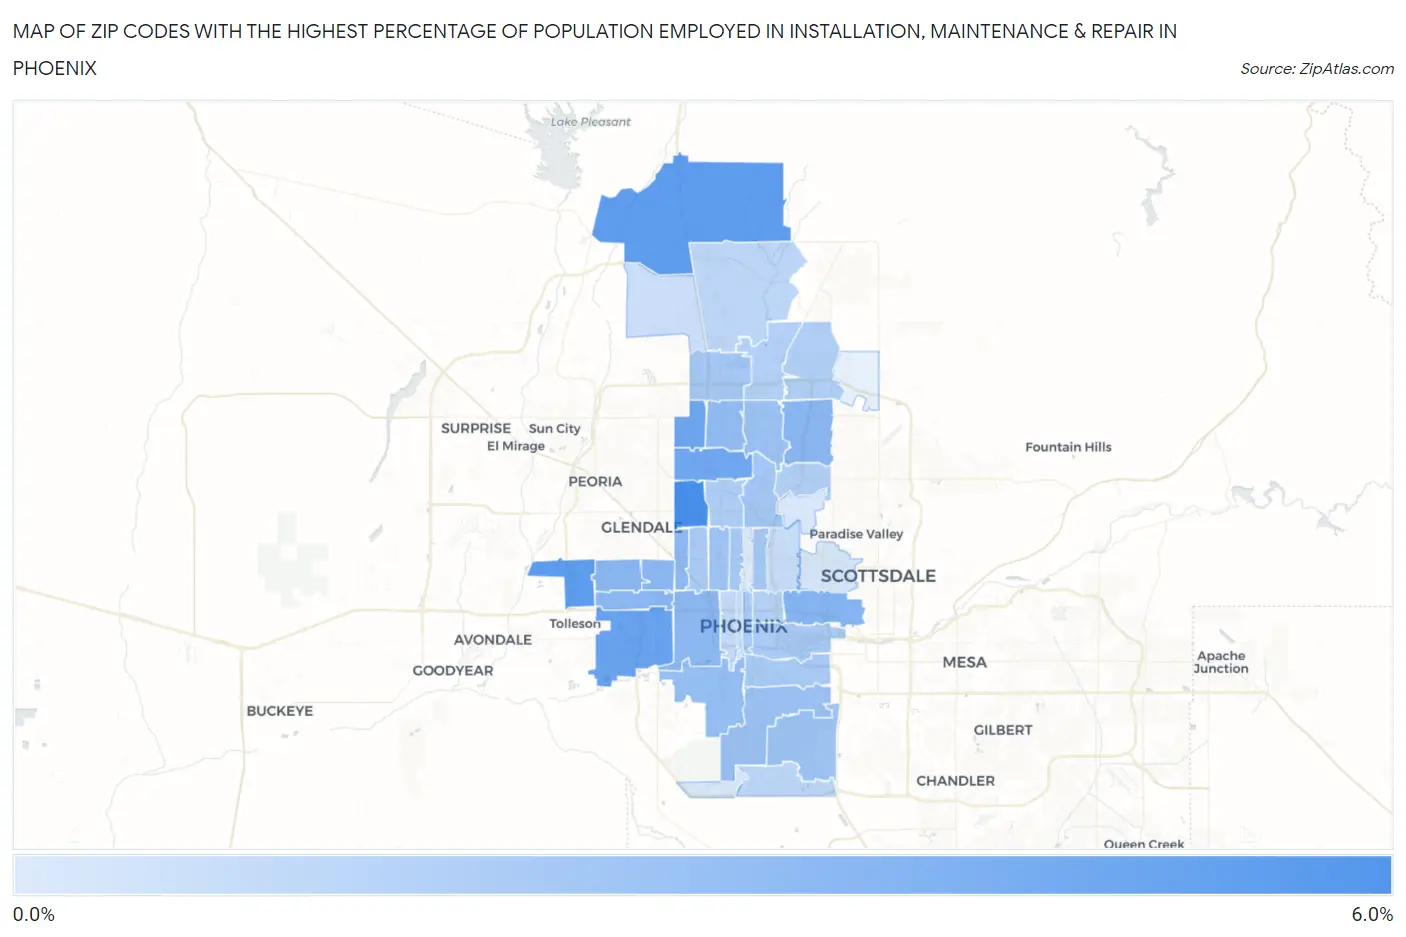
Map of Zip Codes with the Highest Percentage of Population Employed in Installation, Maintenance & Repair in Phoenix
0.46%
6.0%
Zip Codes with the Highest Percentage of Population Employed in Installation, Maintenance & Repair in Phoenix, AZ
| Zip Code | % Employed | vs State | vs National | |
| 1. | 85051 | 6.0% | 3.3%(+2.70)#45 | 3.1%(+2.89)#6,240 |
| 2. | 85037 | 5.1% | 3.3%(+1.84)#69 | 3.1%(+2.03)#8,401 |
| 3. | 85086 | 5.1% | 3.3%(+1.82)#70 | 3.1%(+2.01)#8,482 |
| 4. | 85043 | 4.7% | 3.3%(+1.46)#84 | 3.1%(+1.65)#9,632 |
| 5. | 85053 | 4.5% | 3.3%(+1.21)#92 | 3.1%(+1.40)#10,531 |
| 6. | 85029 | 4.4% | 3.3%(+1.13)#99 | 3.1%(+1.32)#10,807 |
| 7. | 85008 | 3.7% | 3.3%(+0.412)#132 | 3.1%(+0.602)#13,842 |
| 8. | 85032 | 3.4% | 3.3%(+0.189)#144 | 3.1%(+0.379)#14,880 |
| 9. | 85033 | 3.4% | 3.3%(+0.186)#145 | 3.1%(+0.376)#14,887 |
| 10. | 85035 | 3.4% | 3.3%(+0.179)#147 | 3.1%(+0.369)#14,918 |
| 11. | 85009 | 3.4% | 3.3%(+0.101)#157 | 3.1%(+0.291)#15,292 |
| 12. | 85031 | 3.4% | 3.3%(+0.096)#158 | 3.1%(+0.286)#15,310 |
| 13. | 85019 | 3.3% | 3.3%(+0.066)#159 | 3.1%(+0.256)#15,440 |
| 14. | 85023 | 3.2% | 3.3%(-0.074)#171 | 3.1%(+0.116)#16,111 |
| 15. | 85041 | 3.1% | 3.3%(-0.179)#179 | 3.1%(+0.011)#16,615 |
| 16. | 85042 | 2.9% | 3.3%(-0.385)#194 | 3.1%(-0.195)#17,650 |
| 17. | 85022 | 2.8% | 3.3%(-0.506)#207 | 3.1%(-0.316)#18,257 |
| 18. | 85044 | 2.7% | 3.3%(-0.514)#208 | 3.1%(-0.324)#18,298 |
| 19. | 85015 | 2.7% | 3.3%(-0.599)#217 | 3.1%(-0.409)#18,771 |
| 20. | 85020 | 2.6% | 3.3%(-0.691)#222 | 3.1%(-0.501)#19,237 |
| 21. | 85014 | 2.4% | 3.3%(-0.810)#226 | 3.1%(-0.620)#19,806 |
| 22. | 85027 | 2.4% | 3.3%(-0.835)#229 | 3.1%(-0.645)#19,951 |
| 23. | 85013 | 2.4% | 3.3%(-0.902)#236 | 3.1%(-0.712)#20,290 |
| 24. | 85004 | 2.3% | 3.3%(-0.914)#239 | 3.1%(-0.724)#20,351 |
| 25. | 85040 | 2.3% | 3.3%(-0.930)#240 | 3.1%(-0.740)#20,425 |
| 26. | 85017 | 2.3% | 3.3%(-0.970)#244 | 3.1%(-0.780)#20,634 |
| 27. | 85034 | 2.2% | 3.3%(-1.02)#249 | 3.1%(-0.825)#20,865 |
| 28. | 85021 | 2.1% | 3.3%(-1.18)#257 | 3.1%(-0.987)#21,637 |
| 29. | 85050 | 2.0% | 3.3%(-1.26)#262 | 3.1%(-1.07)#22,005 |
| 30. | 85024 | 2.0% | 3.3%(-1.27)#263 | 3.1%(-1.08)#22,084 |
| 31. | 85028 | 1.9% | 3.3%(-1.31)#264 | 3.1%(-1.12)#22,259 |
| 32. | 85006 | 1.9% | 3.3%(-1.40)#269 | 3.1%(-1.21)#22,622 |
| 33. | 85048 | 1.6% | 3.3%(-1.61)#283 | 3.1%(-1.42)#23,597 |
| 34. | 85085 | 1.6% | 3.3%(-1.68)#287 | 3.1%(-1.49)#23,863 |
| 35. | 85007 | 1.4% | 3.3%(-1.84)#295 | 3.1%(-1.65)#24,498 |
| 36. | 85016 | 1.2% | 3.3%(-2.06)#304 | 3.1%(-1.87)#25,284 |
| 37. | 85003 | 1.1% | 3.3%(-2.12)#306 | 3.1%(-1.93)#25,467 |
| 38. | 85083 | 1.1% | 3.3%(-2.13)#307 | 3.1%(-1.94)#25,497 |
| 39. | 85018 | 0.66% | 3.3%(-2.60)#322 | 3.1%(-2.41)#26,893 |
| 40. | 85045 | 0.63% | 3.3%(-2.63)#324 | 3.1%(-2.44)#26,949 |
| 41. | 85012 | 0.46% | 3.3%(-2.80)#328 | 3.1%(-2.61)#27,296 |
1
Common Questions
What are the Top 10 Zip Codes with the Highest Percentage of Population Employed in Installation, Maintenance & Repair in Phoenix, AZ?
Top 10 Zip Codes with the Highest Percentage of Population Employed in Installation, Maintenance & Repair in Phoenix, AZ are:
What zip code has the Highest Percentage of Population Employed in Installation, Maintenance & Repair in Phoenix, AZ?
85051 has the Highest Percentage of Population Employed in Installation, Maintenance & Repair in Phoenix, AZ with 6.0%.
What is the Percentage of Population Employed in Installation, Maintenance & Repair in Phoenix, AZ?
Percentage of Population Employed in Installation, Maintenance & Repair in Phoenix is 2.9%.
What is the Percentage of Population Employed in Installation, Maintenance & Repair in Arizona?
Percentage of Population Employed in Installation, Maintenance & Repair in Arizona is 3.3%.
What is the Percentage of Population Employed in Installation, Maintenance & Repair in the United States?
Percentage of Population Employed in Installation, Maintenance & Repair in the United States is 3.1%.