Zip Codes with the Highest Percentage of Population Employed in Office & Administration in Phoenix, AZ
RELATED REPORTS & OPTIONS
Office & Administration
Phoenix
Compare Zip Codes
Map of Zip Codes with the Highest Percentage of Population Employed in Office & Administration in Phoenix
4.2%
15.5%
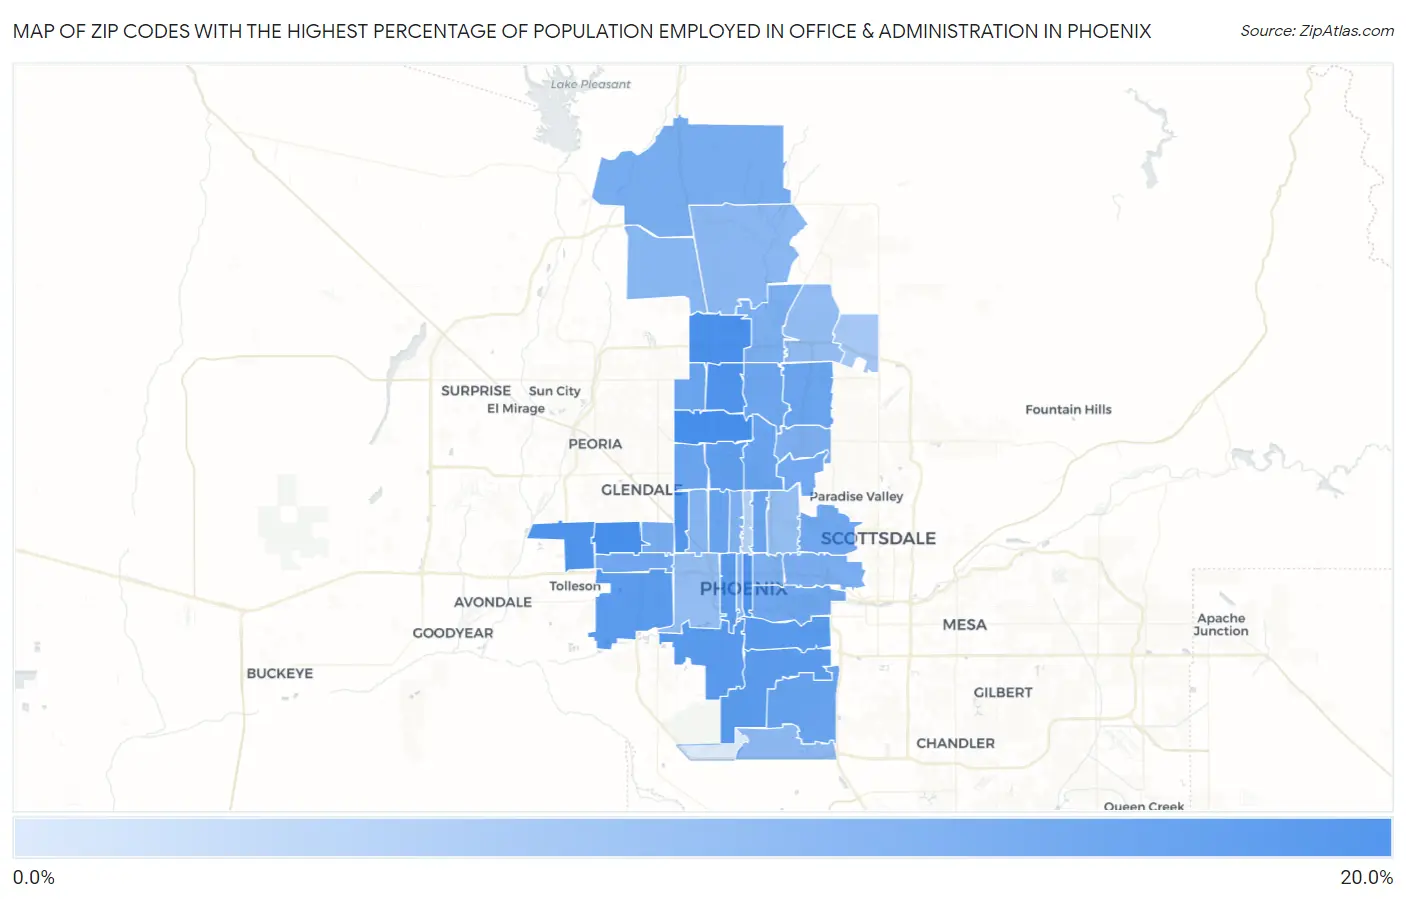
Zip Codes with the Highest Percentage of Population Employed in Office & Administration in Phoenix, AZ
| Zip Code | % Employed | vs State | vs National | |
| 1. | 85033 | 15.5% | 12.6%(+2.88)#77 | 10.9%(+4.61)#4,039 |
| 2. | 85029 | 15.5% | 12.6%(+2.87)#78 | 10.9%(+4.61)#4,045 |
| 3. | 85027 | 15.1% | 12.6%(+2.48)#89 | 10.9%(+4.21)#4,469 |
| 4. | 85037 | 14.8% | 12.6%(+2.18)#97 | 10.9%(+3.91)#4,882 |
| 5. | 85023 | 14.7% | 12.6%(+2.12)#99 | 10.9%(+3.85)#4,955 |
| 6. | 85004 | 14.7% | 12.6%(+2.08)#103 | 10.9%(+3.81)#5,027 |
| 7. | 85019 | 14.4% | 12.6%(+1.77)#112 | 10.9%(+3.51)#5,449 |
| 8. | 85040 | 14.3% | 12.6%(+1.68)#114 | 10.9%(+3.42)#5,601 |
| 9. | 85041 | 14.2% | 12.6%(+1.65)#116 | 10.9%(+3.38)#5,655 |
| 10. | 85043 | 14.0% | 12.6%(+1.37)#121 | 10.9%(+3.10)#6,093 |
| 11. | 85042 | 13.9% | 12.6%(+1.30)#124 | 10.9%(+3.04)#6,209 |
| 12. | 85007 | 13.9% | 12.6%(+1.27)#126 | 10.9%(+3.00)#6,275 |
| 13. | 85021 | 13.6% | 12.6%(+0.970)#136 | 10.9%(+2.70)#6,803 |
| 14. | 85020 | 12.9% | 12.6%(+0.267)#161 | 10.9%(+2.00)#8,414 |
| 15. | 85044 | 12.8% | 12.6%(+0.243)#163 | 10.9%(+1.98)#8,464 |
| 16. | 85015 | 12.8% | 12.6%(+0.186)#165 | 10.9%(+1.92)#8,604 |
| 17. | 85051 | 12.6% | 12.6%(+0.035)#170 | 10.9%(+1.77)#8,970 |
| 18. | 85032 | 12.6% | 12.6%(+0.009)#173 | 10.9%(+1.74)#9,046 |
| 19. | 85014 | 12.6% | 12.6%(-0.009)#174 | 10.9%(+1.72)#9,086 |
| 20. | 85053 | 12.6% | 12.6%(-0.017)#175 | 10.9%(+1.72)#9,103 |
| 21. | 85022 | 12.4% | 12.6%(-0.153)#184 | 10.9%(+1.58)#9,468 |
| 22. | 85034 | 12.3% | 12.6%(-0.276)#190 | 10.9%(+1.46)#9,817 |
| 23. | 85018 | 12.3% | 12.6%(-0.309)#193 | 10.9%(+1.42)#9,894 |
| 24. | 85035 | 12.2% | 12.6%(-0.371)#196 | 10.9%(+1.36)#10,096 |
| 25. | 85031 | 11.8% | 12.6%(-0.834)#209 | 10.9%(+0.899)#11,468 |
| 26. | 85086 | 11.7% | 12.6%(-0.853)#211 | 10.9%(+0.880)#11,526 |
| 27. | 85008 | 11.5% | 12.6%(-1.09)#217 | 10.9%(+0.639)#12,249 |
| 28. | 85024 | 11.4% | 12.6%(-1.18)#222 | 10.9%(+0.553)#12,512 |
| 29. | 85006 | 11.2% | 12.6%(-1.40)#234 | 10.9%(+0.333)#13,237 |
| 30. | 85028 | 11.1% | 12.6%(-1.48)#237 | 10.9%(+0.249)#13,519 |
| 31. | 85013 | 11.0% | 12.6%(-1.55)#239 | 10.9%(+0.184)#13,713 |
| 32. | 85083 | 10.6% | 12.6%(-2.03)#254 | 10.9%(-0.296)#15,269 |
| 33. | 85017 | 10.5% | 12.6%(-2.06)#256 | 10.9%(-0.326)#15,360 |
| 34. | 85003 | 10.4% | 12.6%(-2.18)#261 | 10.9%(-0.447)#15,793 |
| 35. | 85085 | 10.4% | 12.6%(-2.21)#263 | 10.9%(-0.482)#15,914 |
| 36. | 85048 | 10.2% | 12.6%(-2.37)#268 | 10.9%(-0.633)#16,415 |
| 37. | 85009 | 9.7% | 12.6%(-2.91)#279 | 10.9%(-1.18)#18,152 |
| 38. | 85050 | 9.6% | 12.6%(-3.03)#281 | 10.9%(-1.29)#18,541 |
| 39. | 85016 | 9.4% | 12.6%(-3.22)#287 | 10.9%(-1.48)#19,177 |
| 40. | 85054 | 8.3% | 12.6%(-4.28)#309 | 10.9%(-2.55)#22,206 |
| 41. | 85012 | 7.3% | 12.6%(-5.32)#329 | 10.9%(-3.58)#24,659 |
| 42. | 85045 | 4.2% | 12.6%(-8.36)#355 | 10.9%(-6.62)#28,814 |
1
Common Questions
What are the Top 10 Zip Codes with the Highest Percentage of Population Employed in Office & Administration in Phoenix, AZ?
Top 10 Zip Codes with the Highest Percentage of Population Employed in Office & Administration in Phoenix, AZ are:
What zip code has the Highest Percentage of Population Employed in Office & Administration in Phoenix, AZ?
85033 has the Highest Percentage of Population Employed in Office & Administration in Phoenix, AZ with 15.5%.
What is the Percentage of Population Employed in Office & Administration in Phoenix, AZ?
Percentage of Population Employed in Office & Administration in Phoenix is 12.7%.
What is the Percentage of Population Employed in Office & Administration in Arizona?
Percentage of Population Employed in Office & Administration in Arizona is 12.6%.
What is the Percentage of Population Employed in Office & Administration in the United States?
Percentage of Population Employed in Office & Administration in the United States is 10.9%.