Zip Codes with the Highest Percentage of Population Employed in Real Estate, Rental & Leasing in Phoenix, AZ
RELATED REPORTS & OPTIONS
Real Estate, Rental & Leasing
Phoenix
Compare Zip Codes
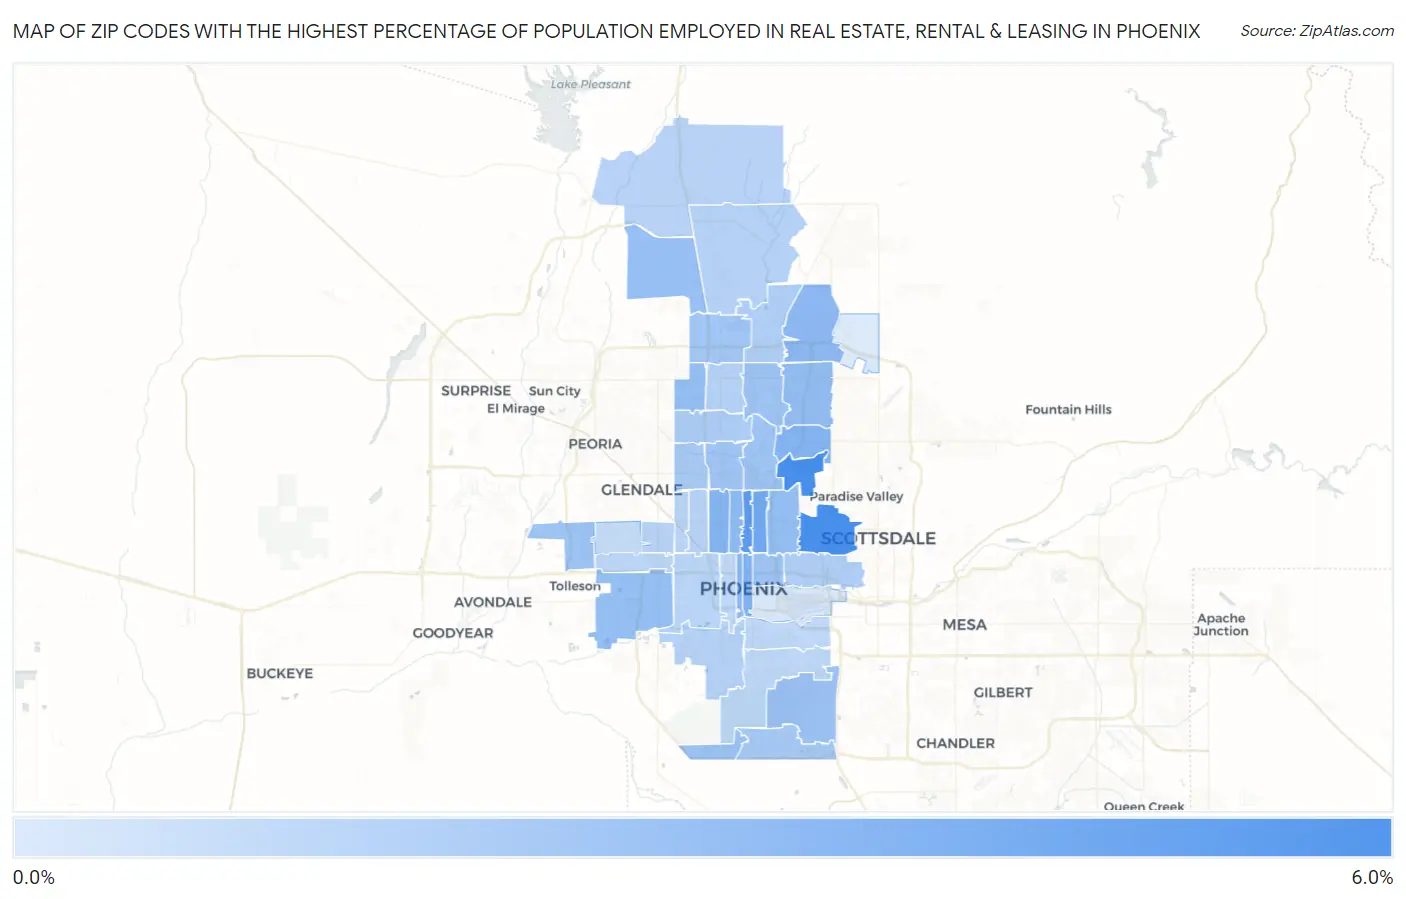
Map of Zip Codes with the Highest Percentage of Population Employed in Real Estate, Rental & Leasing in Phoenix
0.30%
5.6%
Zip Codes with the Highest Percentage of Population Employed in Real Estate, Rental & Leasing in Phoenix, AZ
| Zip Code | % Employed | vs State | vs National | |
| 1. | 85018 | 5.6% | 2.4%(+3.24)#15 | 1.9%(+3.75)#1,099 |
| 2. | 85012 | 5.0% | 2.4%(+2.55)#24 | 1.9%(+3.06)#1,425 |
| 3. | 85014 | 4.0% | 2.4%(+1.63)#43 | 1.9%(+2.15)#2,125 |
| 4. | 85004 | 3.5% | 2.4%(+1.10)#67 | 1.9%(+1.61)#2,840 |
| 5. | 85028 | 3.4% | 2.4%(+1.03)#71 | 1.9%(+1.54)#2,965 |
| 6. | 85015 | 3.4% | 2.4%(+1.02)#72 | 1.9%(+1.53)#2,982 |
| 7. | 85050 | 3.2% | 2.4%(+0.770)#85 | 1.9%(+1.28)#3,470 |
| 8. | 85003 | 3.1% | 2.4%(+0.700)#86 | 1.9%(+1.21)#3,614 |
| 9. | 85013 | 3.1% | 2.4%(+0.696)#87 | 1.9%(+1.21)#3,620 |
| 10. | 85032 | 2.9% | 2.4%(+0.453)#96 | 1.9%(+0.965)#4,285 |
| 11. | 85016 | 2.8% | 2.4%(+0.435)#98 | 1.9%(+0.947)#4,327 |
| 12. | 85053 | 2.8% | 2.4%(+0.416)#101 | 1.9%(+0.929)#4,378 |
| 13. | 85043 | 2.8% | 2.4%(+0.389)#103 | 1.9%(+0.902)#4,449 |
| 14. | 85083 | 2.7% | 2.4%(+0.295)#110 | 1.9%(+0.808)#4,749 |
| 15. | 85044 | 2.6% | 2.4%(+0.211)#118 | 1.9%(+0.723)#5,051 |
| 16. | 85045 | 2.5% | 2.4%(+0.136)#124 | 1.9%(+0.649)#5,330 |
| 17. | 85020 | 2.5% | 2.4%(+0.120)#126 | 1.9%(+0.633)#5,394 |
| 18. | 85022 | 2.5% | 2.4%(+0.104)#128 | 1.9%(+0.617)#5,458 |
| 19. | 85037 | 2.5% | 2.4%(+0.096)#129 | 1.9%(+0.609)#5,484 |
| 20. | 85006 | 2.5% | 2.4%(+0.087)#130 | 1.9%(+0.599)#5,525 |
| 21. | 85021 | 2.4% | 2.4%(-0.035)#140 | 1.9%(+0.478)#6,023 |
| 22. | 85027 | 2.3% | 2.4%(-0.054)#142 | 1.9%(+0.458)#6,101 |
| 23. | 85048 | 2.2% | 2.4%(-0.179)#151 | 1.9%(+0.333)#6,688 |
| 24. | 85051 | 2.2% | 2.4%(-0.253)#160 | 1.9%(+0.259)#7,066 |
| 25. | 85029 | 2.0% | 2.4%(-0.417)#175 | 1.9%(+0.095)#7,909 |
| 26. | 85024 | 1.9% | 2.4%(-0.474)#179 | 1.9%(+0.038)#8,252 |
| 27. | 85008 | 1.9% | 2.4%(-0.480)#181 | 1.9%(+0.033)#8,297 |
| 28. | 85041 | 1.7% | 2.4%(-0.705)#200 | 1.9%(-0.193)#9,761 |
| 29. | 85085 | 1.7% | 2.4%(-0.734)#203 | 1.9%(-0.221)#9,971 |
| 30. | 85023 | 1.7% | 2.4%(-0.743)#207 | 1.9%(-0.230)#10,035 |
| 31. | 85031 | 1.6% | 2.4%(-0.796)#213 | 1.9%(-0.284)#10,391 |
| 32. | 85086 | 1.6% | 2.4%(-0.806)#216 | 1.9%(-0.293)#10,444 |
| 33. | 85017 | 1.6% | 2.4%(-0.813)#217 | 1.9%(-0.301)#10,506 |
| 34. | 85009 | 1.5% | 2.4%(-0.919)#228 | 1.9%(-0.406)#11,265 |
| 35. | 85019 | 1.5% | 2.4%(-0.934)#230 | 1.9%(-0.422)#11,397 |
| 36. | 85035 | 1.5% | 2.4%(-0.944)#231 | 1.9%(-0.431)#11,478 |
| 37. | 85042 | 1.4% | 2.4%(-1.05)#243 | 1.9%(-0.537)#12,312 |
| 38. | 85040 | 1.3% | 2.4%(-1.06)#244 | 1.9%(-0.548)#12,397 |
| 39. | 85007 | 1.3% | 2.4%(-1.08)#246 | 1.9%(-0.572)#12,574 |
| 40. | 85033 | 1.1% | 2.4%(-1.31)#262 | 1.9%(-0.799)#14,363 |
| 41. | 85034 | 0.43% | 2.4%(-1.97)#284 | 1.9%(-1.46)#19,579 |
| 42. | 85054 | 0.30% | 2.4%(-2.11)#294 | 1.9%(-1.59)#20,490 |
1
Common Questions
What are the Top 10 Zip Codes with the Highest Percentage of Population Employed in Real Estate, Rental & Leasing in Phoenix, AZ?
Top 10 Zip Codes with the Highest Percentage of Population Employed in Real Estate, Rental & Leasing in Phoenix, AZ are:
What zip code has the Highest Percentage of Population Employed in Real Estate, Rental & Leasing in Phoenix, AZ?
85018 has the Highest Percentage of Population Employed in Real Estate, Rental & Leasing in Phoenix, AZ with 5.6%.
What is the Percentage of Population Employed in Real Estate, Rental & Leasing in Phoenix, AZ?
Percentage of Population Employed in Real Estate, Rental & Leasing in Phoenix is 2.4%.
What is the Percentage of Population Employed in Real Estate, Rental & Leasing in Arizona?
Percentage of Population Employed in Real Estate, Rental & Leasing in Arizona is 2.4%.
What is the Percentage of Population Employed in Real Estate, Rental & Leasing in the United States?
Percentage of Population Employed in Real Estate, Rental & Leasing in the United States is 1.9%.