Zip Codes with the Most Immigrants from Mexico in Phoenix, AZ
RELATED REPORTS & OPTIONS
Mexico
Phoenix
Compare Zip Codes
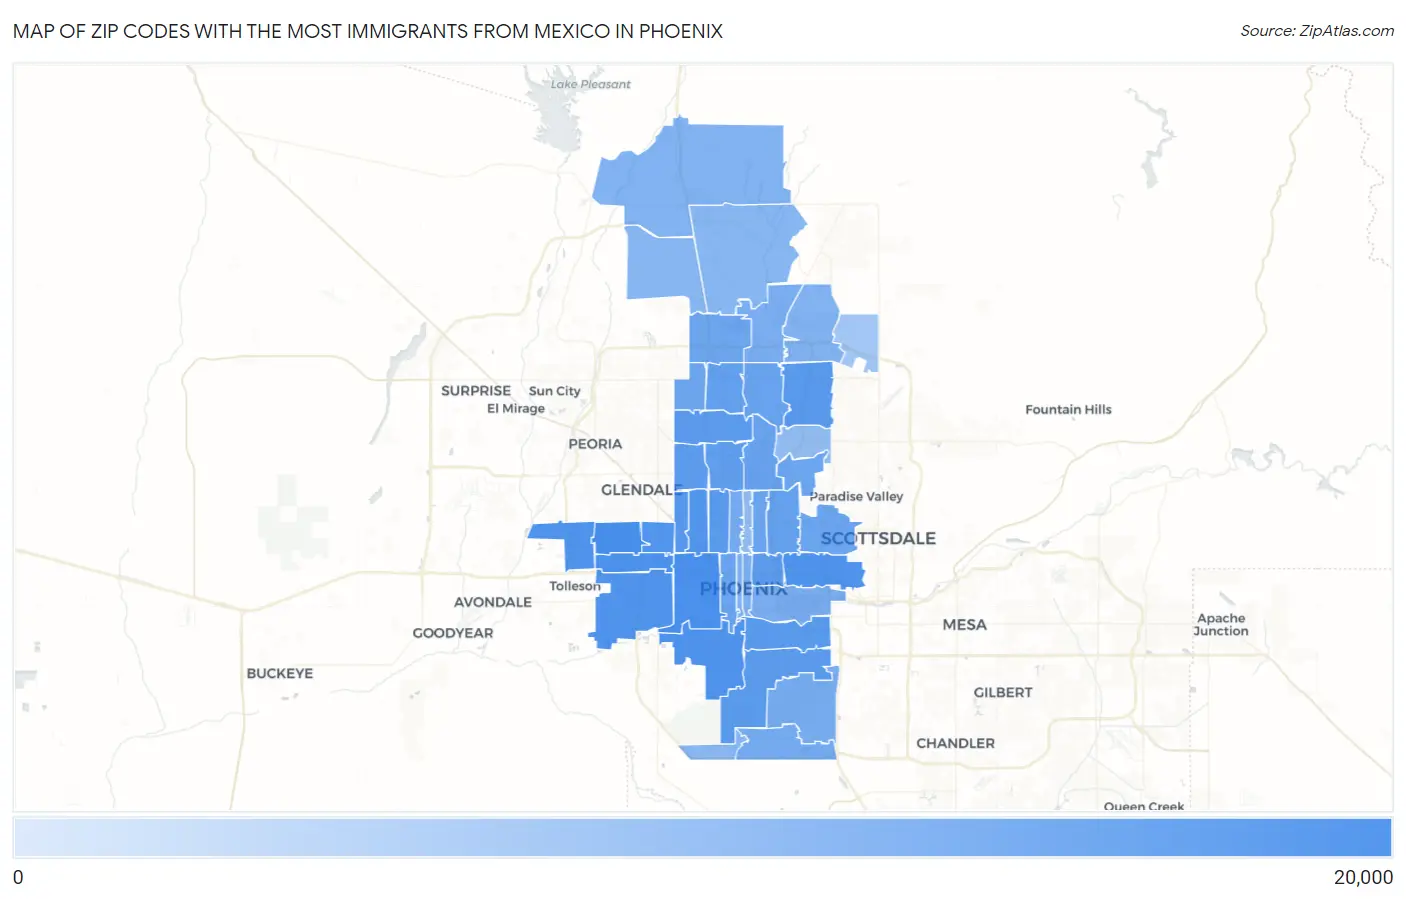
Map of Zip Codes with the Most Immigrants from Mexico in Phoenix
45
17,759
Zip Codes with the Most Immigrants from Mexico in Phoenix, AZ
| Zip Code | Mexico | vs State | vs National | |
| 1. | 85033 | 17,759 | 500,086(3.55%)#1 | 10,767,104(0.16%)#40 |
| 2. | 85009 | 14,369 | 500,086(2.87%)#2 | 10,767,104(0.13%)#72 |
| 3. | 85035 | 13,881 | 500,086(2.78%)#3 | 10,767,104(0.13%)#78 |
| 4. | 85008 | 12,117 | 500,086(2.42%)#7 | 10,767,104(0.11%)#113 |
| 5. | 85041 | 11,550 | 500,086(2.31%)#8 | 10,767,104(0.11%)#125 |
| 6. | 85037 | 10,376 | 500,086(2.07%)#10 | 10,767,104(0.10%)#149 |
| 7. | 85043 | 10,288 | 500,086(2.06%)#11 | 10,767,104(0.10%)#150 |
| 8. | 85031 | 8,806 | 500,086(1.76%)#14 | 10,767,104(0.08%)#201 |
| 9. | 85017 | 8,796 | 500,086(1.76%)#15 | 10,767,104(0.08%)#202 |
| 10. | 85032 | 6,262 | 500,086(1.25%)#24 | 10,767,104(0.06%)#372 |
| 11. | 85019 | 6,132 | 500,086(1.23%)#26 | 10,767,104(0.06%)#392 |
| 12. | 85040 | 5,909 | 500,086(1.18%)#28 | 10,767,104(0.05%)#412 |
| 13. | 85015 | 5,812 | 500,086(1.16%)#29 | 10,767,104(0.05%)#420 |
| 14. | 85042 | 5,578 | 500,086(1.12%)#30 | 10,767,104(0.05%)#437 |
| 15. | 85029 | 4,693 | 500,086(0.94%)#35 | 10,767,104(0.04%)#533 |
| 16. | 85006 | 4,435 | 500,086(0.89%)#37 | 10,767,104(0.04%)#571 |
| 17. | 85051 | 4,035 | 500,086(0.81%)#41 | 10,767,104(0.04%)#634 |
| 18. | 85021 | 3,221 | 500,086(0.64%)#46 | 10,767,104(0.03%)#794 |
| 19. | 85023 | 2,847 | 500,086(0.57%)#50 | 10,767,104(0.03%)#906 |
| 20. | 85016 | 2,584 | 500,086(0.52%)#52 | 10,767,104(0.02%)#980 |
| 21. | 85020 | 2,307 | 500,086(0.46%)#58 | 10,767,104(0.02%)#1,095 |
| 22. | 85022 | 1,931 | 500,086(0.39%)#63 | 10,767,104(0.02%)#1,305 |
| 23. | 85007 | 1,756 | 500,086(0.35%)#67 | 10,767,104(0.02%)#1,428 |
| 24. | 85014 | 1,682 | 500,086(0.34%)#71 | 10,767,104(0.02%)#1,479 |
| 25. | 85018 | 1,601 | 500,086(0.32%)#73 | 10,767,104(0.01%)#1,541 |
| 26. | 85053 | 1,436 | 500,086(0.29%)#79 | 10,767,104(0.01%)#1,692 |
| 27. | 85027 | 1,421 | 500,086(0.28%)#80 | 10,767,104(0.01%)#1,709 |
| 28. | 85013 | 874 | 500,086(0.17%)#107 | 10,767,104(0.01%)#2,437 |
| 29. | 85048 | 840 | 500,086(0.17%)#110 | 10,767,104(0.01%)#2,505 |
| 30. | 85044 | 802 | 500,086(0.16%)#115 | 10,767,104(0.01%)#2,571 |
| 31. | 85034 | 692 | 500,086(0.14%)#132 | 10,767,104(0.01%)#2,854 |
| 32. | 85024 | 603 | 500,086(0.12%)#142 | 10,767,104(0.01%)#3,131 |
| 33. | 85004 | 589 | 500,086(0.12%)#143 | 10,767,104(0.01%)#3,180 |
| 34. | 85003 | 434 | 500,086(0.09%)#156 | 10,767,104(0.00%)#3,861 |
| 35. | 85050 | 429 | 500,086(0.09%)#158 | 10,767,104(0.00%)#3,891 |
| 36. | 85086 | 399 | 500,086(0.08%)#164 | 10,767,104(0.00%)#4,083 |
| 37. | 85085 | 276 | 500,086(0.06%)#185 | 10,767,104(0.00%)#4,961 |
| 38. | 85083 | 243 | 500,086(0.05%)#195 | 10,767,104(0.00%)#5,300 |
| 39. | 85045 | 231 | 500,086(0.05%)#202 | 10,767,104(0.00%)#5,439 |
| 40. | 85012 | 136 | 500,086(0.03%)#220 | 10,767,104(0.00%)#6,987 |
| 41. | 85028 | 124 | 500,086(0.02%)#226 | 10,767,104(0.00%)#7,277 |
| 42. | 85054 | 45 | 500,086(0.01%)#271 | 10,767,104(0.00%)#10,277 |
1
Common Questions
What are the Top 10 Zip Codes with the Most Immigrants from Mexico in Phoenix, AZ?
Top 10 Zip Codes with the Most Immigrants from Mexico in Phoenix, AZ are:
What zip code has the Most Immigrants from Mexico in Phoenix, AZ?
85033 has the Most Immigrants from Mexico in Phoenix, AZ with 17,759.
What is the Total Immigrants from Mexico in Phoenix, AZ?
Total Immigrants from Mexico in Phoenix is 189,099.
What is the Total Immigrants from Mexico in Arizona?
Total Immigrants from Mexico in Arizona is 500,086.
What is the Total Immigrants from Mexico in the United States?
Total Immigrants from Mexico in the United States is 10,767,104.