Zip Codes with the Highest Percentage of Population Taking Public Transit to Work in Phoenix, AZ

RELATED REPORTS & OPTIONS

Public Transit
Population
Families and Households
Female Fertility
Female Fertility (Unmarried)
Race (Community Size)
Race (Percentage)
Ancestry (Community Size)
AfghanAfricanAlaska NativeAlaskan AthabascanAlbanianAmericanApacheArabArgentineanArmenianAssyrian / Chaldean / SyriacAustralianAustrianBahamianBangladeshiBarbadianBasqueBelgianBelizeanBhutaneseBlackfeetBolivianBrazilianBritishBritish West IndianBulgarianBurmeseCajunCanadianCape VerdeanCarpatho RusynCelticCentral AmericanCentral American IndianCherokeeCheyenneChickasawChileanChippewaChoctawColombianColvilleComancheCosta RicanCreeCreekCroatianCubanCypriotCzechCzechoslovakianDanishDelawareDominicanDutchEastern EuropeanEcuadorianEgyptianEnglishEstonianEthiopianEuropeanFijianFilipinoFinnishFrenchFrench American IndianFrench CanadianGermanGerman RussianGhanaianGreekGuamanian / ChamorroGuatemalanGuyaneseHaitianHonduranHopiHungarianIcelanderIndian (Asian)IndonesianInupiatIranianIraqiIrishIroquoisIsraeliItalianJamaicanJapaneseJordanianKenyanKiowaKoreanLaotianLatvianLebaneseLiberianLithuanianLuxembourgerMacedonianMalaysianMalteseMexicanMexican American IndianMongolianMoroccanNative HawaiianNavajoNew ZealanderNicaraguanNigerianNorthern EuropeanNorwegianOsagePaiutePakistaniPalestinianPanamanianParaguayanPennsylvania GermanPeruvianPimaPolishPortuguesePotawatomiPuebloPuerto RicanPuget Sound SalishRomanianRussianSalvadoranSamoanScandinavianScotch-IrishScottishSeminoleSenegaleseSerbianShoshoneSierra LeoneanSiouxSlavicSlovakSloveneSomaliSouth AfricanSouth AmericanSouth American IndianSoviet UnionSpaniardSpanishSpanish AmericanSpanish American IndianSri LankanSubsaharan AfricanSudaneseSwedishSwissSyrianThaiTlingit-HaidaTohono O'OdhamTonganTrinidadian and TobagonianTurkishUgandanUkrainianUruguayanUteVenezuelanVietnameseWelshWest IndianYakamaYaquiYugoslavianYumanZimbabwean
Ancestry (Percentage)
AfghanAfricanAlaska NativeAlaskan AthabascanAlbanianAmericanApacheArabArgentineanArmenianAssyrian / Chaldean / SyriacAustralianAustrianBahamianBangladeshiBarbadianBasqueBelgianBelizeanBhutaneseBlackfeetBolivianBrazilianBritishBritish West IndianBulgarianBurmeseCajunCanadianCape VerdeanCarpatho RusynCelticCentral AmericanCentral American IndianCherokeeCheyenneChickasawChileanChippewaChoctawColombianColvilleComancheCosta RicanCreeCreekCroatianCubanCypriotCzechCzechoslovakianDanishDelawareDominicanDutchEastern EuropeanEcuadorianEgyptianEnglishEstonianEthiopianEuropeanFijianFilipinoFinnishFrenchFrench American IndianFrench CanadianGermanGerman RussianGhanaianGreekGuamanian / ChamorroGuatemalanGuyaneseHaitianHonduranHopiHungarianIcelanderIndian (Asian)IndonesianInupiatIranianIraqiIrishIroquoisIsraeliItalianJamaicanJapaneseJordanianKenyanKiowaKoreanLaotianLatvianLebaneseLiberianLithuanianLuxembourgerMacedonianMalaysianMalteseMexicanMexican American IndianMongolianMoroccanNative HawaiianNavajoNew ZealanderNicaraguanNigerianNorthern EuropeanNorwegianOsagePaiutePakistaniPalestinianPanamanianParaguayanPennsylvania GermanPeruvianPimaPolishPortuguesePotawatomiPuebloPuerto RicanPuget Sound SalishRomanianRussianSalvadoranSamoanScandinavianScotch-IrishScottishSeminoleSenegaleseSerbianShoshoneSierra LeoneanSiouxSlavicSlovakSloveneSomaliSouth AfricanSouth AmericanSouth American IndianSoviet UnionSpaniardSpanishSpanish AmericanSpanish American IndianSri LankanSubsaharan AfricanSudaneseSwedishSwissSyrianThaiTlingit-HaidaTohono O'OdhamTonganTrinidadian and TobagonianTurkishUgandanUkrainianUruguayanUteVenezuelanVietnameseWelshWest IndianYakamaYaquiYugoslavianYumanZimbabwean
Immigrant Origin (Total)
AfghanistanAfricaAlbaniaArgentinaArmeniaAsiaAustraliaAustriaBahamasBangladeshBarbadosBelarusBelgiumBelizeBoliviaBosnia and HerzegovinaBrazilBulgariaBurma / MyanmarCambodiaCameroonCanadaCaribbeanCentral AmericaChileChinaColombiaCongoCosta RicaCroatiaCubaCzechoslovakiaDenmarkDominicaDominican RepublicEastern AfricaEastern AsiaEastern EuropeEcuadorEgyptEl SalvadorEnglandEritreaEthiopiaEuropeFranceGermanyGhanaGreeceGuatemalaGuyanaHaitiHondurasHong KongHungaryIndiaIndonesiaIranIraqIrelandIsraelItalyJamaicaJapanJordanKazakhstanKenyaKoreaKuwaitLaosLatin AmericaLebanonLiberiaLithuaniaMalaysiaMexicoMicronesiaMiddle AfricaMoldovaMoroccoNepalNetherlandsNicaraguaNigeriaNorthern AfricaNorthern EuropeNorwayOceaniaPakistanPanamaPeruPhilippinesPolandPortugalRomaniaRussiaSaudi ArabiaScotlandSerbiaSierra LeoneSingaporeSomaliaSouth AfricaSouth AmericaSouth Central AsiaSouth Eastern AsiaSouthern EuropeSpainSri LankaSudanSwedenSwitzerlandSyriaTaiwanThailandTrinidad and TobagoTurkeyUgandaUkraineUruguayUzbekistanVenezuelaVietnamWestern AfricaWestern AsiaWestern EuropeZaireZimbabwe
Immigrant Origin (Percentage)
AfghanistanAfricaAlbaniaArgentinaArmeniaAsiaAustraliaAustriaBahamasBangladeshBarbadosBelarusBelgiumBelizeBoliviaBosnia and HerzegovinaBrazilBulgariaBurma / MyanmarCambodiaCameroonCanadaCaribbeanCentral AmericaChileChinaColombiaCongoCosta RicaCroatiaCubaCzechoslovakiaDenmarkDominicaDominican RepublicEastern AfricaEastern AsiaEastern EuropeEcuadorEgyptEl SalvadorEnglandEritreaEthiopiaEuropeFranceGermanyGhanaGreeceGuatemalaGuyanaHaitiHondurasHong KongHungaryIndiaIndonesiaIranIraqIrelandIsraelItalyJamaicaJapanJordanKazakhstanKenyaKoreaKuwaitLaosLatin AmericaLebanonLiberiaLithuaniaMalaysiaMexicoMicronesiaMiddle AfricaMoldovaMoroccoNepalNetherlandsNicaraguaNigeriaNorthern AfricaNorthern EuropeNorwayOceaniaPakistanPanamaPeruPhilippinesPolandPortugalRomaniaRussiaSaudi ArabiaScotlandSerbiaSierra LeoneSingaporeSomaliaSouth AfricaSouth AmericaSouth Central AsiaSouth Eastern AsiaSouthern EuropeSpainSri LankaSudanSwedenSwitzerlandSyriaTaiwanThailandTrinidad and TobagoTurkeyUgandaUkraineUruguayUzbekistanVenezuelaVietnamWestern AfricaWestern AsiaWestern EuropeZaireZimbabwe
Income
Income (Families)
Income (Households)
Poverty
Poverty (Families)
Unemployment
Employment Occupations
Employment Industries
Employer Class
Commute Time
Commute Means
School Enrollment
Education by Degree Field
Occupancy
Finances
Physical Characteristics
Phoenix
Compare Zip Codes
Comparison Subject

Map of Zip Codes with the Highest Percentage of Population Taking Public Transit to Work in Phoenix

23.5%
60.9%
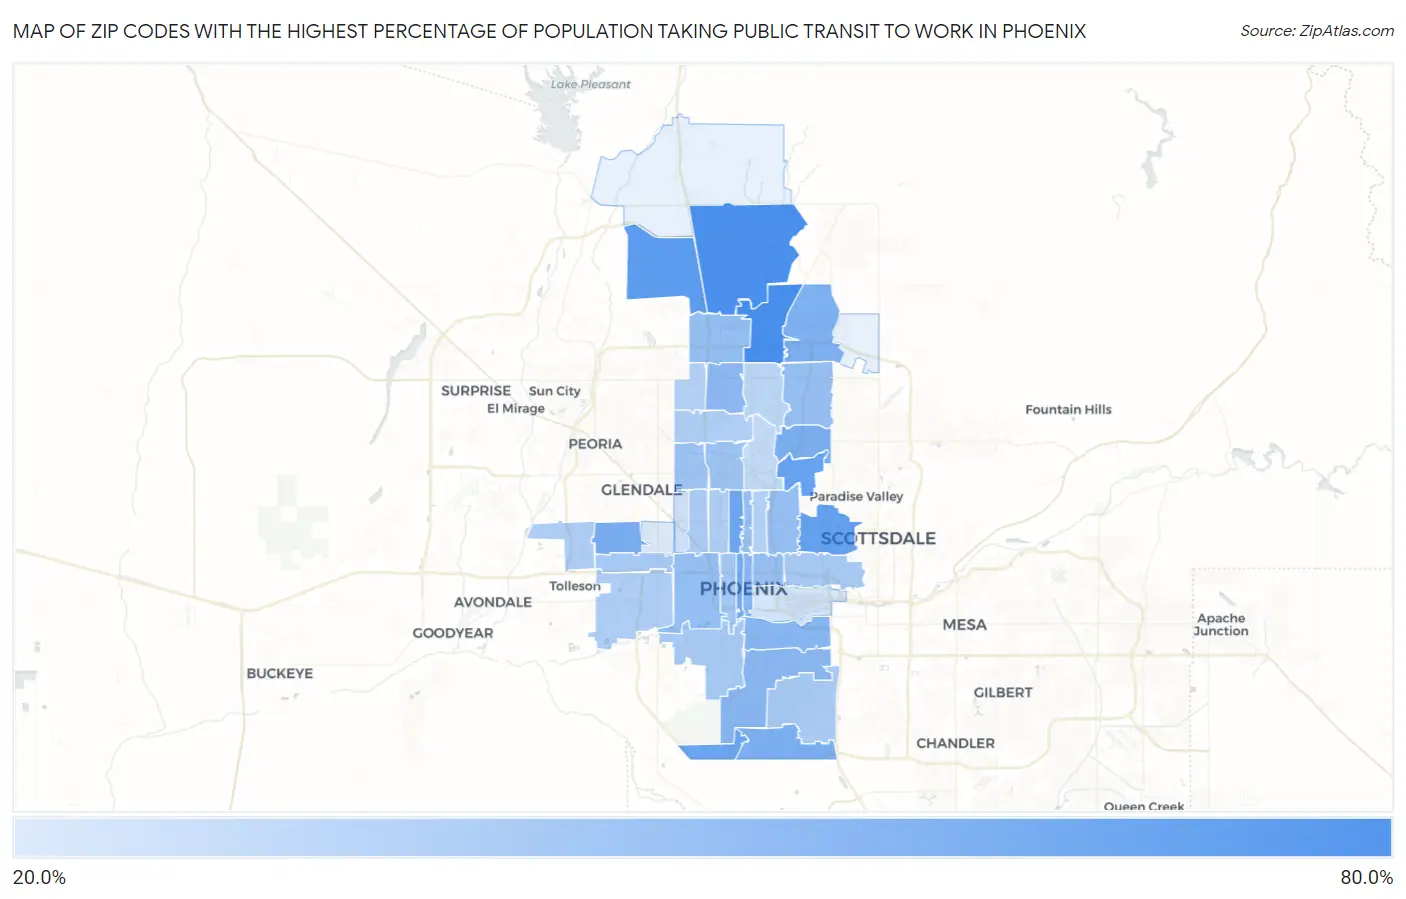
Zip Codes with the Highest Percentage of Population Taking Public Transit to Work in Phoenix Map

Zip Codes with the Highest Percentage of Population Taking Public Transit to Work in Phoenix, AZ

Zip Code % Public Transit vs State vs National
1. 85024 60.9% 37.1% (+23.8)#5 38.5% (+22.4)#228
2. 85085 60.3% 37.1% (+23.2)#8 38.5% (+21.8)#266
3. 85083 55.3% 37.1% (+18.2)#13 38.5% (+16.8)#758
4. 85018 52.8% 37.1% (+15.7)#20 38.5% (+14.3)#1,085
5. 85045 50.9% 37.1% (+13.8)#24 38.5% (+12.4)#1,359
6. 85013 50.2% 37.1% (+13.1)#28 38.5% (+11.7)#1,485
7. 85003 49.2% 37.1% (+12.1)#31 38.5% (+10.7)#1,684
8. 85033 47.2% 37.1% (+10.1)#38 38.5% (+8.70)#2,144
9. 85048 46.8% 37.1% (+9.70)#41 38.5% (+8.30)#2,251
10. 85028 46.5% 37.1% (+9.40)#43 38.5% (+8.00)#2,322
11. 85050 45.9% 37.1% (+8.80)#48 38.5% (+7.40)#2,482
12. 85040 43.5% 37.1% (+6.40)#51 38.5% (+5.00)#3,128
13. 85004 42.9% 37.1% (+5.80)#54 38.5% (+4.40)#3,301
14. 85042 42.8% 37.1% (+5.70)#55 38.5% (+4.30)#3,311
15. 85023 42.6% 37.1% (+5.50)#56 38.5% (+4.10)#3,382
16. 85009 40.3% 37.1% (+3.20)#64 38.5% (+1.80)#4,079
17. 85012 40.1% 37.1% (+3.00)#66 38.5% (+1.60)#4,197
18. 85027 39.9% 37.1% (+2.80)#67 38.5% (+1.40)#4,227
19. 85032 39.6% 37.1% (+2.50)#69 38.5% (+1.10)#4,313
20. 85016 39.4% 37.1% (+2.30)#70 38.5% (+0.900)#4,387
21. 85006 39.4% 37.1% (+2.30)#71 38.5% (+0.900)#4,393
22. 85021 37.9% 37.1% (+0.800)#76 38.5% (-0.600)#4,855
23. 85051 37.6% 37.1% (+0.500)#77 38.5% (-0.900)#4,932
24. 85007 37.0% 37.1% (-0.100)#80 38.5% (-1.50)#5,110
25. 85041 35.8% 37.1% (-1.30)#83 38.5% (-2.70)#5,434
26. 85035 35.7% 37.1% (-1.40)#84 38.5% (-2.80)#5,473
27. 85008 35.6% 37.1% (-1.50)#86 38.5% (-2.90)#5,509
28. 85044 35.1% 37.1% (-2.00)#91 38.5% (-3.40)#5,655
29. 85017 34.4% 37.1% (-2.70)#92 38.5% (-4.10)#5,851
30. 85043 33.9% 37.1% (-3.20)#94 38.5% (-4.60)#5,982
31. 85037 33.8% 37.1% (-3.30)#95 38.5% (-4.70)#5,995
32. 85015 33.6% 37.1% (-3.50)#97 38.5% (-4.90)#6,056
33. 85029 33.2% 37.1% (-3.90)#100 38.5% (-5.30)#6,167
34. 85014 32.5% 37.1% (-4.60)#106 38.5% (-6.00)#6,338
35. 85053 32.4% 37.1% (-4.70)#107 38.5% (-6.10)#6,364
36. 85022 30.7% 37.1% (-6.40)#117 38.5% (-7.80)#6,715
37. 85020 28.9% 37.1% (-8.20)#123 38.5% (-9.60)#7,050
38. 85019 26.5% 37.1% (-10.6)#126 38.5% (-12.0)#7,412
39. 85034 25.3% 37.1% (-11.8)#128 38.5% (-13.2)#7,559
40. 85031 23.5% 37.1% (-13.6)#136 38.5% (-15.0)#7,755

Common Questions

What are the Top 10 Zip Codes with the Highest Percentage of Population Taking Public Transit to Work in Phoenix, AZ?
Top 10 Zip Codes with the Highest Percentage of Population Taking Public Transit to Work in Phoenix, AZ are:
#1
60.9%
#2
60.3%
#3
55.3%
#4
52.8%
#5
50.9%
#6
50.2%
#7
49.2%
#8
47.2%
#9
46.8%
#10
46.5%
What zip code has the Highest Percentage of Population Taking Public Transit to Work in Phoenix, AZ?
85024 has the Highest Percentage of Population Taking Public Transit to Work in Phoenix, AZ with 60.9%.
What is the Percentage of Population Taking Public Transit to Work in Phoenix, AZ?
Percentage of Population Taking Public Transit to Work in Phoenix is 38.5%.
What is the Percentage of Population Taking Public Transit to Work in Arizona?
Percentage of Population Taking Public Transit to Work in Arizona is 37.1%.
What is the Percentage of Population Taking Public Transit to Work in the United States?
Percentage of Population Taking Public Transit to Work in the United States is 38.5%.