Zip Codes with the Largest Hispanic or Latino Community in Phoenix, AZ
RELATED REPORTS & OPTIONS
Hispanic or Latino
Phoenix
Compare Zip Codes
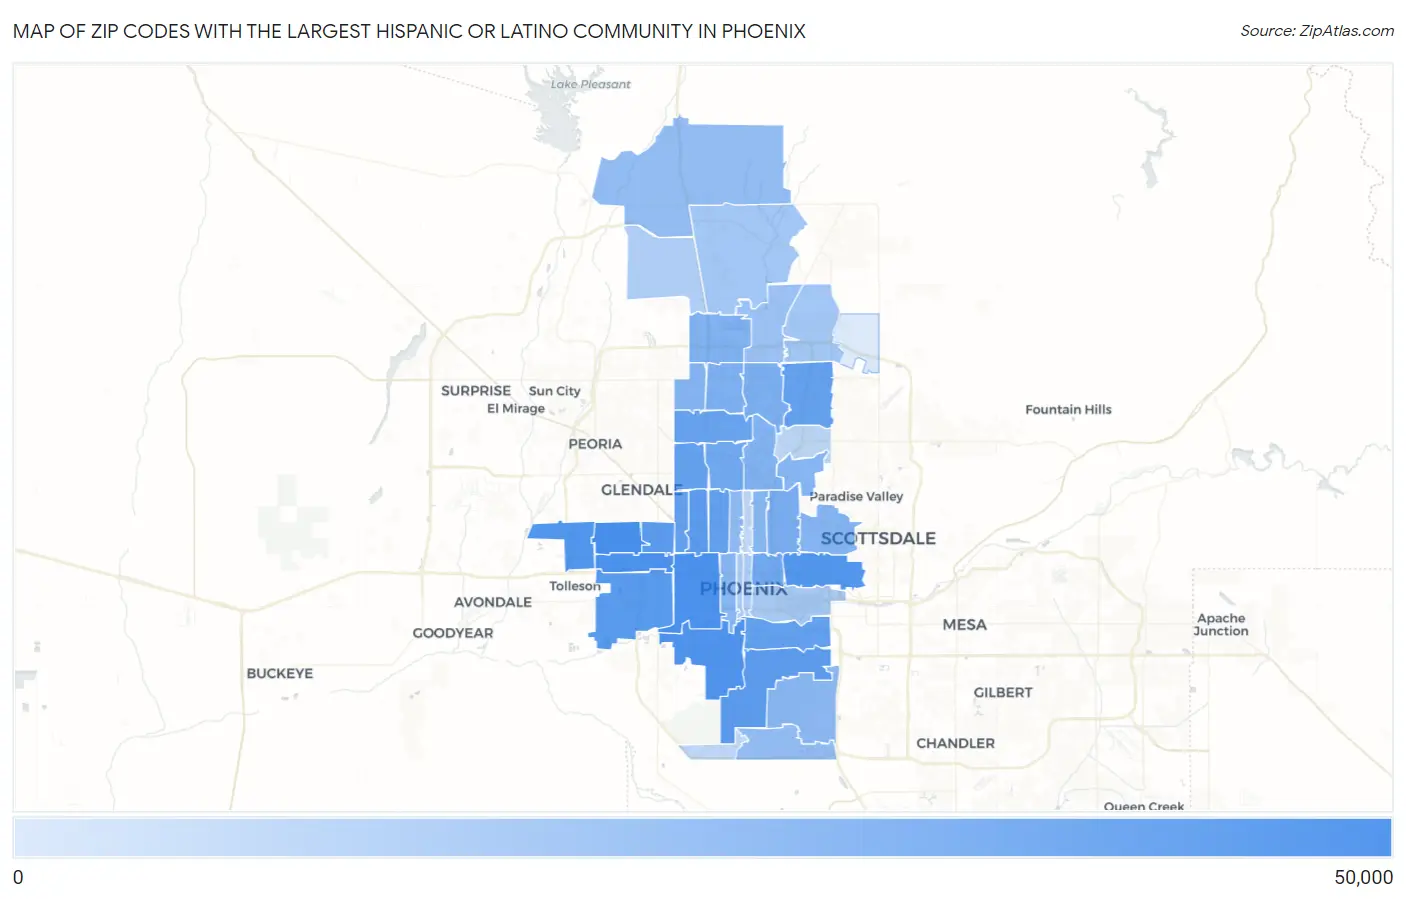
Map of Zip Codes with the Largest Hispanic or Latino Community in Phoenix
614
49,388
Zip Codes with the Largest Hispanic or Latino Community in Phoenix, AZ
| Zip Code | Hispanic or Latino | vs State | vs National | |
| 1. | 85033 | 49,388 | 2,297,513(2.15%)#2 | 61,755,866(0.08%)#96 |
| 2. | 85035 | 43,177 | 2,297,513(1.88%)#5 | 61,755,866(0.07%)#154 |
| 3. | 85009 | 42,977 | 2,297,513(1.87%)#6 | 61,755,866(0.07%)#160 |
| 4. | 85041 | 40,851 | 2,297,513(1.78%)#7 | 61,755,866(0.07%)#185 |
| 5. | 85008 | 35,861 | 2,297,513(1.56%)#10 | 61,755,866(0.06%)#263 |
| 6. | 85037 | 35,121 | 2,297,513(1.53%)#11 | 61,755,866(0.06%)#272 |
| 7. | 85043 | 31,108 | 2,297,513(1.35%)#14 | 61,755,866(0.05%)#365 |
| 8. | 85017 | 27,367 | 2,297,513(1.19%)#17 | 61,755,866(0.04%)#453 |
| 9. | 85031 | 26,047 | 2,297,513(1.13%)#19 | 61,755,866(0.04%)#491 |
| 10. | 85042 | 24,993 | 2,297,513(1.09%)#21 | 61,755,866(0.04%)#522 |
| 11. | 85040 | 21,907 | 2,297,513(0.95%)#29 | 61,755,866(0.04%)#656 |
| 12. | 85015 | 21,301 | 2,297,513(0.93%)#30 | 61,755,866(0.03%)#689 |
| 13. | 85019 | 20,130 | 2,297,513(0.88%)#32 | 61,755,866(0.03%)#732 |
| 14. | 85051 | 19,936 | 2,297,513(0.87%)#34 | 61,755,866(0.03%)#746 |
| 15. | 85032 | 19,875 | 2,297,513(0.87%)#35 | 61,755,866(0.03%)#755 |
| 16. | 85029 | 17,512 | 2,297,513(0.76%)#43 | 61,755,866(0.03%)#882 |
| 17. | 85006 | 14,457 | 2,297,513(0.63%)#49 | 61,755,866(0.02%)#1,124 |
| 18. | 85021 | 13,633 | 2,297,513(0.59%)#53 | 61,755,866(0.02%)#1,217 |
| 19. | 85016 | 11,310 | 2,297,513(0.49%)#65 | 61,755,866(0.02%)#1,495 |
| 20. | 85022 | 10,698 | 2,297,513(0.47%)#68 | 61,755,866(0.02%)#1,577 |
| 21. | 85023 | 9,593 | 2,297,513(0.42%)#76 | 61,755,866(0.02%)#1,768 |
| 22. | 85020 | 9,227 | 2,297,513(0.40%)#79 | 61,755,866(0.01%)#1,836 |
| 23. | 85027 | 8,881 | 2,297,513(0.39%)#84 | 61,755,866(0.01%)#1,912 |
| 24. | 85053 | 7,894 | 2,297,513(0.34%)#96 | 61,755,866(0.01%)#2,151 |
| 25. | 85018 | 7,876 | 2,297,513(0.34%)#97 | 61,755,866(0.01%)#2,154 |
| 26. | 85014 | 7,554 | 2,297,513(0.33%)#102 | 61,755,866(0.01%)#2,227 |
| 27. | 85007 | 7,497 | 2,297,513(0.33%)#103 | 61,755,866(0.01%)#2,251 |
| 28. | 85044 | 6,645 | 2,297,513(0.29%)#112 | 61,755,866(0.01%)#2,504 |
| 29. | 85013 | 6,116 | 2,297,513(0.27%)#115 | 61,755,866(0.01%)#2,677 |
| 30. | 85086 | 5,300 | 2,297,513(0.23%)#126 | 61,755,866(0.01%)#3,022 |
| 31. | 85048 | 5,152 | 2,297,513(0.22%)#127 | 61,755,866(0.01%)#3,093 |
| 32. | 85024 | 4,255 | 2,297,513(0.19%)#138 | 61,755,866(0.01%)#3,594 |
| 33. | 85085 | 3,406 | 2,297,513(0.15%)#152 | 61,755,866(0.01%)#4,195 |
| 34. | 85050 | 3,309 | 2,297,513(0.14%)#154 | 61,755,866(0.01%)#4,280 |
| 35. | 85034 | 2,880 | 2,297,513(0.13%)#162 | 61,755,866(0.00%)#4,689 |
| 36. | 85003 | 2,593 | 2,297,513(0.11%)#172 | 61,755,866(0.00%)#4,974 |
| 37. | 85004 | 2,489 | 2,297,513(0.11%)#175 | 61,755,866(0.00%)#5,112 |
| 38. | 85083 | 2,341 | 2,297,513(0.10%)#178 | 61,755,866(0.00%)#5,291 |
| 39. | 85028 | 1,621 | 2,297,513(0.07%)#203 | 61,755,866(0.00%)#6,493 |
| 40. | 85012 | 1,512 | 2,297,513(0.07%)#212 | 61,755,866(0.00%)#6,739 |
| 41. | 85045 | 1,491 | 2,297,513(0.06%)#215 | 61,755,866(0.00%)#6,787 |
| 42. | 85054 | 614 | 2,297,513(0.03%)#249 | 61,755,866(0.00%)#9,981 |
1
Common Questions
What are the Top 10 Zip Codes with the Largest Hispanic or Latino Community in Phoenix, AZ?
Top 10 Zip Codes with the Largest Hispanic or Latino Community in Phoenix, AZ are:
What zip code has the Largest Hispanic or Latino Community in Phoenix, AZ?
85033 has the Largest Hispanic or Latino Community in Phoenix, AZ with 49,388.
What is the Total Hispanic or Latino Population in Phoenix, AZ?
Total Hispanic or Latino Population in Phoenix is 691,205.
What is the Total Hispanic or Latino Population in Arizona?
Total Hispanic or Latino Population in Arizona is 2,297,513.
What is the Total Hispanic or Latino Population in the United States?
Total Hispanic or Latino Population in the United States is 61,755,866.