Zip Codes with the Highest Percentage of Population Employed in Mining, Quarrying, & Extraction in Phoenix, AZ
RELATED REPORTS & OPTIONS
Mining, Quarrying, & Extraction
Phoenix
Compare Zip Codes
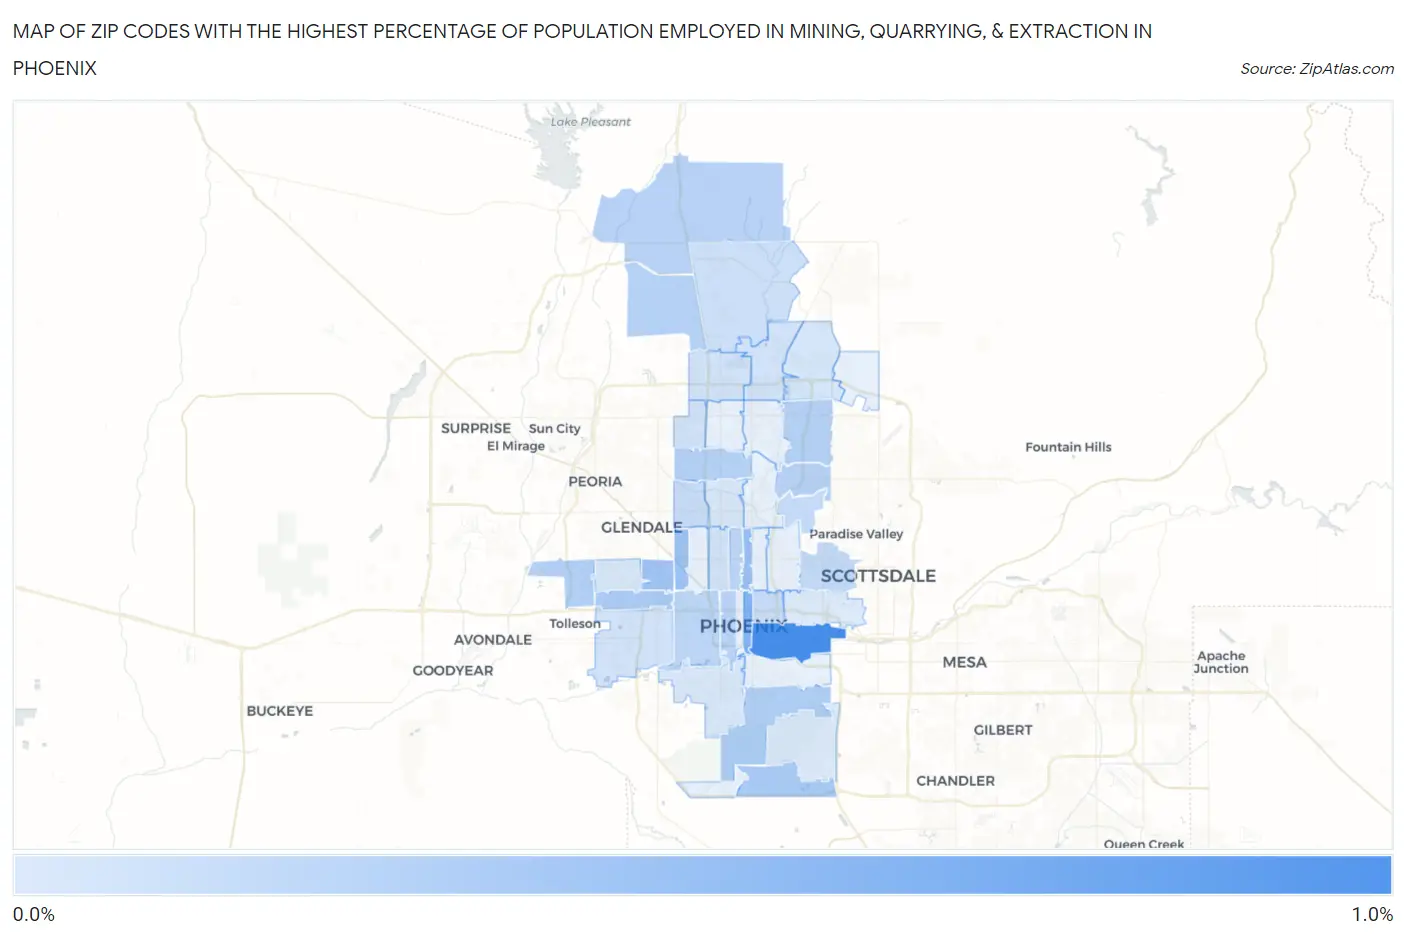
Map of Zip Codes with the Highest Percentage of Population Employed in Mining, Quarrying, & Extraction in Phoenix
0.012%
0.94%

Zip Codes with the Highest Percentage of Population Employed in Mining, Quarrying, & Extraction in Phoenix, AZ
| Zip Code | % Employed | vs State | vs National | |
| 1. | 85034 | 0.94% | 0.46%(+0.483)#82 | 0.44%(+0.504)#5,527 |
| 2. | 85004 | 0.57% | 0.46%(+0.108)#108 | 0.44%(+0.129)#6,881 |
| 3. | 85012 | 0.43% | 0.46%(-0.027)#127 | 0.44%(-0.006)#7,566 |
| 4. | 85019 | 0.42% | 0.46%(-0.045)#130 | 0.44%(-0.024)#7,675 |
| 5. | 85031 | 0.38% | 0.46%(-0.085)#135 | 0.44%(-0.064)#7,943 |
| 6. | 85048 | 0.33% | 0.46%(-0.135)#145 | 0.44%(-0.114)#8,289 |
| 7. | 85035 | 0.33% | 0.46%(-0.135)#146 | 0.44%(-0.114)#8,290 |
| 8. | 85042 | 0.29% | 0.46%(-0.173)#153 | 0.44%(-0.152)#8,613 |
| 9. | 85037 | 0.28% | 0.46%(-0.185)#154 | 0.44%(-0.164)#8,721 |
| 10. | 85032 | 0.25% | 0.46%(-0.207)#159 | 0.44%(-0.185)#8,924 |
| 11. | 85029 | 0.25% | 0.46%(-0.209)#160 | 0.44%(-0.188)#8,949 |
| 12. | 85083 | 0.25% | 0.46%(-0.213)#162 | 0.44%(-0.192)#8,988 |
| 13. | 85086 | 0.25% | 0.46%(-0.216)#163 | 0.44%(-0.195)#9,014 |
| 14. | 85028 | 0.24% | 0.46%(-0.219)#164 | 0.44%(-0.198)#9,049 |
| 15. | 85007 | 0.24% | 0.46%(-0.226)#165 | 0.44%(-0.205)#9,117 |
| 16. | 85013 | 0.22% | 0.46%(-0.245)#173 | 0.44%(-0.224)#9,340 |
| 17. | 85009 | 0.21% | 0.46%(-0.255)#178 | 0.44%(-0.234)#9,457 |
| 18. | 85018 | 0.17% | 0.46%(-0.290)#186 | 0.44%(-0.269)#9,840 |
| 19. | 85006 | 0.14% | 0.46%(-0.323)#196 | 0.44%(-0.302)#10,264 |
| 20. | 85051 | 0.14% | 0.46%(-0.326)#197 | 0.44%(-0.305)#10,293 |
| 21. | 85085 | 0.11% | 0.46%(-0.355)#211 | 0.44%(-0.334)#10,724 |
| 22. | 85015 | 0.088% | 0.46%(-0.373)#214 | 0.44%(-0.352)#10,989 |
| 23. | 85043 | 0.085% | 0.46%(-0.376)#217 | 0.44%(-0.355)#11,050 |
| 24. | 85024 | 0.078% | 0.46%(-0.383)#221 | 0.44%(-0.362)#11,183 |
| 25. | 85053 | 0.078% | 0.46%(-0.383)#222 | 0.44%(-0.362)#11,187 |
| 26. | 85027 | 0.077% | 0.46%(-0.384)#223 | 0.44%(-0.363)#11,195 |
| 27. | 85050 | 0.047% | 0.46%(-0.414)#233 | 0.44%(-0.393)#11,697 |
| 28. | 85021 | 0.042% | 0.46%(-0.419)#235 | 0.44%(-0.398)#11,760 |
| 29. | 85033 | 0.037% | 0.46%(-0.424)#237 | 0.44%(-0.403)#11,855 |
| 30. | 85041 | 0.033% | 0.46%(-0.428)#238 | 0.44%(-0.407)#11,925 |
| 31. | 85044 | 0.018% | 0.46%(-0.443)#240 | 0.44%(-0.422)#12,091 |
| 32. | 85008 | 0.012% | 0.46%(-0.450)#241 | 0.44%(-0.429)#12,128 |
1
Common Questions
What are the Top 10 Zip Codes with the Highest Percentage of Population Employed in Mining, Quarrying, & Extraction in Phoenix, AZ?
Top 10 Zip Codes with the Highest Percentage of Population Employed in Mining, Quarrying, & Extraction in Phoenix, AZ are:
What zip code has the Highest Percentage of Population Employed in Mining, Quarrying, & Extraction in Phoenix, AZ?
85034 has the Highest Percentage of Population Employed in Mining, Quarrying, & Extraction in Phoenix, AZ with 0.94%.
What is the Percentage of Population Employed in Mining, Quarrying, & Extraction in Phoenix, AZ?
Percentage of Population Employed in Mining, Quarrying, & Extraction in Phoenix is 0.15%.
What is the Percentage of Population Employed in Mining, Quarrying, & Extraction in Arizona?
Percentage of Population Employed in Mining, Quarrying, & Extraction in Arizona is 0.46%.
What is the Percentage of Population Employed in Mining, Quarrying, & Extraction in the United States?
Percentage of Population Employed in Mining, Quarrying, & Extraction in the United States is 0.44%.