Immigrants from Czechoslovakia Self-Care Disability
COMPARE
Immigrants from Czechoslovakia
Select to Compare
Self-Care Disability
Immigrants from Czechoslovakia Self-Care Disability
2.4%
SELF-CARE DISABILITY
97.7/ 100
METRIC RATING
90th/ 347
METRIC RANK
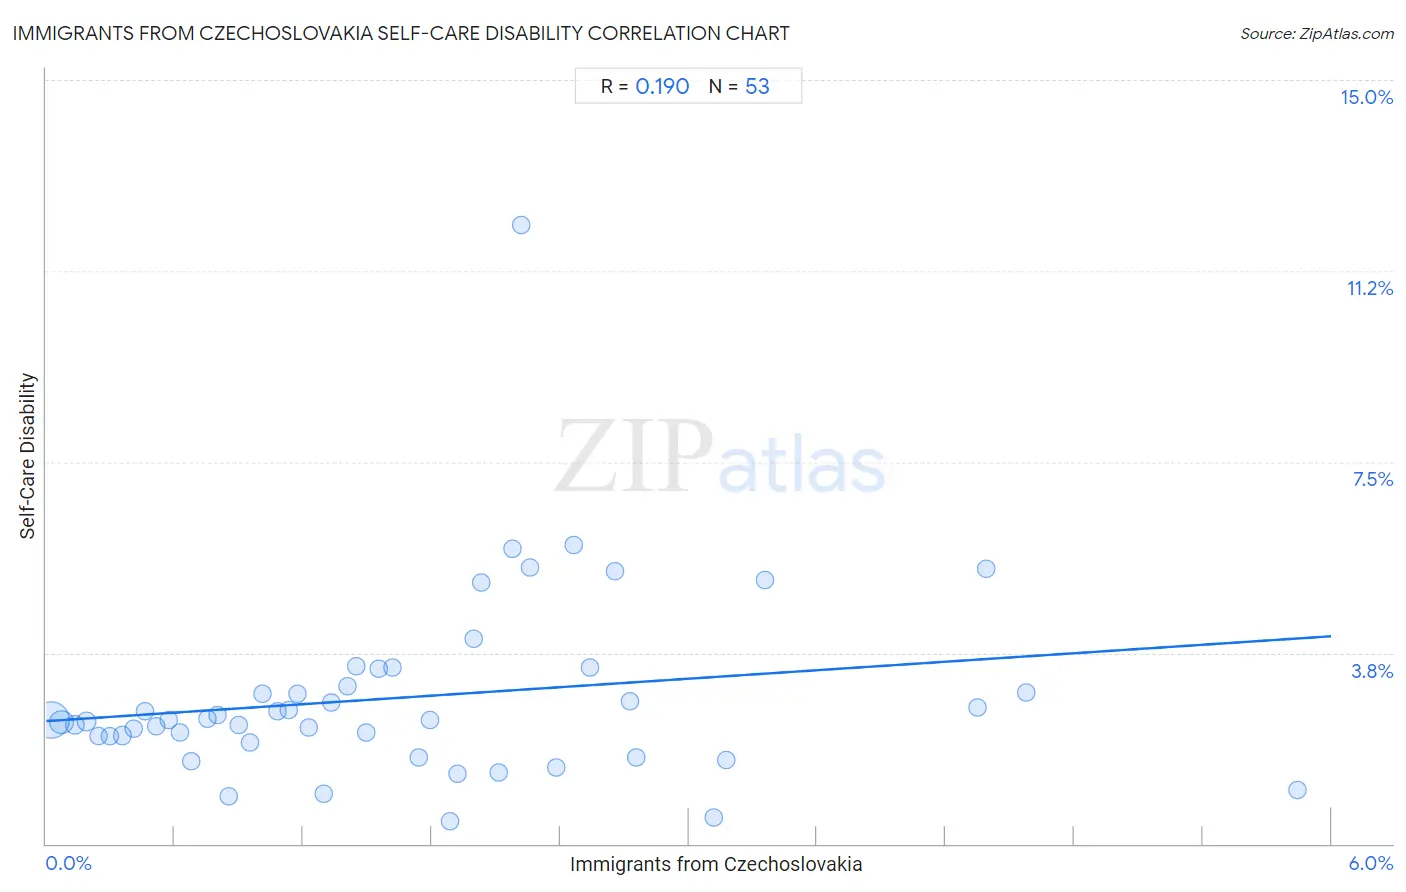
Immigrants from Czechoslovakia Self-Care Disability Correlation Chart
The statistical analysis conducted on geographies consisting of 195,412,525 people shows a poor positive correlation between the proportion of Immigrants from Czechoslovakia and percentage of population with self-care disability in the United States with a correlation coefficient (R) of 0.190 and weighted average of 2.4%. On average, for every 1% (one percent) increase in Immigrants from Czechoslovakia within a typical geography, there is an increase of 0.28% in percentage of population with self-care disability.
It is essential to understand that the correlation between the percentage of Immigrants from Czechoslovakia and percentage of population with self-care disability does not imply a direct cause-and-effect relationship. It remains uncertain whether the presence of Immigrants from Czechoslovakia influences an upward or downward trend in the level of percentage of population with self-care disability within an area, or if Immigrants from Czechoslovakia simply ended up residing in those areas with higher or lower levels of percentage of population with self-care disability due to other factors.
Demographics Similar to Immigrants from Czechoslovakia by Self-Care Disability
In terms of self-care disability, the demographic groups most similar to Immigrants from Czechoslovakia are Immigrants from Jordan (2.4%, a difference of 0.010%), Immigrants from Congo (2.4%, a difference of 0.14%), Icelander (2.4%, a difference of 0.15%), Sierra Leonean (2.4%, a difference of 0.19%), and Lithuanian (2.4%, a difference of 0.19%).
| Demographics | Rating | Rank | Self-Care Disability |
| Indians (Asian) | 98.7 /100 | #83 | Exceptional 2.3% |
| Immigrants from Spain | 98.7 /100 | #84 | Exceptional 2.3% |
| Estonians | 98.3 /100 | #85 | Exceptional 2.3% |
| Immigrants from Northern Africa | 98.2 /100 | #86 | Exceptional 2.3% |
| Sierra Leoneans | 98.0 /100 | #87 | Exceptional 2.4% |
| Lithuanians | 98.0 /100 | #88 | Exceptional 2.4% |
| Immigrants from Congo | 98.0 /100 | #89 | Exceptional 2.4% |
| Immigrants from Czechoslovakia | 97.7 /100 | #90 | Exceptional 2.4% |
| Immigrants from Jordan | 97.7 /100 | #91 | Exceptional 2.4% |
| Icelanders | 97.4 /100 | #92 | Exceptional 2.4% |
| Immigrants from Latvia | 97.0 /100 | #93 | Exceptional 2.4% |
| Macedonians | 96.9 /100 | #94 | Exceptional 2.4% |
| Immigrants from Asia | 96.9 /100 | #95 | Exceptional 2.4% |
| Immigrants from Chile | 96.7 /100 | #96 | Exceptional 2.4% |
| Swiss | 96.6 /100 | #97 | Exceptional 2.4% |
Immigrants from Czechoslovakia Self-Care Disability Correlation Summary
| Measurement | Immigrants from Czechoslovakia Data | Self-Care Disability Data |
| Minimum | 0.022% | 0.44% |
| Maximum | 5.8% | 12.1% |
| Range | 5.8% | 11.7% |
| Mean | 1.7% | 2.9% |
| Median | 1.4% | 2.4% |
| Interquartile 25% (IQ1) | 0.71% | 2.0% |
| Interquartile 75% (IQ3) | 2.3% | 3.3% |
| Interquartile Range (IQR) | 1.6% | 1.2% |
| Standard Deviation (Sample) | 1.3% | 1.8% |
| Standard Deviation (Population) | 1.2% | 1.8% |
Correlation Details
| Immigrants from Czechoslovakia Percentile | Sample Size | Self-Care Disability |
[ 0.0% - 0.5% ] 0.022% | 130,946,311 | 2.4% |
[ 0.0% - 0.5% ] 0.073% | 39,419,897 | 2.4% |
[ 0.0% - 0.5% ] 0.13% | 11,221,197 | 2.3% |
[ 0.0% - 0.5% ] 0.19% | 5,207,952 | 2.4% |
[ 0.0% - 0.5% ] 0.25% | 3,101,532 | 2.1% |
[ 0.0% - 0.5% ] 0.30% | 1,515,987 | 2.1% |
[ 0.0% - 0.5% ] 0.36% | 1,255,509 | 2.1% |
[ 0.0% - 0.5% ] 0.41% | 613,737 | 2.2% |
[ 0.0% - 0.5% ] 0.46% | 436,355 | 2.6% |
[ 0.5% - 1.0% ] 0.52% | 375,939 | 2.3% |
[ 0.5% - 1.0% ] 0.57% | 276,746 | 2.4% |
[ 0.5% - 1.0% ] 0.62% | 287,147 | 2.2% |
[ 0.5% - 1.0% ] 0.68% | 95,465 | 1.6% |
[ 0.5% - 1.0% ] 0.75% | 121,412 | 2.5% |
[ 0.5% - 1.0% ] 0.80% | 69,967 | 2.5% |
[ 0.5% - 1.0% ] 0.85% | 13,000 | 0.94% |
[ 0.5% - 1.0% ] 0.90% | 128,232 | 2.3% |
[ 0.5% - 1.0% ] 0.95% | 41,413 | 2.0% |
[ 1.0% - 1.5% ] 1.01% | 39,657 | 2.9% |
[ 1.0% - 1.5% ] 1.08% | 32,075 | 2.6% |
[ 1.0% - 1.5% ] 1.13% | 19,747 | 2.6% |
[ 1.0% - 1.5% ] 1.17% | 29,269 | 2.9% |
[ 1.0% - 1.5% ] 1.23% | 21,542 | 2.3% |
[ 1.0% - 1.5% ] 1.30% | 31,003 | 0.99% |
[ 1.0% - 1.5% ] 1.33% | 8,415 | 2.8% |
[ 1.0% - 1.5% ] 1.40% | 18,589 | 3.1% |
[ 1.0% - 1.5% ] 1.45% | 3,104 | 3.5% |
[ 1.0% - 1.5% ] 1.50% | 8,753 | 2.2% |
[ 1.5% - 2.0% ] 1.55% | 902 | 3.4% |
[ 1.5% - 2.0% ] 1.62% | 27,614 | 3.5% |
[ 1.5% - 2.0% ] 1.74% | 5,413 | 1.7% |
[ 1.5% - 2.0% ] 1.79% | 782 | 2.4% |
[ 1.5% - 2.0% ] 1.88% | 690 | 0.44% |
[ 1.5% - 2.0% ] 1.92% | 2,500 | 1.4% |
[ 1.5% - 2.0% ] 2.00% | 2,854 | 4.0% |
[ 2.0% - 2.5% ] 2.03% | 2,704 | 5.1% |
[ 2.0% - 2.5% ] 2.11% | 2,460 | 1.4% |
[ 2.0% - 2.5% ] 2.18% | 1,975 | 5.8% |
[ 2.0% - 2.5% ] 2.22% | 721 | 12.1% |
[ 2.0% - 2.5% ] 2.26% | 443 | 5.4% |
[ 2.0% - 2.5% ] 2.38% | 210 | 1.5% |
[ 2.0% - 2.5% ] 2.46% | 2,436 | 5.9% |
[ 2.5% - 3.0% ] 2.54% | 4,135 | 3.5% |
[ 2.5% - 3.0% ] 2.66% | 828 | 5.3% |
[ 2.5% - 3.0% ] 2.73% | 1,686 | 2.8% |
[ 2.5% - 3.0% ] 2.76% | 3,664 | 1.7% |
[ 3.0% - 3.5% ] 3.12% | 642 | 0.52% |
[ 3.0% - 3.5% ] 3.18% | 5,795 | 1.7% |
[ 3.0% - 3.5% ] 3.36% | 417 | 5.2% |
[ 4.0% - 4.5% ] 4.35% | 115 | 2.7% |
[ 4.0% - 4.5% ] 4.39% | 296 | 5.4% |
[ 4.5% - 5.0% ] 4.58% | 1,289 | 3.0% |
[ 5.5% - 6.0% ] 5.84% | 2,002 | 1.1% |