Immigrants from Czechoslovakia 3 or more Vehicles in Household
COMPARE
Immigrants from Czechoslovakia
Select to Compare
3 or more Vehicles in Household
Immigrants from Czechoslovakia 3 or more Vehicles in Household
18.5%
3+ VEHICLES AVAILABLE
5.9/ 100
METRIC RATING
223rd/ 347
METRIC RANK
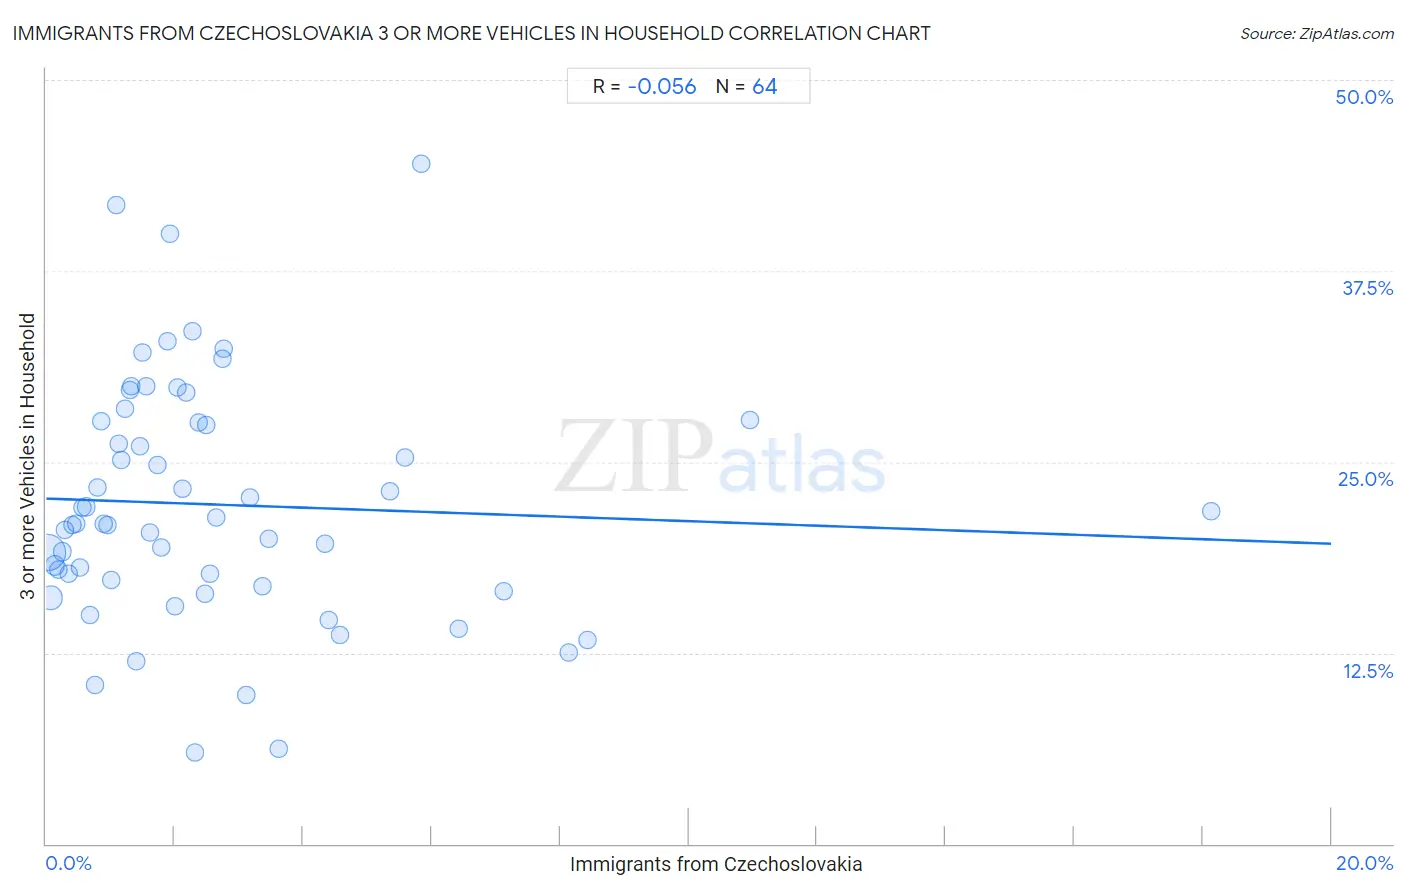
Immigrants from Czechoslovakia 3 or more Vehicles in Household Correlation Chart
The statistical analysis conducted on geographies consisting of 195,424,103 people shows a slight negative correlation between the proportion of Immigrants from Czechoslovakia and percentage of households with 3 or more vehicles available in the United States with a correlation coefficient (R) of -0.056 and weighted average of 18.5%. On average, for every 1% (one percent) increase in Immigrants from Czechoslovakia within a typical geography, there is a decrease of 0.15% in percentage of households with 3 or more vehicles available.
It is essential to understand that the correlation between the percentage of Immigrants from Czechoslovakia and percentage of households with 3 or more vehicles available does not imply a direct cause-and-effect relationship. It remains uncertain whether the presence of Immigrants from Czechoslovakia influences an upward or downward trend in the level of percentage of households with 3 or more vehicles available within an area, or if Immigrants from Czechoslovakia simply ended up residing in those areas with higher or lower levels of percentage of households with 3 or more vehicles available due to other factors.
Demographics Similar to Immigrants from Czechoslovakia by 3 or more Vehicles in Household
In terms of 3 or more vehicles in household, the demographic groups most similar to Immigrants from Czechoslovakia are Immigrants from Argentina (18.5%, a difference of 0.11%), Immigrants from Lithuania (18.5%, a difference of 0.11%), Immigrants from Hungary (18.5%, a difference of 0.15%), Immigrants from Singapore (18.4%, a difference of 0.17%), and Turkish (18.4%, a difference of 0.20%).
| Demographics | Rating | Rank | 3 or more Vehicles in Household |
| Immigrants from Nigeria | 10.3 /100 | #216 | Poor 18.7% |
| Immigrants from Italy | 10.2 /100 | #217 | Poor 18.7% |
| Immigrants from Portugal | 8.9 /100 | #218 | Tragic 18.6% |
| Immigrants from Armenia | 8.6 /100 | #219 | Tragic 18.6% |
| Nigerians | 7.9 /100 | #220 | Tragic 18.6% |
| Immigrants from Poland | 7.5 /100 | #221 | Tragic 18.6% |
| Belizeans | 7.3 /100 | #222 | Tragic 18.6% |
| Immigrants from Czechoslovakia | 5.9 /100 | #223 | Tragic 18.5% |
| Immigrants from Argentina | 5.6 /100 | #224 | Tragic 18.5% |
| Immigrants from Lithuania | 5.6 /100 | #225 | Tragic 18.5% |
| Immigrants from Hungary | 5.5 /100 | #226 | Tragic 18.5% |
| Immigrants from Singapore | 5.4 /100 | #227 | Tragic 18.4% |
| Turks | 5.4 /100 | #228 | Tragic 18.4% |
| Immigrants from Switzerland | 5.0 /100 | #229 | Tragic 18.4% |
| Immigrants from Western Asia | 4.8 /100 | #230 | Tragic 18.4% |
Immigrants from Czechoslovakia 3 or more Vehicles in Household Correlation Summary
| Measurement | Immigrants from Czechoslovakia Data | 3 or more Vehicles in Household Data |
| Minimum | 0.022% | 6.0% |
| Maximum | 18.1% | 44.5% |
| Range | 18.1% | 38.5% |
| Mean | 2.6% | 22.2% |
| Median | 1.8% | 21.0% |
| Interquartile 25% (IQ1) | 0.87% | 17.1% |
| Interquartile 75% (IQ3) | 3.1% | 27.6% |
| Interquartile Range (IQR) | 2.3% | 10.6% |
| Standard Deviation (Sample) | 3.0% | 7.9% |
| Standard Deviation (Population) | 2.9% | 7.8% |
Correlation Details
| Immigrants from Czechoslovakia Percentile | Sample Size | 3 or more Vehicles in Household |
[ 0.0% - 0.5% ] 0.022% | 130,946,311 | 19.0% |
[ 0.0% - 0.5% ] 0.073% | 39,419,897 | 16.1% |
[ 0.0% - 0.5% ] 0.13% | 11,221,197 | 18.2% |
[ 0.0% - 0.5% ] 0.19% | 5,198,264 | 17.9% |
[ 0.0% - 0.5% ] 0.25% | 3,101,532 | 19.1% |
[ 0.0% - 0.5% ] 0.30% | 1,517,285 | 20.5% |
[ 0.0% - 0.5% ] 0.36% | 1,259,098 | 17.7% |
[ 0.0% - 0.5% ] 0.41% | 613,737 | 20.9% |
[ 0.0% - 0.5% ] 0.46% | 428,614 | 21.0% |
[ 0.5% - 1.0% ] 0.52% | 375,939 | 18.1% |
[ 0.5% - 1.0% ] 0.57% | 276,746 | 22.0% |
[ 0.5% - 1.0% ] 0.62% | 287,974 | 22.1% |
[ 0.5% - 1.0% ] 0.68% | 96,067 | 14.9% |
[ 0.5% - 1.0% ] 0.75% | 127,463 | 10.4% |
[ 0.5% - 1.0% ] 0.80% | 73,297 | 23.3% |
[ 0.5% - 1.0% ] 0.85% | 13,000 | 27.7% |
[ 0.5% - 1.0% ] 0.90% | 128,232 | 21.0% |
[ 0.5% - 1.0% ] 0.95% | 41,413 | 20.9% |
[ 1.0% - 1.5% ] 1.01% | 39,657 | 17.2% |
[ 1.0% - 1.5% ] 1.08% | 32,075 | 41.8% |
[ 1.0% - 1.5% ] 1.13% | 19,747 | 26.2% |
[ 1.0% - 1.5% ] 1.17% | 28,260 | 25.1% |
[ 1.0% - 1.5% ] 1.23% | 21,542 | 28.5% |
[ 1.0% - 1.5% ] 1.30% | 31,003 | 29.7% |
[ 1.0% - 1.5% ] 1.33% | 8,415 | 30.0% |
[ 1.0% - 1.5% ] 1.40% | 19,723 | 11.9% |
[ 1.0% - 1.5% ] 1.45% | 3,104 | 26.0% |
[ 1.0% - 1.5% ] 1.50% | 10,027 | 32.2% |
[ 1.5% - 2.0% ] 1.55% | 902 | 30.0% |
[ 1.5% - 2.0% ] 1.62% | 27,614 | 20.4% |
[ 1.5% - 2.0% ] 1.74% | 5,413 | 24.8% |
[ 1.5% - 2.0% ] 1.79% | 782 | 19.4% |
[ 1.5% - 2.0% ] 1.89% | 1,689 | 32.9% |
[ 1.5% - 2.0% ] 1.94% | 5,064 | 40.0% |
[ 1.5% - 2.0% ] 2.00% | 2,854 | 15.5% |
[ 2.0% - 2.5% ] 2.03% | 2,704 | 29.9% |
[ 2.0% - 2.5% ] 2.11% | 2,460 | 23.2% |
[ 2.0% - 2.5% ] 2.18% | 1,975 | 29.6% |
[ 2.0% - 2.5% ] 2.28% | 1,317 | 33.5% |
[ 2.0% - 2.5% ] 2.32% | 691 | 6.0% |
[ 2.0% - 2.5% ] 2.38% | 210 | 27.6% |
[ 2.0% - 2.5% ] 2.46% | 2,436 | 16.3% |
[ 2.0% - 2.5% ] 2.50% | 1,763 | 27.4% |
[ 2.5% - 3.0% ] 2.54% | 4,135 | 17.7% |
[ 2.5% - 3.0% ] 2.65% | 1,246 | 21.3% |
[ 2.5% - 3.0% ] 2.73% | 1,426 | 31.7% |
[ 2.5% - 3.0% ] 2.76% | 3,664 | 32.4% |
[ 3.0% - 3.5% ] 3.12% | 642 | 9.7% |
[ 3.0% - 3.5% ] 3.17% | 6,019 | 22.7% |
[ 3.0% - 3.5% ] 3.36% | 417 | 16.9% |
[ 3.0% - 3.5% ] 3.46% | 1,272 | 19.9% |
[ 3.5% - 4.0% ] 3.62% | 995 | 6.2% |
[ 4.0% - 4.5% ] 4.35% | 115 | 19.7% |
[ 4.0% - 4.5% ] 4.39% | 296 | 14.6% |
[ 4.5% - 5.0% ] 4.58% | 1,289 | 13.7% |
[ 5.0% - 5.5% ] 5.35% | 355 | 23.1% |
[ 5.5% - 6.0% ] 5.58% | 197 | 25.3% |
[ 5.5% - 6.0% ] 5.84% | 2,002 | 44.5% |
[ 6.0% - 6.5% ] 6.42% | 1,636 | 14.1% |
[ 7.0% - 7.5% ] 7.11% | 225 | 16.6% |
[ 8.0% - 8.5% ] 8.14% | 86 | 12.5% |
[ 8.0% - 8.5% ] 8.43% | 83 | 13.3% |
[ 10.5% - 11.0% ] 10.96% | 146 | 27.8% |
[ 18.0% - 18.5% ] 18.13% | 364 | 21.8% |