Immigrants from Czechoslovakia Disability Age 5 to 17

COMPARE

Immigrants from Czechoslovakia
Race
Ancestry
AfghanAfricanAlaska NativeAlaskan AthabascanAlbanianAleutAlsatianAmericanApacheArabArapahoArgentineanArmenianAssyrian/Chaldean/SyriacAustralianAustrianBahamianBangladeshiBarbadianBasqueBelgianBelizeanBermudanBhutaneseBlackfeetBolivianBrazilianBritishBritish West IndianBulgarianBurmeseCajunCambodianCanadianCape VerdeanCarpatho RusynCelticCentral AmericanCentral American IndianCherokeeCheyenneChickasawChileanChineseChippewaChoctawColombianColvilleComancheCosta RicanCreeCreekCroatianCrowCubanCypriotCzechCzechoslovakianDanishDelawareDominicanDutchDutch West IndianEastern EuropeanEcuadorianEgyptianEnglishEstonianEthiopianEuropeanFijianFilipinoFinnishFrenchFrench American IndianFrench CanadianGermanGerman RussianGhanaianGreekGuamanian/ChamorroGuatemalanGuyaneseHaitianHmongHonduranHopiHoumaHungarianIcelanderIndian (Asian)IndonesianInupiatIranianIraqiIrishIroquoisIsraeliItalianJamaicanJapaneseJordanianKenyanKiowaKoreanLaotianLatvianLebaneseLiberianLithuanianLumbeeLuxembourgerMacedonianMalaysianMalteseMarshalleseMenomineeMexicanMexican American IndianMongolianMoroccanNative HawaiianNavajoNepaleseNew ZealanderNicaraguanNigerianNorthern EuropeanNorwegianOkinawanOsageOttawaPaiutePakistaniPalestinianPanamanianParaguayanPennsylvania GermanPeruvianPimaPolishPortuguesePotawatomiPuebloPuerto RicanPuget Sound SalishRomanianRussianSalvadoranSamoanScandinavianScotch-IrishScottishSeminoleSenegaleseSerbianShoshoneSierra LeoneanSiouxSlavicSlovakSloveneSomaliSouth AfricanSouth AmericanSouth American IndianSoviet UnionSpaniardSpanishSpanish AmericanSpanish American IndianSri LankanSubsaharan AfricanSudaneseSwedishSwissSyrianTaiwaneseThaiTlingit-HaidaTohono O'OdhamTonganTrinidadian and TobagonianTsimshianTurkishU.S. Virgin IslanderUgandanUkrainianUruguayanUteVenezuelanVietnameseWelshWest IndianYakamaYaquiYugoslavianYumanYup'ikZimbabwean
Immigration
NonimmigrantsImmigrantsAfghanistanAfricaAlbaniaArgentinaArmeniaAsiaAustraliaAustriaBahamasBangladeshBarbadosBelarusBelgiumBelizeBoliviaBosnia and HerzegovinaBrazilBulgariaBurma/MyanmarCabo VerdeCambodiaCameroonCanadaCaribbeanCentral AmericaChileChinaColombiaCongoCosta RicaCroatiaCubaCzechoslovakiaDenmarkDominicaDominican RepublicEastern AfricaEastern AsiaEastern EuropeEcuadorEgyptEl SalvadorEnglandEritreaEthiopiaEuropeFijiFranceGermanyGhanaGreeceGrenadaGuatemalaGuyanaHaitiHondurasHong KongHungaryIndiaIndonesiaIranIraqIrelandIsraelItalyJamaicaJapanJordanKazakhstanKenyaKoreaKuwaitLaosLatin AmericaLatviaLebanonLiberiaLithuaniaMalaysiaMexicoMicronesiaMiddle AfricaMoldovaMoroccoNepalNetherlandsNicaraguaNigeriaNorth AmericaNorth MacedoniaNorthern AfricaNorthern EuropeNorwayOceaniaPakistanPanamaPeruPhilippinesPolandPortugalRomaniaRussiaSaudi ArabiaScotlandSenegalSerbiaSierra LeoneSingaporeSomaliaSouth AfricaSouth AmericaSouth Central AsiaSouth Eastern AsiaSouthern EuropeSpainSri LankaSt. Vincent and the GrenadinesSudanSwedenSwitzerlandSyriaTaiwanThailandTrinidad and TobagoTurkeyUgandaUkraineUruguayUzbekistanVenezuelaVietnamWest IndiesWestern AfricaWestern AsiaWestern EuropeYemenZaireZimbabweAzores
Select to Compare
Race
Ancestry
AfghanAfricanAlaska NativeAlaskan AthabascanAlbanianAleutAlsatianAmericanApacheArabArapahoArgentineanArmenianAssyrian/Chaldean/SyriacAustralianAustrianBahamianBangladeshiBarbadianBasqueBelgianBelizeanBermudanBhutaneseBlackfeetBolivianBrazilianBritishBritish West IndianBulgarianBurmeseCajunCambodianCanadianCape VerdeanCarpatho RusynCelticCentral AmericanCentral American IndianCherokeeCheyenneChickasawChileanChineseChippewaChoctawColombianColvilleComancheCosta RicanCreeCreekCroatianCrowCubanCypriotCzechCzechoslovakianDanishDelawareDominicanDutchDutch West IndianEastern EuropeanEcuadorianEgyptianEnglishEstonianEthiopianEuropeanFijianFilipinoFinnishFrenchFrench American IndianFrench CanadianGermanGerman RussianGhanaianGreekGuamanian/ChamorroGuatemalanGuyaneseHaitianHmongHonduranHopiHoumaHungarianIcelanderIndian (Asian)IndonesianInupiatIranianIraqiIrishIroquoisIsraeliItalianJamaicanJapaneseJordanianKenyanKiowaKoreanLaotianLatvianLebaneseLiberianLithuanianLumbeeLuxembourgerMacedonianMalaysianMalteseMarshalleseMenomineeMexicanMexican American IndianMongolianMoroccanNative HawaiianNavajoNepaleseNew ZealanderNicaraguanNigerianNorthern EuropeanNorwegianOkinawanOsageOttawaPaiutePakistaniPalestinianPanamanianParaguayanPennsylvania GermanPeruvianPimaPolishPortuguesePotawatomiPuebloPuerto RicanPuget Sound SalishRomanianRussianSalvadoranSamoanScandinavianScotch-IrishScottishSeminoleSenegaleseSerbianShoshoneSierra LeoneanSiouxSlavicSlovakSloveneSomaliSouth AfricanSouth AmericanSouth American IndianSoviet UnionSpaniardSpanishSpanish AmericanSpanish American IndianSri LankanSubsaharan AfricanSudaneseSwedishSwissSyrianTaiwaneseThaiTlingit-HaidaTohono O'OdhamTonganTrinidadian and TobagonianTsimshianTurkishU.S. Virgin IslanderUgandanUkrainianUruguayanUteVenezuelanVietnameseWelshWest IndianYakamaYaquiYugoslavianYumanYup'ikZimbabwean
Immigration
NonimmigrantsImmigrantsAfghanistanAfricaAlbaniaArgentinaArmeniaAsiaAustraliaAustriaBahamasBangladeshBarbadosBelarusBelgiumBelizeBoliviaBosnia and HerzegovinaBrazilBulgariaBurma/MyanmarCabo VerdeCambodiaCameroonCanadaCaribbeanCentral AmericaChileChinaColombiaCongoCosta RicaCroatiaCubaDenmarkDominicaDominican RepublicEastern AfricaEastern AsiaEastern EuropeEcuadorEgyptEl SalvadorEnglandEritreaEthiopiaEuropeFijiFranceGermanyGhanaGreeceGrenadaGuatemalaGuyanaHaitiHondurasHong KongHungaryIndiaIndonesiaIranIraqIrelandIsraelItalyJamaicaJapanJordanKazakhstanKenyaKoreaKuwaitLaosLatin AmericaLatviaLebanonLiberiaLithuaniaMalaysiaMexicoMicronesiaMiddle AfricaMoldovaMoroccoNepalNetherlandsNicaraguaNigeriaNorth AmericaNorth MacedoniaNorthern AfricaNorthern EuropeNorwayOceaniaPakistanPanamaPeruPhilippinesPolandPortugalRomaniaRussiaSaudi ArabiaScotlandSenegalSerbiaSierra LeoneSingaporeSomaliaSouth AfricaSouth AmericaSouth Central AsiaSouth Eastern AsiaSouthern EuropeSpainSri LankaSt. Vincent and the GrenadinesSudanSwedenSwitzerlandSyriaTaiwanThailandTrinidad and TobagoTurkeyUgandaUkraineUruguayUzbekistanVenezuelaVietnamWest IndiesWestern AfricaWestern AsiaWestern EuropeYemenZaireZimbabweAzores
Disability Age 5 to 17
Income
Poverty
Unemployment
Labor Participation
Family Structure
Vehicle Availability
Education Level
Disability

Immigrants from Czechoslovakia Disability Age 5 to 17
Exceptional

5.2%
DISABILITY | AGE 5 TO 17
99.7/ 100
METRIC RATING
73rd/ 347
METRIC RANK

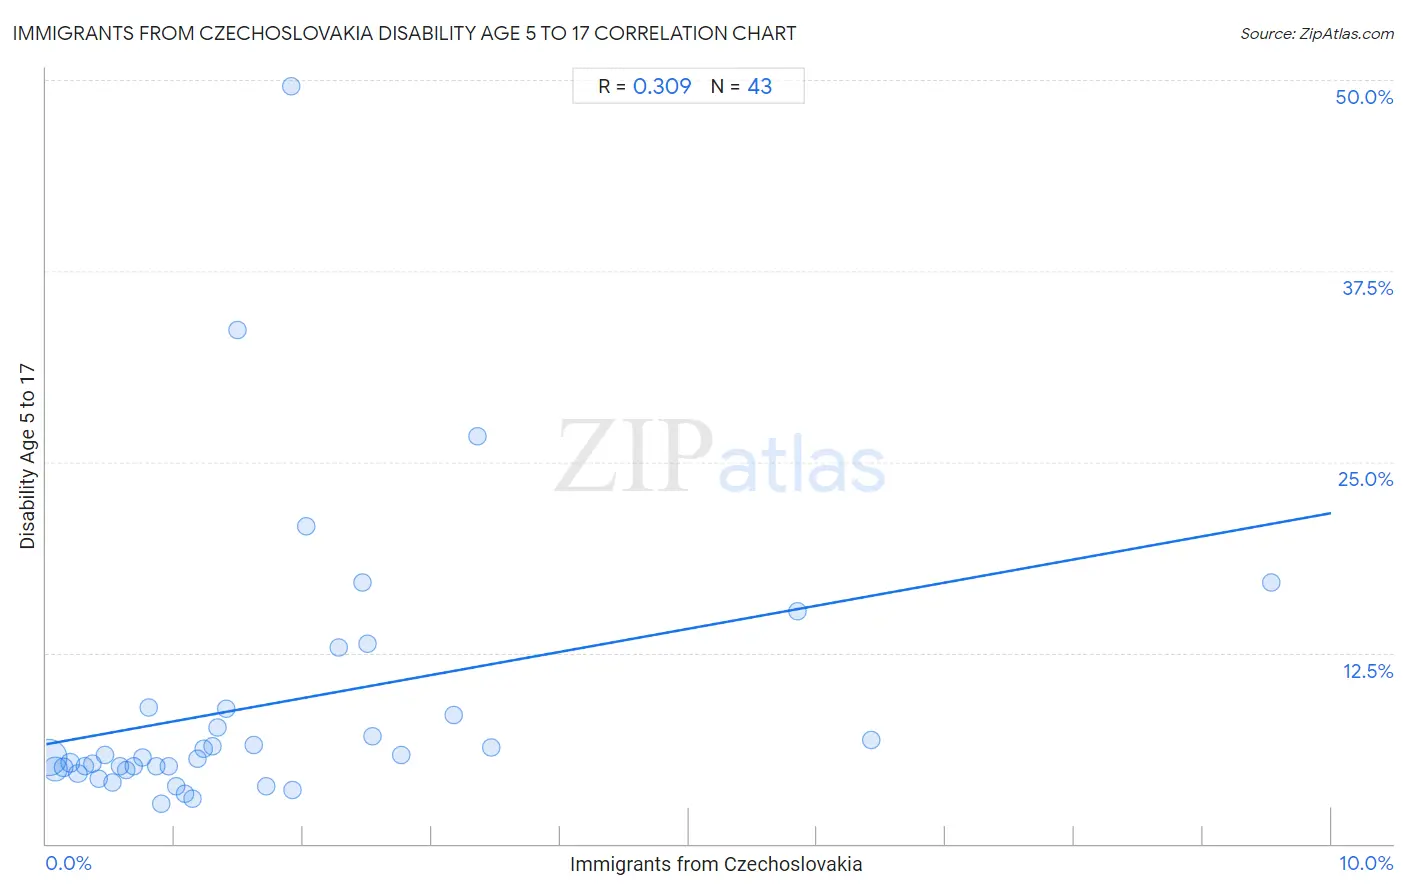
Immigrants from Czechoslovakia Disability Age 5 to 17 Correlation Chart

The statistical analysis conducted on geographies consisting of 194,293,746 people shows a mild positive correlation between the proportion of Immigrants from Czechoslovakia and percentage of population with a disability between the ages 5 and 17 in the United States with a correlation coefficient (R) of 0.309 and weighted average of 5.2%. On average, for every 1% (one percent) increase in Immigrants from Czechoslovakia within a typical geography, there is an increase of 1.5% in percentage of population with a disability between the ages 5 and 17.
Immigrants from Czechoslovakia Disability Age 5 to 17
It is essential to understand that the correlation between the percentage of Immigrants from Czechoslovakia and percentage of population with a disability between the ages 5 and 17 does not imply a direct cause-and-effect relationship. It remains uncertain whether the presence of Immigrants from Czechoslovakia influences an upward or downward trend in the level of percentage of population with a disability between the ages 5 and 17 within an area, or if Immigrants from Czechoslovakia simply ended up residing in those areas with higher or lower levels of percentage of population with a disability between the ages 5 and 17 due to other factors.

Demographics Similar to Immigrants from Czechoslovakia by Disability Age 5 to 17

In terms of disability age 5 to 17, the demographic groups most similar to Immigrants from Czechoslovakia are Immigrants from Vietnam (5.2%, a difference of 0.020%), Jordanian (5.2%, a difference of 0.050%), Immigrants from Romania (5.2%, a difference of 0.070%), Immigrants from Belgium (5.2%, a difference of 0.090%), and Guyanese (5.2%, a difference of 0.13%).
DemographicsRating | RankDisability Age 5 to 17
Palestinians
99.8
/100
|
#66
Exceptional
5.2%
Macedonians
99.8
/100
|
#67
Exceptional
5.2%
Immigrants from Syria
99.7
/100
|
#68
Exceptional
5.2%
Guyanese
99.7
/100
|
#69
Exceptional
5.2%
Immigrants from Belgium
99.7
/100
|
#70
Exceptional
5.2%
Jordanians
99.7
/100
|
#71
Exceptional
5.2%
Immigrants from Vietnam
99.7
/100
|
#72
Exceptional
5.2%
Immigrants from Czechoslovakia
99.7
/100
|
#73
Exceptional
5.2%
Immigrants from Romania
99.7
/100
|
#74
Exceptional
5.2%
Immigrants from Moldova
99.6
/100
|
#75
Exceptional
5.2%
Immigrants from Guyana
99.6
/100
|
#76
Exceptional
5.2%
Immigrants from Kazakhstan
99.6
/100
|
#77
Exceptional
5.2%
Immigrants from Cuba
99.6
/100
|
#78
Exceptional
5.2%
Afghans
99.6
/100
|
#79
Exceptional
5.2%
Sri Lankans
99.6
/100
|
#80
Exceptional
5.2%

Immigrants from Czechoslovakia Disability Age 5 to 17 Correlation Summary

MeasurementImmigrants from Czechoslovakia DataDisability Age 5 to 17 Data
Minimum0.022%2.6%
Maximum9.5%49.6%
Range9.5%47.0%
Mean1.7%9.1%
Median1.2%5.7%
Interquartile 25% (IQ1)0.57%4.9%
Interquartile 75% (IQ3)2.3%8.8%
Interquartile Range (IQR)1.7%4.0%
Standard Deviation (Sample)1.8%9.0%
Standard Deviation (Population)1.8%8.9%

Correlation Details

Immigrants from Czechoslovakia PercentileSample SizeDisability Age 5 to 17
[
0.0%
-
0.5%
]
0.022%
130,811,6925.7%
[
0.0%
-
0.5%
]
0.073%
39,211,6344.9%
[
0.0%
-
0.5%
]
0.13%
11,020,2675.0%
[
0.0%
-
0.5%
]
0.19%
5,122,4415.3%
[
0.0%
-
0.5%
]
0.25%
3,010,0414.6%
[
0.0%
-
0.5%
]
0.30%
1,466,5615.1%
[
0.0%
-
0.5%
]
0.36%
1,200,6355.2%
[
0.0%
-
0.5%
]
0.41%
561,2034.2%
[
0.0%
-
0.5%
]
0.46%
411,9065.8%
[
0.5%
-
1.0%
]
0.52%
364,8224.0%
[
0.5%
-
1.0%
]
0.57%
246,4225.1%
[
0.5%
-
1.0%
]
0.62%
241,6084.8%
[
0.5%
-
1.0%
]
0.68%
70,8475.1%
[
0.5%
-
1.0%
]
0.75%
110,9925.7%
[
0.5%
-
1.0%
]
0.80%
69,3438.9%
[
0.5%
-
1.0%
]
0.86%
5,3465.1%
[
0.5%
-
1.0%
]
0.89%
118,7052.6%
[
0.5%
-
1.0%
]
0.96%
34,9645.1%
[
1.0%
-
1.5%
]
1.01%
31,8163.8%
[
1.0%
-
1.5%
]
1.08%
30,0983.3%
[
1.0%
-
1.5%
]
1.13%
19,7473.0%
[
1.0%
-
1.5%
]
1.18%
13,2465.6%
[
1.0%
-
1.5%
]
1.23%
7,4856.3%
[
1.0%
-
1.5%
]
1.30%
31,0036.4%
[
1.0%
-
1.5%
]
1.33%
8,1127.6%
[
1.0%
-
1.5%
]
1.40%
18,5898.8%
[
1.0%
-
1.5%
]
1.49%
2,34833.6%
[
1.5%
-
2.0%
]
1.62%
23,3796.4%
[
1.5%
-
2.0%
]
1.72%
1,3413.8%
[
1.5%
-
2.0%
]
1.90%
99949.6%
[
1.5%
-
2.0%
]
1.92%
2,5003.5%
[
2.0%
-
2.5%
]
2.02%
1,33620.8%
[
2.0%
-
2.5%
]
2.28%
1,31712.9%
[
2.0%
-
2.5%
]
2.46%
2,43617.1%
[
2.0%
-
2.5%
]
2.50%
1,76313.1%
[
2.5%
-
3.0%
]
2.54%
4,1357.0%
[
2.5%
-
3.0%
]
2.76%
2,2085.8%
[
3.0%
-
3.5%
]
3.18%
4,7868.4%
[
3.0%
-
3.5%
]
3.36%
41726.7%
[
3.0%
-
3.5%
]
3.46%
1,2726.3%
[
5.5%
-
6.0%
]
5.84%
2,00215.3%
[
6.0%
-
6.5%
]
6.42%
1,6366.8%
[
9.5%
-
10.0%
]
9.54%
34617.1%