Canadian GED/Equivalency

COMPARE

Canadian
Race
Ancestry
AfghanAfricanAlaska NativeAlaskan AthabascanAlbanianAleutAlsatianAmericanApacheArabArapahoArgentineanArmenianAssyrian/Chaldean/SyriacAustralianAustrianBahamianBangladeshiBarbadianBasqueBelgianBelizeanBermudanBhutaneseBlackfeetBolivianBrazilianBritishBritish West IndianBulgarianBurmeseCajunCambodianCanadianCape VerdeanCarpatho RusynCelticCentral AmericanCentral American IndianCherokeeCheyenneChickasawChileanChineseChippewaChoctawColombianColvilleComancheCosta RicanCreeCreekCroatianCrowCubanCypriotCzechCzechoslovakianDanishDelawareDominicanDutchDutch West IndianEastern EuropeanEcuadorianEgyptianEnglishEstonianEthiopianEuropeanFijianFilipinoFinnishFrenchFrench American IndianFrench CanadianGermanGerman RussianGhanaianGreekGuamanian/ChamorroGuatemalanGuyaneseHaitianHmongHonduranHopiHoumaHungarianIcelanderIndian (Asian)IndonesianInupiatIranianIraqiIrishIroquoisIsraeliItalianJamaicanJapaneseJordanianKenyanKiowaKoreanLaotianLatvianLebaneseLiberianLithuanianLumbeeLuxembourgerMacedonianMalaysianMalteseMarshalleseMenomineeMexicanMexican American IndianMongolianMoroccanNative HawaiianNavajoNepaleseNew ZealanderNicaraguanNigerianNorthern EuropeanNorwegianOkinawanOsageOttawaPaiutePakistaniPalestinianPanamanianParaguayanPennsylvania GermanPeruvianPimaPolishPortuguesePotawatomiPuebloPuerto RicanPuget Sound SalishRomanianRussianSalvadoranSamoanScandinavianScotch-IrishScottishSeminoleSenegaleseSerbianShoshoneSierra LeoneanSiouxSlavicSlovakSloveneSomaliSouth AfricanSouth AmericanSouth American IndianSoviet UnionSpaniardSpanishSpanish AmericanSpanish American IndianSri LankanSubsaharan AfricanSudaneseSwedishSwissSyrianTaiwaneseThaiTlingit-HaidaTohono O'OdhamTonganTrinidadian and TobagonianTsimshianTurkishU.S. Virgin IslanderUgandanUkrainianUruguayanUteVenezuelanVietnameseWelshWest IndianYakamaYaquiYugoslavianYumanYup'ikZimbabwean
Immigration
NonimmigrantsImmigrantsAfghanistanAfricaAlbaniaArgentinaArmeniaAsiaAustraliaAustriaBahamasBangladeshBarbadosBelarusBelgiumBelizeBoliviaBosnia and HerzegovinaBrazilBulgariaBurma/MyanmarCabo VerdeCambodiaCameroonCanadaCaribbeanCentral AmericaChileChinaColombiaCongoCosta RicaCroatiaCubaCzechoslovakiaDenmarkDominicaDominican RepublicEastern AfricaEastern AsiaEastern EuropeEcuadorEgyptEl SalvadorEnglandEritreaEthiopiaEuropeFijiFranceGermanyGhanaGreeceGrenadaGuatemalaGuyanaHaitiHondurasHong KongHungaryIndiaIndonesiaIranIraqIrelandIsraelItalyJamaicaJapanJordanKazakhstanKenyaKoreaKuwaitLaosLatin AmericaLatviaLebanonLiberiaLithuaniaMalaysiaMexicoMicronesiaMiddle AfricaMoldovaMoroccoNepalNetherlandsNicaraguaNigeriaNorth AmericaNorth MacedoniaNorthern AfricaNorthern EuropeNorwayOceaniaPakistanPanamaPeruPhilippinesPolandPortugalRomaniaRussiaSaudi ArabiaScotlandSenegalSerbiaSierra LeoneSingaporeSomaliaSouth AfricaSouth AmericaSouth Central AsiaSouth Eastern AsiaSouthern EuropeSpainSri LankaSt. Vincent and the GrenadinesSudanSwedenSwitzerlandSyriaTaiwanThailandTrinidad and TobagoTurkeyUgandaUkraineUruguayUzbekistanVenezuelaVietnamWest IndiesWestern AfricaWestern AsiaWestern EuropeYemenZaireZimbabweAzores
Select to Compare
Race
Ancestry
AfghanAfricanAlaska NativeAlaskan AthabascanAlbanianAleutAlsatianAmericanApacheArabArapahoArgentineanArmenianAssyrian/Chaldean/SyriacAustralianAustrianBahamianBangladeshiBarbadianBasqueBelgianBelizeanBermudanBhutaneseBlackfeetBolivianBrazilianBritishBritish West IndianBulgarianBurmeseCajunCambodianCape VerdeanCarpatho RusynCelticCentral AmericanCentral American IndianCherokeeCheyenneChickasawChileanChineseChippewaChoctawColombianColvilleComancheCosta RicanCreeCreekCroatianCrowCubanCypriotCzechCzechoslovakianDanishDelawareDominicanDutchDutch West IndianEastern EuropeanEcuadorianEgyptianEnglishEstonianEthiopianEuropeanFijianFilipinoFinnishFrenchFrench American IndianFrench CanadianGermanGerman RussianGhanaianGreekGuamanian/ChamorroGuatemalanGuyaneseHaitianHmongHonduranHopiHoumaHungarianIcelanderIndian (Asian)IndonesianInupiatIranianIraqiIrishIroquoisIsraeliItalianJamaicanJapaneseJordanianKenyanKiowaKoreanLaotianLatvianLebaneseLiberianLithuanianLumbeeLuxembourgerMacedonianMalaysianMalteseMarshalleseMenomineeMexicanMexican American IndianMongolianMoroccanNative HawaiianNavajoNepaleseNew ZealanderNicaraguanNigerianNorthern EuropeanNorwegianOkinawanOsageOttawaPaiutePakistaniPalestinianPanamanianParaguayanPennsylvania GermanPeruvianPimaPolishPortuguesePotawatomiPuebloPuerto RicanPuget Sound SalishRomanianRussianSalvadoranSamoanScandinavianScotch-IrishScottishSeminoleSenegaleseSerbianShoshoneSierra LeoneanSiouxSlavicSlovakSloveneSomaliSouth AfricanSouth AmericanSouth American IndianSoviet UnionSpaniardSpanishSpanish AmericanSpanish American IndianSri LankanSubsaharan AfricanSudaneseSwedishSwissSyrianTaiwaneseThaiTlingit-HaidaTohono O'OdhamTonganTrinidadian and TobagonianTsimshianTurkishU.S. Virgin IslanderUgandanUkrainianUruguayanUteVenezuelanVietnameseWelshWest IndianYakamaYaquiYugoslavianYumanYup'ikZimbabwean
Immigration
NonimmigrantsImmigrantsAfghanistanAfricaAlbaniaArgentinaArmeniaAsiaAustraliaAustriaBahamasBangladeshBarbadosBelarusBelgiumBelizeBoliviaBosnia and HerzegovinaBrazilBulgariaBurma/MyanmarCabo VerdeCambodiaCameroonCanadaCaribbeanCentral AmericaChileChinaColombiaCongoCosta RicaCroatiaCubaCzechoslovakiaDenmarkDominicaDominican RepublicEastern AfricaEastern AsiaEastern EuropeEcuadorEgyptEl SalvadorEnglandEritreaEthiopiaEuropeFijiFranceGermanyGhanaGreeceGrenadaGuatemalaGuyanaHaitiHondurasHong KongHungaryIndiaIndonesiaIranIraqIrelandIsraelItalyJamaicaJapanJordanKazakhstanKenyaKoreaKuwaitLaosLatin AmericaLatviaLebanonLiberiaLithuaniaMalaysiaMexicoMicronesiaMiddle AfricaMoldovaMoroccoNepalNetherlandsNicaraguaNigeriaNorth AmericaNorth MacedoniaNorthern AfricaNorthern EuropeNorwayOceaniaPakistanPanamaPeruPhilippinesPolandPortugalRomaniaRussiaSaudi ArabiaScotlandSenegalSerbiaSierra LeoneSingaporeSomaliaSouth AfricaSouth AmericaSouth Central AsiaSouth Eastern AsiaSouthern EuropeSpainSri LankaSt. Vincent and the GrenadinesSudanSwedenSwitzerlandSyriaTaiwanThailandTrinidad and TobagoTurkeyUgandaUkraineUruguayUzbekistanVenezuelaVietnamWest IndiesWestern AfricaWestern AsiaWestern EuropeYemenZaireZimbabweAzores
GED/Equivalency
Income
Poverty
Unemployment
Labor Participation
Family Structure
Vehicle Availability
Education Level
Disability

Canadian GED/Equivalency
Exceptional

87.1%
GED/EQUIVALENCY
95.6/ 100
METRIC RATING
108th/ 347
METRIC RANK

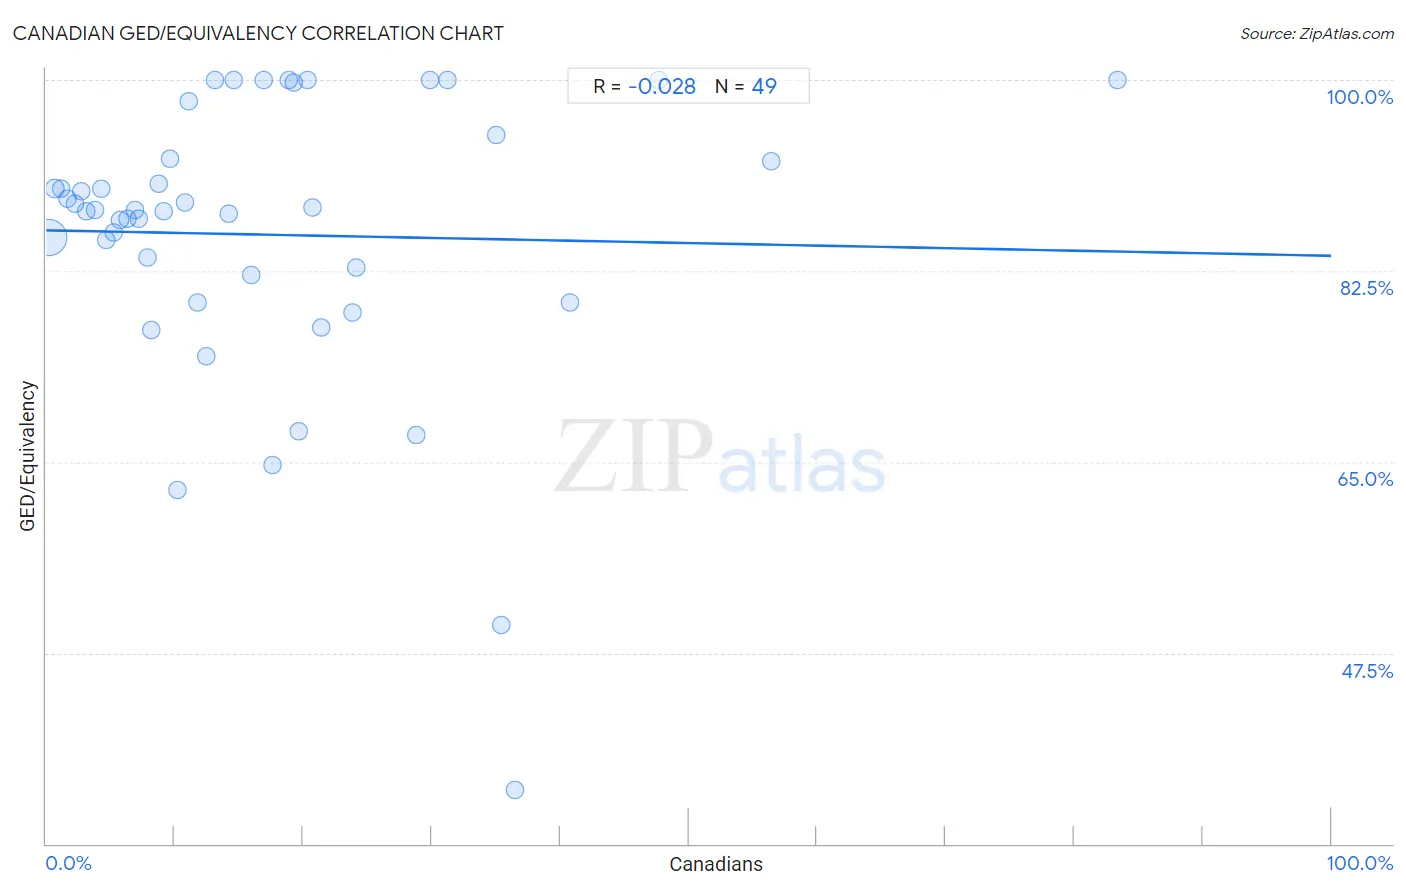
Canadian GED/Equivalency Correlation Chart

The statistical analysis conducted on geographies consisting of 437,556,595 people shows no correlation between the proportion of Canadians and percentage of population with at least ged/equivalency education in the United States with a correlation coefficient (R) of -0.028 and weighted average of 87.1%. On average, for every 1% (one percent) increase in Canadians within a typical geography, there is a decrease of 0.023% in percentage of population with at least ged/equivalency education.
Canadian GED/Equivalency
It is essential to understand that the correlation between the percentage of Canadians and percentage of population with at least ged/equivalency education does not imply a direct cause-and-effect relationship. It remains uncertain whether the presence of Canadians influences an upward or downward trend in the level of percentage of population with at least ged/equivalency education within an area, or if Canadians simply ended up residing in those areas with higher or lower levels of percentage of population with at least ged/equivalency education due to other factors.

Demographics Similar to Canadians by GED/Equivalency

In terms of ged/equivalency, the demographic groups most similar to Canadians are Immigrants from Eastern Europe (87.1%, a difference of 0.010%), Icelander (87.1%, a difference of 0.020%), Immigrants from Zimbabwe (87.1%, a difference of 0.030%), Indian (Asian) (87.1%, a difference of 0.040%), and Egyptian (87.1%, a difference of 0.040%).
DemographicsRating | RankGED/Equivalency
Syrians
96.6
/100
|
#101
Exceptional
87.2%
Lebanese
96.2
/100
|
#102
Exceptional
87.2%
Jordanians
96.1
/100
|
#103
Exceptional
87.2%
Immigrants from Hungary
96.0
/100
|
#104
Exceptional
87.2%
Indians (Asian)
95.9
/100
|
#105
Exceptional
87.1%
Immigrants from Zimbabwe
95.8
/100
|
#106
Exceptional
87.1%
Icelanders
95.7
/100
|
#107
Exceptional
87.1%
Canadians
95.6
/100
|
#108
Exceptional
87.1%
Immigrants from Eastern Europe
95.5
/100
|
#109
Exceptional
87.1%
Egyptians
95.3
/100
|
#110
Exceptional
87.1%
French
95.2
/100
|
#111
Exceptional
87.1%
Tlingit-Haida
94.8
/100
|
#112
Exceptional
87.0%
Assyrians/Chaldeans/Syriacs
94.8
/100
|
#113
Exceptional
87.0%
Immigrants from Kazakhstan
94.7
/100
|
#114
Exceptional
87.0%
Mongolians
94.6
/100
|
#115
Exceptional
87.0%

Canadian GED/Equivalency Correlation Summary

MeasurementCanadian DataGED/Equivalency Data
Minimum0.16%34.9%
Maximum83.3%100.0%
Range83.2%65.1%
Mean17.2%85.8%
Median12.5%88.1%
Interquartile 25% (IQ1)6.1%80.9%
Interquartile 75% (IQ3)22.6%93.9%
Interquartile Range (IQR)16.6%13.0%
Standard Deviation (Sample)16.1%13.3%
Standard Deviation (Population)15.9%13.1%

Correlation Details

Canadian PercentileSample SizeGED/Equivalency
[
0.0%
-
0.5%
]
0.16%
393,662,88685.5%
[
0.5%
-
1.0%
]
0.67%
34,608,10090.0%
[
1.0%
-
1.5%
]
1.19%
5,677,97790.1%
[
1.5%
-
2.0%
]
1.68%
2,008,89289.1%
[
2.0%
-
2.5%
]
2.24%
731,88288.6%
[
2.5%
-
3.0%
]
2.76%
277,47789.8%
[
3.0%
-
3.5%
]
3.16%
178,42887.9%
[
3.5%
-
4.0%
]
3.79%
144,72888.1%
[
4.0%
-
4.5%
]
4.29%
61,88090.0%
[
4.5%
-
5.0%
]
4.68%
61,24985.4%
[
5.0%
-
5.5%
]
5.28%
13,89286.1%
[
5.5%
-
6.0%
]
5.78%
21,18087.2%
[
6.0%
-
6.5%
]
6.33%
41,35487.3%
[
6.5%
-
7.0%
]
6.89%
8,79488.1%
[
7.0%
-
7.5%
]
7.19%
12,12187.3%
[
7.5%
-
8.0%
]
7.87%
2,64283.7%
[
8.0%
-
8.5%
]
8.20%
4,57577.1%
[
8.5%
-
9.0%
]
8.72%
12,76590.5%
[
9.0%
-
9.5%
]
9.11%
3,47888.0%
[
9.5%
-
10.0%
]
9.67%
5,16892.8%
[
10.0%
-
10.5%
]
10.26%
1,18962.4%
[
10.5%
-
11.0%
]
10.81%
2,21188.7%
[
11.0%
-
11.5%
]
11.06%
85998.1%
[
11.5%
-
12.0%
]
11.73%
3,58979.6%
[
12.0%
-
12.5%
]
12.46%
2,56074.7%
[
13.0%
-
13.5%
]
13.13%
99100.0%
[
14.0%
-
14.5%
]
14.22%
1,70287.8%
[
14.5%
-
15.0%
]
14.63%
82100.0%
[
15.5%
-
16.0%
]
15.91%
2,03782.2%
[
16.5%
-
17.0%
]
16.90%
71100.0%
[
17.5%
-
18.0%
]
17.65%
1764.7%
[
18.5%
-
19.0%
]
18.89%
180100.0%
[
19.0%
-
19.5%
]
19.24%
44799.8%
[
19.5%
-
20.0%
]
19.67%
23967.8%
[
20.0%
-
20.5%
]
20.37%
108100.0%
[
20.5%
-
21.0%
]
20.73%
8288.3%
[
21.0%
-
21.5%
]
21.43%
2877.3%
[
23.5%
-
24.0%
]
23.79%
39178.7%
[
24.0%
-
24.5%
]
24.14%
2982.8%
[
28.5%
-
29.0%
]
28.77%
28567.4%
[
29.5%
-
30.0%
]
29.84%
315100.0%
[
31.0%
-
31.5%
]
31.25%
16100.0%
[
35.0%
-
35.5%
]
35.00%
2095.0%
[
35.0%
-
35.5%
]
35.42%
9650.0%
[
36.5%
-
37.0%
]
36.51%
6334.9%
[
40.5%
-
41.0%
]
40.74%
5479.6%
[
47.5%
-
48.0%
]
47.62%
105100.0%
[
56.0%
-
56.5%
]
56.39%
13392.6%
[
83.0%
-
83.5%
]
83.33%
120100.0%