Canadian Disability
COMPARE
Canadian
Select to Compare
Disability
Canadian Disability
12.4%
DISABILITY
0.4/ 100
METRIC RATING
259th/ 347
METRIC RANK
Canadian Disability Correlation Chart
The statistical analysis conducted on geographies consisting of 437,501,505 people shows a substantial positive correlation between the proportion of Canadians and percentage of population with a disability in the United States with a correlation coefficient (R) of 0.570 and weighted average of 12.4%. On average, for every 1% (one percent) increase in Canadians within a typical geography, there is an increase of 0.53% in percentage of population with a disability.
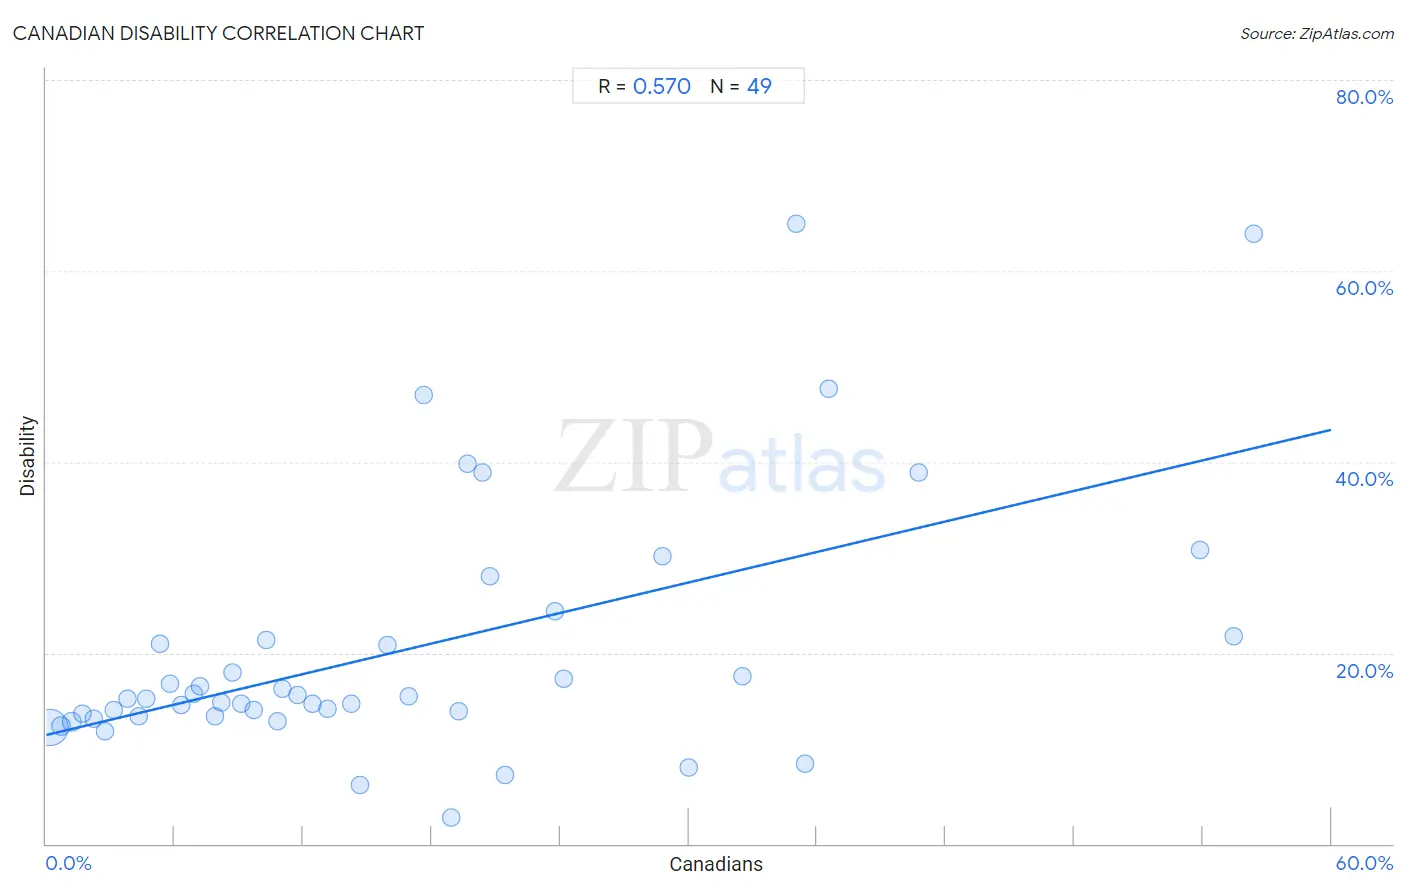
It is essential to understand that the correlation between the percentage of Canadians and percentage of population with a disability does not imply a direct cause-and-effect relationship. It remains uncertain whether the presence of Canadians influences an upward or downward trend in the level of percentage of population with a disability within an area, or if Canadians simply ended up residing in those areas with higher or lower levels of percentage of population with a disability due to other factors.
Demographics Similar to Canadians by Disability
In terms of disability, the demographic groups most similar to Canadians are Immigrants from Liberia (12.4%, a difference of 0.030%), Slavic (12.4%, a difference of 0.060%), Scandinavian (12.4%, a difference of 0.10%), Immigrants from Laos (12.4%, a difference of 0.20%), and Immigrants from Dominica (12.4%, a difference of 0.29%).
| Demographics | Rating | Rank | Disability |
| Bermudans | 1.1 /100 | #252 | Tragic 12.3% |
| Belgians | 0.8 /100 | #253 | Tragic 12.3% |
| German Russians | 0.8 /100 | #254 | Tragic 12.3% |
| Slovenes | 0.6 /100 | #255 | Tragic 12.4% |
| Immigrants from Dominica | 0.6 /100 | #256 | Tragic 12.4% |
| Immigrants from Laos | 0.5 /100 | #257 | Tragic 12.4% |
| Slavs | 0.5 /100 | #258 | Tragic 12.4% |
| Canadians | 0.4 /100 | #259 | Tragic 12.4% |
| Immigrants from Liberia | 0.4 /100 | #260 | Tragic 12.4% |
| Scandinavians | 0.4 /100 | #261 | Tragic 12.4% |
| Native Hawaiians | 0.3 /100 | #262 | Tragic 12.5% |
| Hawaiians | 0.2 /100 | #263 | Tragic 12.5% |
| Immigrants from Germany | 0.2 /100 | #264 | Tragic 12.5% |
| U.S. Virgin Islanders | 0.2 /100 | #265 | Tragic 12.5% |
| Czechoslovakians | 0.2 /100 | #266 | Tragic 12.5% |
Canadian Disability Correlation Summary
| Measurement | Canadian Data | Disability Data |
| Minimum | 0.16% | 2.8% |
| Maximum | 56.4% | 65.0% |
| Range | 56.2% | 62.2% |
| Mean | 16.8% | 20.3% |
| Median | 12.5% | 15.2% |
| Interquartile 25% (IQ1) | 6.1% | 13.4% |
| Interquartile 75% (IQ3) | 22.6% | 21.6% |
| Interquartile Range (IQR) | 16.5% | 8.2% |
| Standard Deviation (Sample) | 14.4% | 13.5% |
| Standard Deviation (Population) | 14.2% | 13.3% |
Correlation Details
| Canadian Percentile | Sample Size | Disability |
[ 0.0% - 0.5% ] 0.16% | 393,621,279 | 12.2% |
[ 0.5% - 1.0% ] 0.67% | 34,601,175 | 12.3% |
[ 1.0% - 1.5% ] 1.19% | 5,675,750 | 12.8% |
[ 1.5% - 2.0% ] 1.68% | 2,008,009 | 13.6% |
[ 2.0% - 2.5% ] 2.24% | 729,689 | 13.1% |
[ 2.5% - 3.0% ] 2.76% | 276,614 | 11.7% |
[ 3.0% - 3.5% ] 3.16% | 178,364 | 14.0% |
[ 3.5% - 4.0% ] 3.79% | 144,573 | 15.2% |
[ 4.0% - 4.5% ] 4.29% | 61,466 | 13.4% |
[ 4.5% - 5.0% ] 4.68% | 60,940 | 15.2% |
[ 5.0% - 5.5% ] 5.28% | 13,892 | 20.9% |
[ 5.5% - 6.0% ] 5.78% | 22,300 | 16.7% |
[ 6.0% - 6.5% ] 6.33% | 41,354 | 14.6% |
[ 6.5% - 7.0% ] 6.89% | 8,794 | 15.7% |
[ 7.0% - 7.5% ] 7.19% | 12,121 | 16.5% |
[ 7.5% - 8.0% ] 7.87% | 2,642 | 13.3% |
[ 8.0% - 8.5% ] 8.20% | 4,575 | 14.7% |
[ 8.5% - 9.0% ] 8.72% | 12,455 | 17.9% |
[ 9.0% - 9.5% ] 9.11% | 3,478 | 14.7% |
[ 9.5% - 10.0% ] 9.67% | 5,168 | 14.0% |
[ 10.0% - 10.5% ] 10.26% | 1,189 | 21.4% |
[ 10.5% - 11.0% ] 10.81% | 2,211 | 12.8% |
[ 11.0% - 11.5% ] 11.06% | 859 | 16.2% |
[ 11.5% - 12.0% ] 11.73% | 3,589 | 15.6% |
[ 12.0% - 12.5% ] 12.46% | 2,560 | 14.6% |
[ 13.0% - 13.5% ] 13.13% | 99 | 14.1% |
[ 14.0% - 14.5% ] 14.22% | 1,702 | 14.7% |
[ 14.5% - 15.0% ] 14.63% | 82 | 6.1% |
[ 15.5% - 16.0% ] 15.91% | 2,037 | 20.8% |
[ 16.5% - 17.0% ] 16.90% | 71 | 15.5% |
[ 17.5% - 18.0% ] 17.65% | 17 | 47.1% |
[ 18.5% - 19.0% ] 18.89% | 180 | 2.8% |
[ 19.0% - 19.5% ] 19.24% | 447 | 13.9% |
[ 19.5% - 20.0% ] 19.67% | 239 | 39.7% |
[ 20.0% - 20.5% ] 20.37% | 108 | 38.9% |
[ 20.5% - 21.0% ] 20.73% | 82 | 28.0% |
[ 21.0% - 21.5% ] 21.43% | 28 | 7.1% |
[ 23.5% - 24.0% ] 23.75% | 320 | 24.4% |
[ 24.0% - 24.5% ] 24.14% | 29 | 17.2% |
[ 28.5% - 29.0% ] 28.77% | 285 | 30.2% |
[ 30.0% - 30.5% ] 30.00% | 200 | 8.0% |
[ 32.0% - 32.5% ] 32.50% | 40 | 17.5% |
[ 35.0% - 35.5% ] 35.00% | 20 | 65.0% |
[ 35.0% - 35.5% ] 35.42% | 96 | 8.3% |
[ 36.5% - 37.0% ] 36.51% | 63 | 47.6% |
[ 40.5% - 41.0% ] 40.74% | 54 | 38.9% |
[ 53.5% - 54.0% ] 53.85% | 26 | 30.8% |
[ 55.0% - 55.5% ] 55.45% | 101 | 21.8% |
[ 56.0% - 56.5% ] 56.39% | 133 | 63.9% |