Canadian Self-Care Disability

COMPARE

Canadian
Race
Ancestry
AfghanAfricanAlaska NativeAlaskan AthabascanAlbanianAleutAlsatianAmericanApacheArabArapahoArgentineanArmenianAssyrian/Chaldean/SyriacAustralianAustrianBahamianBangladeshiBarbadianBasqueBelgianBelizeanBermudanBhutaneseBlackfeetBolivianBrazilianBritishBritish West IndianBulgarianBurmeseCajunCambodianCanadianCape VerdeanCarpatho RusynCelticCentral AmericanCentral American IndianCherokeeCheyenneChickasawChileanChineseChippewaChoctawColombianColvilleComancheCosta RicanCreeCreekCroatianCrowCubanCypriotCzechCzechoslovakianDanishDelawareDominicanDutchDutch West IndianEastern EuropeanEcuadorianEgyptianEnglishEstonianEthiopianEuropeanFijianFilipinoFinnishFrenchFrench American IndianFrench CanadianGermanGerman RussianGhanaianGreekGuamanian/ChamorroGuatemalanGuyaneseHaitianHmongHonduranHopiHoumaHungarianIcelanderIndian (Asian)IndonesianInupiatIranianIraqiIrishIroquoisIsraeliItalianJamaicanJapaneseJordanianKenyanKiowaKoreanLaotianLatvianLebaneseLiberianLithuanianLumbeeLuxembourgerMacedonianMalaysianMalteseMarshalleseMenomineeMexicanMexican American IndianMongolianMoroccanNative HawaiianNavajoNepaleseNew ZealanderNicaraguanNigerianNorthern EuropeanNorwegianOkinawanOsageOttawaPaiutePakistaniPalestinianPanamanianParaguayanPennsylvania GermanPeruvianPimaPolishPortuguesePotawatomiPuebloPuerto RicanPuget Sound SalishRomanianRussianSalvadoranSamoanScandinavianScotch-IrishScottishSeminoleSenegaleseSerbianShoshoneSierra LeoneanSiouxSlavicSlovakSloveneSomaliSouth AfricanSouth AmericanSouth American IndianSoviet UnionSpaniardSpanishSpanish AmericanSpanish American IndianSri LankanSubsaharan AfricanSudaneseSwedishSwissSyrianTaiwaneseThaiTlingit-HaidaTohono O'OdhamTonganTrinidadian and TobagonianTsimshianTurkishU.S. Virgin IslanderUgandanUkrainianUruguayanUteVenezuelanVietnameseWelshWest IndianYakamaYaquiYugoslavianYumanYup'ikZimbabwean
Immigration
NonimmigrantsImmigrantsAfghanistanAfricaAlbaniaArgentinaArmeniaAsiaAustraliaAustriaBahamasBangladeshBarbadosBelarusBelgiumBelizeBoliviaBosnia and HerzegovinaBrazilBulgariaBurma/MyanmarCabo VerdeCambodiaCameroonCanadaCaribbeanCentral AmericaChileChinaColombiaCongoCosta RicaCroatiaCubaCzechoslovakiaDenmarkDominicaDominican RepublicEastern AfricaEastern AsiaEastern EuropeEcuadorEgyptEl SalvadorEnglandEritreaEthiopiaEuropeFijiFranceGermanyGhanaGreeceGrenadaGuatemalaGuyanaHaitiHondurasHong KongHungaryIndiaIndonesiaIranIraqIrelandIsraelItalyJamaicaJapanJordanKazakhstanKenyaKoreaKuwaitLaosLatin AmericaLatviaLebanonLiberiaLithuaniaMalaysiaMexicoMicronesiaMiddle AfricaMoldovaMoroccoNepalNetherlandsNicaraguaNigeriaNorth AmericaNorth MacedoniaNorthern AfricaNorthern EuropeNorwayOceaniaPakistanPanamaPeruPhilippinesPolandPortugalRomaniaRussiaSaudi ArabiaScotlandSenegalSerbiaSierra LeoneSingaporeSomaliaSouth AfricaSouth AmericaSouth Central AsiaSouth Eastern AsiaSouthern EuropeSpainSri LankaSt. Vincent and the GrenadinesSudanSwedenSwitzerlandSyriaTaiwanThailandTrinidad and TobagoTurkeyUgandaUkraineUruguayUzbekistanVenezuelaVietnamWest IndiesWestern AfricaWestern AsiaWestern EuropeYemenZaireZimbabweAzores
Select to Compare
Race
Ancestry
AfghanAfricanAlaska NativeAlaskan AthabascanAlbanianAleutAlsatianAmericanApacheArabArapahoArgentineanArmenianAssyrian/Chaldean/SyriacAustralianAustrianBahamianBangladeshiBarbadianBasqueBelgianBelizeanBermudanBhutaneseBlackfeetBolivianBrazilianBritishBritish West IndianBulgarianBurmeseCajunCambodianCape VerdeanCarpatho RusynCelticCentral AmericanCentral American IndianCherokeeCheyenneChickasawChileanChineseChippewaChoctawColombianColvilleComancheCosta RicanCreeCreekCroatianCrowCubanCypriotCzechCzechoslovakianDanishDelawareDominicanDutchDutch West IndianEastern EuropeanEcuadorianEgyptianEnglishEstonianEthiopianEuropeanFijianFilipinoFinnishFrenchFrench American IndianFrench CanadianGermanGerman RussianGhanaianGreekGuamanian/ChamorroGuatemalanGuyaneseHaitianHmongHonduranHopiHoumaHungarianIcelanderIndian (Asian)IndonesianInupiatIranianIraqiIrishIroquoisIsraeliItalianJamaicanJapaneseJordanianKenyanKiowaKoreanLaotianLatvianLebaneseLiberianLithuanianLumbeeLuxembourgerMacedonianMalaysianMalteseMarshalleseMenomineeMexicanMexican American IndianMongolianMoroccanNative HawaiianNavajoNepaleseNew ZealanderNicaraguanNigerianNorthern EuropeanNorwegianOkinawanOsageOttawaPaiutePakistaniPalestinianPanamanianParaguayanPennsylvania GermanPeruvianPimaPolishPortuguesePotawatomiPuebloPuerto RicanPuget Sound SalishRomanianRussianSalvadoranSamoanScandinavianScotch-IrishScottishSeminoleSenegaleseSerbianShoshoneSierra LeoneanSiouxSlavicSlovakSloveneSomaliSouth AfricanSouth AmericanSouth American IndianSoviet UnionSpaniardSpanishSpanish AmericanSpanish American IndianSri LankanSubsaharan AfricanSudaneseSwedishSwissSyrianTaiwaneseThaiTlingit-HaidaTohono O'OdhamTonganTrinidadian and TobagonianTsimshianTurkishU.S. Virgin IslanderUgandanUkrainianUruguayanUteVenezuelanVietnameseWelshWest IndianYakamaYaquiYugoslavianYumanYup'ikZimbabwean
Immigration
NonimmigrantsImmigrantsAfghanistanAfricaAlbaniaArgentinaArmeniaAsiaAustraliaAustriaBahamasBangladeshBarbadosBelarusBelgiumBelizeBoliviaBosnia and HerzegovinaBrazilBulgariaBurma/MyanmarCabo VerdeCambodiaCameroonCanadaCaribbeanCentral AmericaChileChinaColombiaCongoCosta RicaCroatiaCubaCzechoslovakiaDenmarkDominicaDominican RepublicEastern AfricaEastern AsiaEastern EuropeEcuadorEgyptEl SalvadorEnglandEritreaEthiopiaEuropeFijiFranceGermanyGhanaGreeceGrenadaGuatemalaGuyanaHaitiHondurasHong KongHungaryIndiaIndonesiaIranIraqIrelandIsraelItalyJamaicaJapanJordanKazakhstanKenyaKoreaKuwaitLaosLatin AmericaLatviaLebanonLiberiaLithuaniaMalaysiaMexicoMicronesiaMiddle AfricaMoldovaMoroccoNepalNetherlandsNicaraguaNigeriaNorth AmericaNorth MacedoniaNorthern AfricaNorthern EuropeNorwayOceaniaPakistanPanamaPeruPhilippinesPolandPortugalRomaniaRussiaSaudi ArabiaScotlandSenegalSerbiaSierra LeoneSingaporeSomaliaSouth AfricaSouth AmericaSouth Central AsiaSouth Eastern AsiaSouthern EuropeSpainSri LankaSt. Vincent and the GrenadinesSudanSwedenSwitzerlandSyriaTaiwanThailandTrinidad and TobagoTurkeyUgandaUkraineUruguayUzbekistanVenezuelaVietnamWest IndiesWestern AfricaWestern AsiaWestern EuropeYemenZaireZimbabweAzores
Self-Care Disability
Income
Poverty
Unemployment
Labor Participation
Family Structure
Vehicle Availability
Education Level
Disability

Canadian Self-Care Disability
Average

2.5%
SELF-CARE DISABILITY
58.8/ 100
METRIC RATING
166th/ 347
METRIC RANK

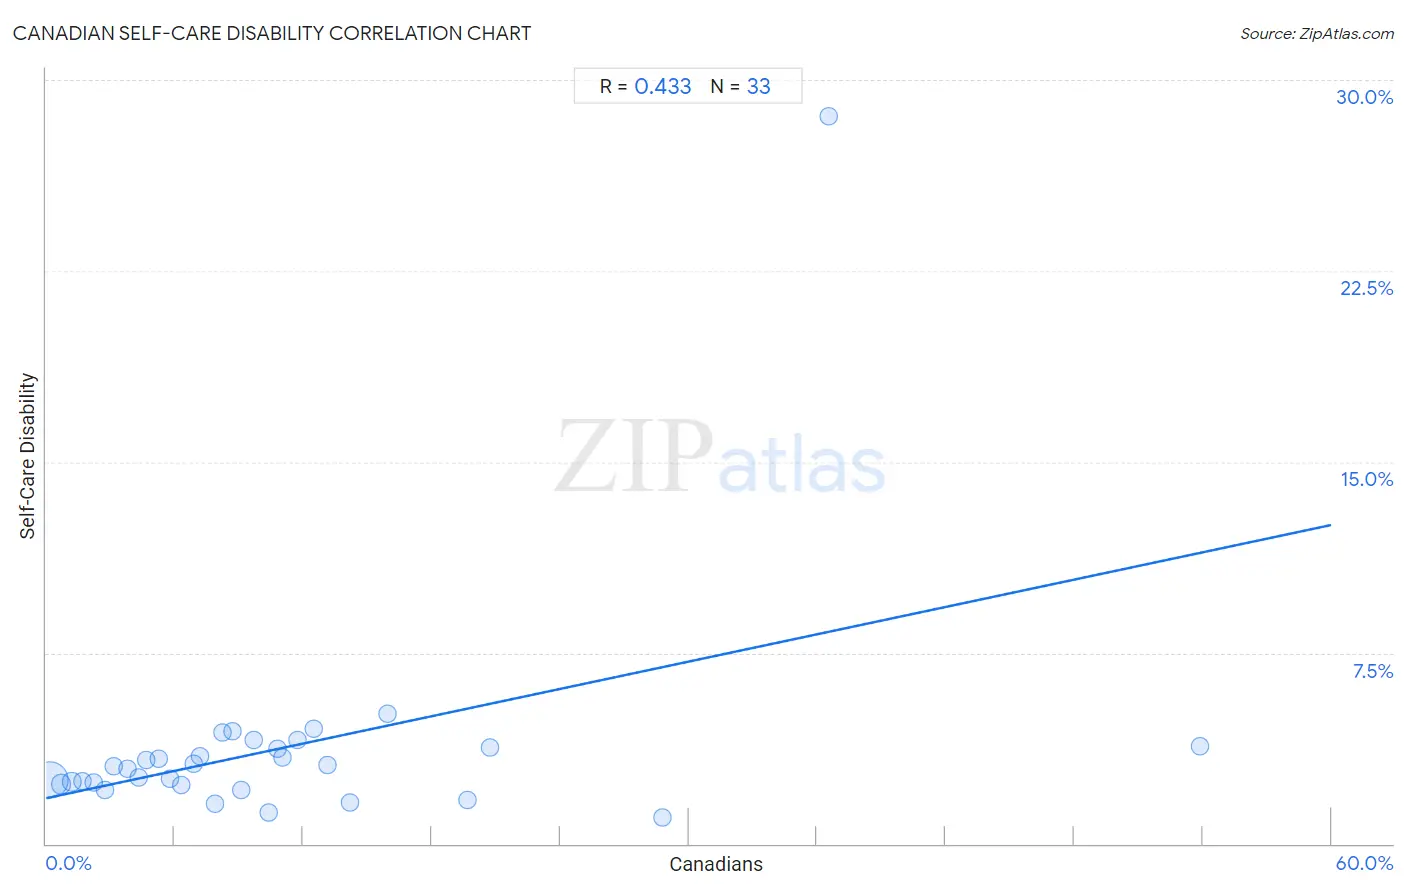
Canadian Self-Care Disability Correlation Chart

The statistical analysis conducted on geographies consisting of 436,894,568 people shows a moderate positive correlation between the proportion of Canadians and percentage of population with self-care disability in the United States with a correlation coefficient (R) of 0.433 and weighted average of 2.5%. On average, for every 1% (one percent) increase in Canadians within a typical geography, there is an increase of 0.18% in percentage of population with self-care disability.
Canadian Self-Care Disability
It is essential to understand that the correlation between the percentage of Canadians and percentage of population with self-care disability does not imply a direct cause-and-effect relationship. It remains uncertain whether the presence of Canadians influences an upward or downward trend in the level of percentage of population with self-care disability within an area, or if Canadians simply ended up residing in those areas with higher or lower levels of percentage of population with self-care disability due to other factors.

Demographics Similar to Canadians by Self-Care Disability

In terms of self-care disability, the demographic groups most similar to Canadians are Syrian (2.5%, a difference of 0.010%), Immigrants from Vietnam (2.5%, a difference of 0.030%), Immigrants from Greece (2.5%, a difference of 0.070%), Ute (2.5%, a difference of 0.080%), and Immigrants from Somalia (2.5%, a difference of 0.14%).
DemographicsRating | RankSelf-Care Disability
Immigrants from Italy
68.5
/100
|
#159
Good
2.4%
Finns
67.0
/100
|
#160
Good
2.4%
Lebanese
66.5
/100
|
#161
Good
2.4%
Somalis
63.7
/100
|
#162
Good
2.5%
German Russians
62.7
/100
|
#163
Good
2.5%
Immigrants from Vietnam
59.3
/100
|
#164
Average
2.5%
Syrians
59.0
/100
|
#165
Average
2.5%
Canadians
58.8
/100
|
#166
Average
2.5%
Immigrants from Greece
57.3
/100
|
#167
Average
2.5%
Ute
57.1
/100
|
#168
Average
2.5%
Immigrants from Somalia
55.9
/100
|
#169
Average
2.5%
Scottish
54.3
/100
|
#170
Average
2.5%
Pennsylvania Germans
53.5
/100
|
#171
Average
2.5%
Czechoslovakians
53.5
/100
|
#172
Average
2.5%
Immigrants from Burma/Myanmar
52.8
/100
|
#173
Average
2.5%

Canadian Self-Care Disability Correlation Summary

MeasurementCanadian DataSelf-Care Disability Data
Minimum0.16%1.1%
Maximum53.8%28.6%
Range53.7%27.5%
Mean10.9%3.7%
Median8.2%3.0%
Interquartile 25% (IQ1)4.0%2.3%
Interquartile 75% (IQ3)12.8%3.8%
Interquartile Range (IQR)8.8%1.5%
Standard Deviation (Sample)11.0%4.6%
Standard Deviation (Population)10.9%4.5%

Correlation Details

Canadian PercentileSample SizeSelf-Care Disability
[
0.0%
-
0.5%
]
0.16%
393,255,9512.5%
[
0.5%
-
1.0%
]
0.67%
34,505,4582.3%
[
1.0%
-
1.5%
]
1.19%
5,629,5232.4%
[
1.5%
-
2.0%
]
1.68%
1,985,3712.5%
[
2.0%
-
2.5%
]
2.24%
712,9802.4%
[
2.5%
-
3.0%
]
2.76%
267,4542.1%
[
3.0%
-
3.5%
]
3.16%
171,4263.0%
[
3.5%
-
4.0%
]
3.80%
127,8293.0%
[
4.0%
-
4.5%
]
4.30%
56,6272.6%
[
4.5%
-
5.0%
]
4.67%
55,5223.3%
[
5.0%
-
5.5%
]
5.28%
10,9843.4%
[
5.5%
-
6.0%
]
5.79%
19,3802.5%
[
6.0%
-
6.5%
]
6.33%
41,0652.3%
[
6.5%
-
7.0%
]
6.90%
7,7003.1%
[
7.0%
-
7.5%
]
7.18%
11,2023.5%
[
7.5%
-
8.0%
]
7.87%
1,3471.6%
[
8.0%
-
8.5%
]
8.23%
3,7084.4%
[
8.5%
-
9.0%
]
8.72%
12,2484.4%
[
9.0%
-
9.5%
]
9.12%
3,0152.1%
[
9.5%
-
10.0%
]
9.66%
3,4784.1%
[
10.0%
-
10.5%
]
10.38%
5301.2%
[
10.5%
-
11.0%
]
10.80%
1,7693.7%
[
11.0%
-
11.5%
]
11.02%
6173.4%
[
11.5%
-
12.0%
]
11.73%
3,5894.1%
[
12.0%
-
12.5%
]
12.48%
1,6104.5%
[
13.0%
-
13.5%
]
13.13%
993.1%
[
14.0%
-
14.5%
]
14.18%
1,3541.6%
[
15.5%
-
16.0%
]
15.91%
2,0375.1%
[
19.5%
-
20.0%
]
19.67%
2391.7%
[
20.5%
-
21.0%
]
20.73%
823.8%
[
28.5%
-
29.0%
]
28.77%
2851.1%
[
36.5%
-
37.0%
]
36.51%
6328.6%
[
53.5%
-
54.0%
]
53.85%
263.8%