Canadian Unemployment Among Women with Children Ages 6 to 17 years

COMPARE

Canadian
Race
Ancestry
AfghanAfricanAlaska NativeAlaskan AthabascanAlbanianAleutAlsatianAmericanApacheArabArapahoArgentineanArmenianAssyrian/Chaldean/SyriacAustralianAustrianBahamianBangladeshiBarbadianBasqueBelgianBelizeanBermudanBhutaneseBlackfeetBolivianBrazilianBritishBritish West IndianBulgarianBurmeseCajunCambodianCanadianCape VerdeanCarpatho RusynCelticCentral AmericanCentral American IndianCherokeeCheyenneChickasawChileanChineseChippewaChoctawColombianColvilleComancheCosta RicanCreeCreekCroatianCrowCubanCypriotCzechCzechoslovakianDanishDelawareDominicanDutchDutch West IndianEastern EuropeanEcuadorianEgyptianEnglishEstonianEthiopianEuropeanFijianFilipinoFinnishFrenchFrench American IndianFrench CanadianGermanGerman RussianGhanaianGreekGuamanian/ChamorroGuatemalanGuyaneseHaitianHmongHonduranHopiHoumaHungarianIcelanderIndian (Asian)IndonesianInupiatIranianIraqiIrishIroquoisIsraeliItalianJamaicanJapaneseJordanianKenyanKiowaKoreanLaotianLatvianLebaneseLiberianLithuanianLumbeeLuxembourgerMacedonianMalaysianMalteseMarshalleseMenomineeMexicanMexican American IndianMongolianMoroccanNative HawaiianNavajoNepaleseNew ZealanderNicaraguanNigerianNorthern EuropeanNorwegianOkinawanOsageOttawaPaiutePakistaniPalestinianPanamanianParaguayanPennsylvania GermanPeruvianPimaPolishPortuguesePotawatomiPuebloPuerto RicanPuget Sound SalishRomanianRussianSalvadoranSamoanScandinavianScotch-IrishScottishSeminoleSenegaleseSerbianShoshoneSierra LeoneanSiouxSlavicSlovakSloveneSomaliSouth AfricanSouth AmericanSouth American IndianSoviet UnionSpaniardSpanishSpanish AmericanSpanish American IndianSri LankanSubsaharan AfricanSudaneseSwedishSwissSyrianTaiwaneseThaiTlingit-HaidaTohono O'OdhamTonganTrinidadian and TobagonianTsimshianTurkishU.S. Virgin IslanderUgandanUkrainianUruguayanUteVenezuelanVietnameseWelshWest IndianYakamaYaquiYugoslavianYumanYup'ikZimbabwean
Immigration
NonimmigrantsImmigrantsAfghanistanAfricaAlbaniaArgentinaArmeniaAsiaAustraliaAustriaBahamasBangladeshBarbadosBelarusBelgiumBelizeBoliviaBosnia and HerzegovinaBrazilBulgariaBurma/MyanmarCabo VerdeCambodiaCameroonCanadaCaribbeanCentral AmericaChileChinaColombiaCongoCosta RicaCroatiaCubaCzechoslovakiaDenmarkDominicaDominican RepublicEastern AfricaEastern AsiaEastern EuropeEcuadorEgyptEl SalvadorEnglandEritreaEthiopiaEuropeFijiFranceGermanyGhanaGreeceGrenadaGuatemalaGuyanaHaitiHondurasHong KongHungaryIndiaIndonesiaIranIraqIrelandIsraelItalyJamaicaJapanJordanKazakhstanKenyaKoreaKuwaitLaosLatin AmericaLatviaLebanonLiberiaLithuaniaMalaysiaMexicoMicronesiaMiddle AfricaMoldovaMoroccoNepalNetherlandsNicaraguaNigeriaNorth AmericaNorth MacedoniaNorthern AfricaNorthern EuropeNorwayOceaniaPakistanPanamaPeruPhilippinesPolandPortugalRomaniaRussiaSaudi ArabiaScotlandSenegalSerbiaSierra LeoneSingaporeSomaliaSouth AfricaSouth AmericaSouth Central AsiaSouth Eastern AsiaSouthern EuropeSpainSri LankaSt. Vincent and the GrenadinesSudanSwedenSwitzerlandSyriaTaiwanThailandTrinidad and TobagoTurkeyUgandaUkraineUruguayUzbekistanVenezuelaVietnamWest IndiesWestern AfricaWestern AsiaWestern EuropeYemenZaireZimbabweAzores
Select to Compare
Race
Ancestry
AfghanAfricanAlaska NativeAlaskan AthabascanAlbanianAleutAlsatianAmericanApacheArabArapahoArgentineanArmenianAssyrian/Chaldean/SyriacAustralianAustrianBahamianBangladeshiBarbadianBasqueBelgianBelizeanBermudanBhutaneseBlackfeetBolivianBrazilianBritishBritish West IndianBulgarianBurmeseCajunCambodianCape VerdeanCarpatho RusynCelticCentral AmericanCentral American IndianCherokeeCheyenneChickasawChileanChineseChippewaChoctawColombianColvilleComancheCosta RicanCreeCreekCroatianCrowCubanCypriotCzechCzechoslovakianDanishDelawareDominicanDutchDutch West IndianEastern EuropeanEcuadorianEgyptianEnglishEstonianEthiopianEuropeanFijianFilipinoFinnishFrenchFrench American IndianFrench CanadianGermanGerman RussianGhanaianGreekGuamanian/ChamorroGuatemalanGuyaneseHaitianHmongHonduranHopiHoumaHungarianIcelanderIndian (Asian)IndonesianInupiatIranianIraqiIrishIroquoisIsraeliItalianJamaicanJapaneseJordanianKenyanKiowaKoreanLaotianLatvianLebaneseLiberianLithuanianLumbeeLuxembourgerMacedonianMalaysianMalteseMarshalleseMenomineeMexicanMexican American IndianMongolianMoroccanNative HawaiianNavajoNepaleseNew ZealanderNicaraguanNigerianNorthern EuropeanNorwegianOkinawanOsageOttawaPaiutePakistaniPalestinianPanamanianParaguayanPennsylvania GermanPeruvianPimaPolishPortuguesePotawatomiPuebloPuerto RicanPuget Sound SalishRomanianRussianSalvadoranSamoanScandinavianScotch-IrishScottishSeminoleSenegaleseSerbianShoshoneSierra LeoneanSiouxSlavicSlovakSloveneSomaliSouth AfricanSouth AmericanSouth American IndianSoviet UnionSpaniardSpanishSpanish AmericanSpanish American IndianSri LankanSubsaharan AfricanSudaneseSwedishSwissSyrianTaiwaneseThaiTlingit-HaidaTohono O'OdhamTonganTrinidadian and TobagonianTsimshianTurkishU.S. Virgin IslanderUgandanUkrainianUruguayanUteVenezuelanVietnameseWelshWest IndianYakamaYaquiYugoslavianYumanYup'ikZimbabwean
Immigration
NonimmigrantsImmigrantsAfghanistanAfricaAlbaniaArgentinaArmeniaAsiaAustraliaAustriaBahamasBangladeshBarbadosBelarusBelgiumBelizeBoliviaBosnia and HerzegovinaBrazilBulgariaBurma/MyanmarCabo VerdeCambodiaCameroonCanadaCaribbeanCentral AmericaChileChinaColombiaCongoCosta RicaCroatiaCubaCzechoslovakiaDenmarkDominicaDominican RepublicEastern AfricaEastern AsiaEastern EuropeEcuadorEgyptEl SalvadorEnglandEritreaEthiopiaEuropeFijiFranceGermanyGhanaGreeceGrenadaGuatemalaGuyanaHaitiHondurasHong KongHungaryIndiaIndonesiaIranIraqIrelandIsraelItalyJamaicaJapanJordanKazakhstanKenyaKoreaKuwaitLaosLatin AmericaLatviaLebanonLiberiaLithuaniaMalaysiaMexicoMicronesiaMiddle AfricaMoldovaMoroccoNepalNetherlandsNicaraguaNigeriaNorth AmericaNorth MacedoniaNorthern AfricaNorthern EuropeNorwayOceaniaPakistanPanamaPeruPhilippinesPolandPortugalRomaniaRussiaSaudi ArabiaScotlandSenegalSerbiaSierra LeoneSingaporeSomaliaSouth AfricaSouth AmericaSouth Central AsiaSouth Eastern AsiaSouthern EuropeSpainSri LankaSt. Vincent and the GrenadinesSudanSwedenSwitzerlandSyriaTaiwanThailandTrinidad and TobagoTurkeyUgandaUkraineUruguayUzbekistanVenezuelaVietnamWest IndiesWestern AfricaWestern AsiaWestern EuropeYemenZaireZimbabweAzores
Unemployment Among Women with Children Ages 6 to 17 years
Income
Poverty
Unemployment
Labor Participation
Family Structure
Vehicle Availability
Education Level
Disability

Canadian Unemployment Among Women with Children Ages 6 to 17 years
Tragic

9.4%
UNEMPLOYMENT | WOMEN W/ CHILDREN 6 TO 17
0.8/ 100
METRIC RATING
256th/ 347
METRIC RANK

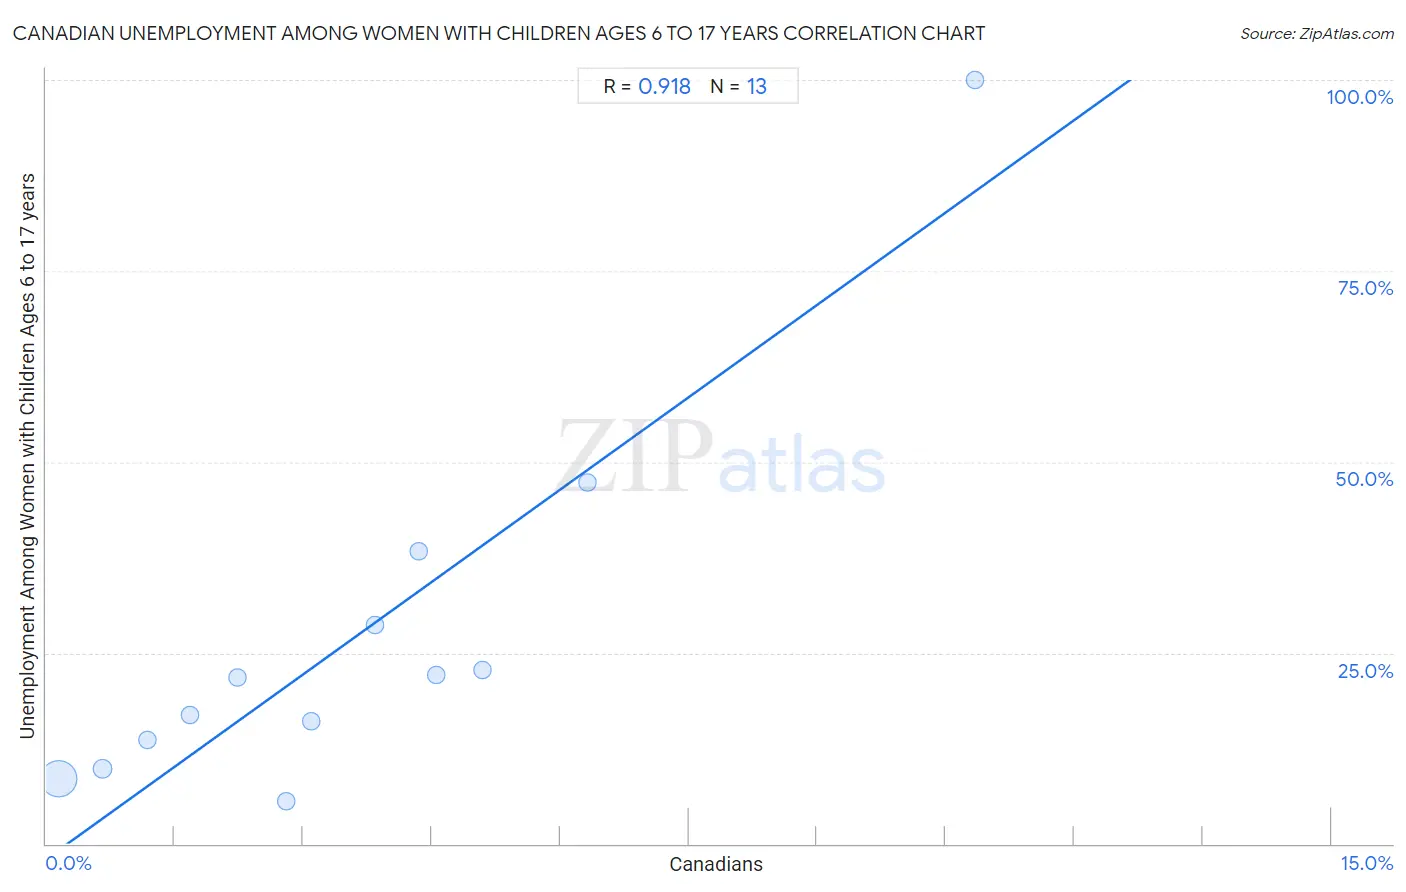
Canadian Unemployment Among Women with Children Ages 6 to 17 years Correlation Chart

The statistical analysis conducted on geographies consisting of 299,880,127 people shows a near-perfect positive correlation between the proportion of Canadians and unemployment rate among women with children between the ages 6 and 17 in the United States with a correlation coefficient (R) of 0.918 and weighted average of 9.4%. On average, for every 1% (one percent) increase in Canadians within a typical geography, there is an increase of 8.1% in unemployment rate among women with children between the ages 6 and 17.
Canadian Unemployment Among Women with Children Ages 6 to 17 years
It is essential to understand that the correlation between the percentage of Canadians and unemployment rate among women with children between the ages 6 and 17 does not imply a direct cause-and-effect relationship. It remains uncertain whether the presence of Canadians influences an upward or downward trend in the level of unemployment rate among women with children between the ages 6 and 17 within an area, or if Canadians simply ended up residing in those areas with higher or lower levels of unemployment rate among women with children between the ages 6 and 17 due to other factors.

Demographics Similar to Canadians by Unemployment Among Women with Children Ages 6 to 17 years

In terms of unemployment among women with children ages 6 to 17 years, the demographic groups most similar to Canadians are Celtic (9.5%, a difference of 0.020%), Immigrants from Mexico (9.5%, a difference of 0.11%), Lithuanian (9.4%, a difference of 0.17%), Immigrants from Central America (9.5%, a difference of 0.20%), and Nicaraguan (9.4%, a difference of 0.23%).
DemographicsRating | RankUnemployment Among Women with Children Ages 6 to 17 years
Immigrants from South America
1.5
/100
|
#249
Tragic
9.4%
Immigrants from Guatemala
1.3
/100
|
#250
Tragic
9.4%
Central Americans
1.3
/100
|
#251
Tragic
9.4%
Creek
1.2
/100
|
#252
Tragic
9.4%
Portuguese
1.1
/100
|
#253
Tragic
9.4%
Nicaraguans
1.0
/100
|
#254
Tragic
9.4%
Lithuanians
0.9
/100
|
#255
Tragic
9.4%
Canadians
0.8
/100
|
#256
Tragic
9.4%
Celtics
0.7
/100
|
#257
Tragic
9.5%
Immigrants from Mexico
0.7
/100
|
#258
Tragic
9.5%
Immigrants from Central America
0.6
/100
|
#259
Tragic
9.5%
Italians
0.6
/100
|
#260
Tragic
9.5%
South Americans
0.5
/100
|
#261
Tragic
9.5%
Senegalese
0.5
/100
|
#262
Tragic
9.5%
Lebanese
0.5
/100
|
#263
Tragic
9.5%

Canadian Unemployment Among Women with Children Ages 6 to 17 years Correlation Summary

MeasurementCanadian DataUnemployment Among Women with Children Ages 6 to 17 years Data
Minimum0.15%5.6%
Maximum10.8%100.0%
Range10.7%94.4%
Mean3.6%27.0%
Median3.1%21.8%
Interquartile 25% (IQ1)1.4%11.7%
Interquartile 75% (IQ3)4.8%33.5%
Interquartile Range (IQR)3.4%21.8%
Standard Deviation (Sample)2.8%24.9%
Standard Deviation (Population)2.7%23.9%

Correlation Details

Canadian PercentileSample SizeUnemployment Among Women with Children Ages 6 to 17 years
[
0.0%
-
0.5%
]
0.15%
279,393,2548.6%
[
0.5%
-
1.0%
]
0.66%
17,790,8389.8%
[
1.0%
-
1.5%
]
1.18%
1,719,83913.6%
[
1.5%
-
2.0%
]
1.68%
558,73016.8%
[
2.0%
-
2.5%
]
2.24%
204,47621.8%
[
2.5%
-
3.0%
]
2.80%
57,0205.6%
[
3.0%
-
3.5%
]
3.10%
47,31716.1%
[
3.5%
-
4.0%
]
3.84%
55,18428.6%
[
4.0%
-
4.5%
]
4.35%
20,97138.3%
[
4.5%
-
5.0%
]
4.55%
12,11922.2%
[
5.0%
-
5.5%
]
5.10%
2,94222.7%
[
6.0%
-
6.5%
]
6.32%
17,23447.3%
[
10.5%
-
11.0%
]
10.84%
203100.0%