Canadian 2 or more Vehicles in Household

COMPARE

Canadian
Race
Ancestry
AfghanAfricanAlaska NativeAlaskan AthabascanAlbanianAleutAlsatianAmericanApacheArabArapahoArgentineanArmenianAssyrian/Chaldean/SyriacAustralianAustrianBahamianBangladeshiBarbadianBasqueBelgianBelizeanBermudanBhutaneseBlackfeetBolivianBrazilianBritishBritish West IndianBulgarianBurmeseCajunCambodianCanadianCape VerdeanCarpatho RusynCelticCentral AmericanCentral American IndianCherokeeCheyenneChickasawChileanChineseChippewaChoctawColombianColvilleComancheCosta RicanCreeCreekCroatianCrowCubanCypriotCzechCzechoslovakianDanishDelawareDominicanDutchDutch West IndianEastern EuropeanEcuadorianEgyptianEnglishEstonianEthiopianEuropeanFijianFilipinoFinnishFrenchFrench American IndianFrench CanadianGermanGerman RussianGhanaianGreekGuamanian/ChamorroGuatemalanGuyaneseHaitianHmongHonduranHopiHoumaHungarianIcelanderIndian (Asian)IndonesianInupiatIranianIraqiIrishIroquoisIsraeliItalianJamaicanJapaneseJordanianKenyanKiowaKoreanLaotianLatvianLebaneseLiberianLithuanianLumbeeLuxembourgerMacedonianMalaysianMalteseMarshalleseMenomineeMexicanMexican American IndianMongolianMoroccanNative HawaiianNavajoNepaleseNew ZealanderNicaraguanNigerianNorthern EuropeanNorwegianOkinawanOsageOttawaPaiutePakistaniPalestinianPanamanianParaguayanPennsylvania GermanPeruvianPimaPolishPortuguesePotawatomiPuebloPuerto RicanPuget Sound SalishRomanianRussianSalvadoranSamoanScandinavianScotch-IrishScottishSeminoleSenegaleseSerbianShoshoneSierra LeoneanSiouxSlavicSlovakSloveneSomaliSouth AfricanSouth AmericanSouth American IndianSoviet UnionSpaniardSpanishSpanish AmericanSpanish American IndianSri LankanSubsaharan AfricanSudaneseSwedishSwissSyrianTaiwaneseThaiTlingit-HaidaTohono O'OdhamTonganTrinidadian and TobagonianTsimshianTurkishU.S. Virgin IslanderUgandanUkrainianUruguayanUteVenezuelanVietnameseWelshWest IndianYakamaYaquiYugoslavianYumanYup'ikZimbabwean
Immigration
NonimmigrantsImmigrantsAfghanistanAfricaAlbaniaArgentinaArmeniaAsiaAustraliaAustriaBahamasBangladeshBarbadosBelarusBelgiumBelizeBoliviaBosnia and HerzegovinaBrazilBulgariaBurma/MyanmarCabo VerdeCambodiaCameroonCanadaCaribbeanCentral AmericaChileChinaColombiaCongoCosta RicaCroatiaCubaCzechoslovakiaDenmarkDominicaDominican RepublicEastern AfricaEastern AsiaEastern EuropeEcuadorEgyptEl SalvadorEnglandEritreaEthiopiaEuropeFijiFranceGermanyGhanaGreeceGrenadaGuatemalaGuyanaHaitiHondurasHong KongHungaryIndiaIndonesiaIranIraqIrelandIsraelItalyJamaicaJapanJordanKazakhstanKenyaKoreaKuwaitLaosLatin AmericaLatviaLebanonLiberiaLithuaniaMalaysiaMexicoMicronesiaMiddle AfricaMoldovaMoroccoNepalNetherlandsNicaraguaNigeriaNorth AmericaNorth MacedoniaNorthern AfricaNorthern EuropeNorwayOceaniaPakistanPanamaPeruPhilippinesPolandPortugalRomaniaRussiaSaudi ArabiaScotlandSenegalSerbiaSierra LeoneSingaporeSomaliaSouth AfricaSouth AmericaSouth Central AsiaSouth Eastern AsiaSouthern EuropeSpainSri LankaSt. Vincent and the GrenadinesSudanSwedenSwitzerlandSyriaTaiwanThailandTrinidad and TobagoTurkeyUgandaUkraineUruguayUzbekistanVenezuelaVietnamWest IndiesWestern AfricaWestern AsiaWestern EuropeYemenZaireZimbabweAzores
Select to Compare
Race
Ancestry
AfghanAfricanAlaska NativeAlaskan AthabascanAlbanianAleutAlsatianAmericanApacheArabArapahoArgentineanArmenianAssyrian/Chaldean/SyriacAustralianAustrianBahamianBangladeshiBarbadianBasqueBelgianBelizeanBermudanBhutaneseBlackfeetBolivianBrazilianBritishBritish West IndianBulgarianBurmeseCajunCambodianCape VerdeanCarpatho RusynCelticCentral AmericanCentral American IndianCherokeeCheyenneChickasawChileanChineseChippewaChoctawColombianColvilleComancheCosta RicanCreeCreekCroatianCrowCubanCypriotCzechCzechoslovakianDanishDelawareDominicanDutchDutch West IndianEastern EuropeanEcuadorianEgyptianEnglishEstonianEthiopianEuropeanFijianFilipinoFinnishFrenchFrench American IndianFrench CanadianGermanGerman RussianGhanaianGreekGuamanian/ChamorroGuatemalanGuyaneseHaitianHmongHonduranHopiHoumaHungarianIcelanderIndian (Asian)IndonesianInupiatIranianIraqiIrishIroquoisIsraeliItalianJamaicanJapaneseJordanianKenyanKiowaKoreanLaotianLatvianLebaneseLiberianLithuanianLumbeeLuxembourgerMacedonianMalaysianMalteseMarshalleseMenomineeMexicanMexican American IndianMongolianMoroccanNative HawaiianNavajoNepaleseNew ZealanderNicaraguanNigerianNorthern EuropeanNorwegianOkinawanOsageOttawaPaiutePakistaniPalestinianPanamanianParaguayanPennsylvania GermanPeruvianPimaPolishPortuguesePotawatomiPuebloPuerto RicanPuget Sound SalishRomanianRussianSalvadoranSamoanScandinavianScotch-IrishScottishSeminoleSenegaleseSerbianShoshoneSierra LeoneanSiouxSlavicSlovakSloveneSomaliSouth AfricanSouth AmericanSouth American IndianSoviet UnionSpaniardSpanishSpanish AmericanSpanish American IndianSri LankanSubsaharan AfricanSudaneseSwedishSwissSyrianTaiwaneseThaiTlingit-HaidaTohono O'OdhamTonganTrinidadian and TobagonianTsimshianTurkishU.S. Virgin IslanderUgandanUkrainianUruguayanUteVenezuelanVietnameseWelshWest IndianYakamaYaquiYugoslavianYumanYup'ikZimbabwean
Immigration
NonimmigrantsImmigrantsAfghanistanAfricaAlbaniaArgentinaArmeniaAsiaAustraliaAustriaBahamasBangladeshBarbadosBelarusBelgiumBelizeBoliviaBosnia and HerzegovinaBrazilBulgariaBurma/MyanmarCabo VerdeCambodiaCameroonCanadaCaribbeanCentral AmericaChileChinaColombiaCongoCosta RicaCroatiaCubaCzechoslovakiaDenmarkDominicaDominican RepublicEastern AfricaEastern AsiaEastern EuropeEcuadorEgyptEl SalvadorEnglandEritreaEthiopiaEuropeFijiFranceGermanyGhanaGreeceGrenadaGuatemalaGuyanaHaitiHondurasHong KongHungaryIndiaIndonesiaIranIraqIrelandIsraelItalyJamaicaJapanJordanKazakhstanKenyaKoreaKuwaitLaosLatin AmericaLatviaLebanonLiberiaLithuaniaMalaysiaMexicoMicronesiaMiddle AfricaMoldovaMoroccoNepalNetherlandsNicaraguaNigeriaNorth AmericaNorth MacedoniaNorthern AfricaNorthern EuropeNorwayOceaniaPakistanPanamaPeruPhilippinesPolandPortugalRomaniaRussiaSaudi ArabiaScotlandSenegalSerbiaSierra LeoneSingaporeSomaliaSouth AfricaSouth AmericaSouth Central AsiaSouth Eastern AsiaSouthern EuropeSpainSri LankaSt. Vincent and the GrenadinesSudanSwedenSwitzerlandSyriaTaiwanThailandTrinidad and TobagoTurkeyUgandaUkraineUruguayUzbekistanVenezuelaVietnamWest IndiesWestern AfricaWestern AsiaWestern EuropeYemenZaireZimbabweAzores
2 or more Vehicles in Household
Income
Poverty
Unemployment
Labor Participation
Family Structure
Vehicle Availability
Education Level
Disability

Canadian 2 or more Vehicles in Household
Exceptional

58.6%
2+ VEHICLES AVAILABLE
99.7/ 100
METRIC RATING
68th/ 347
METRIC RANK

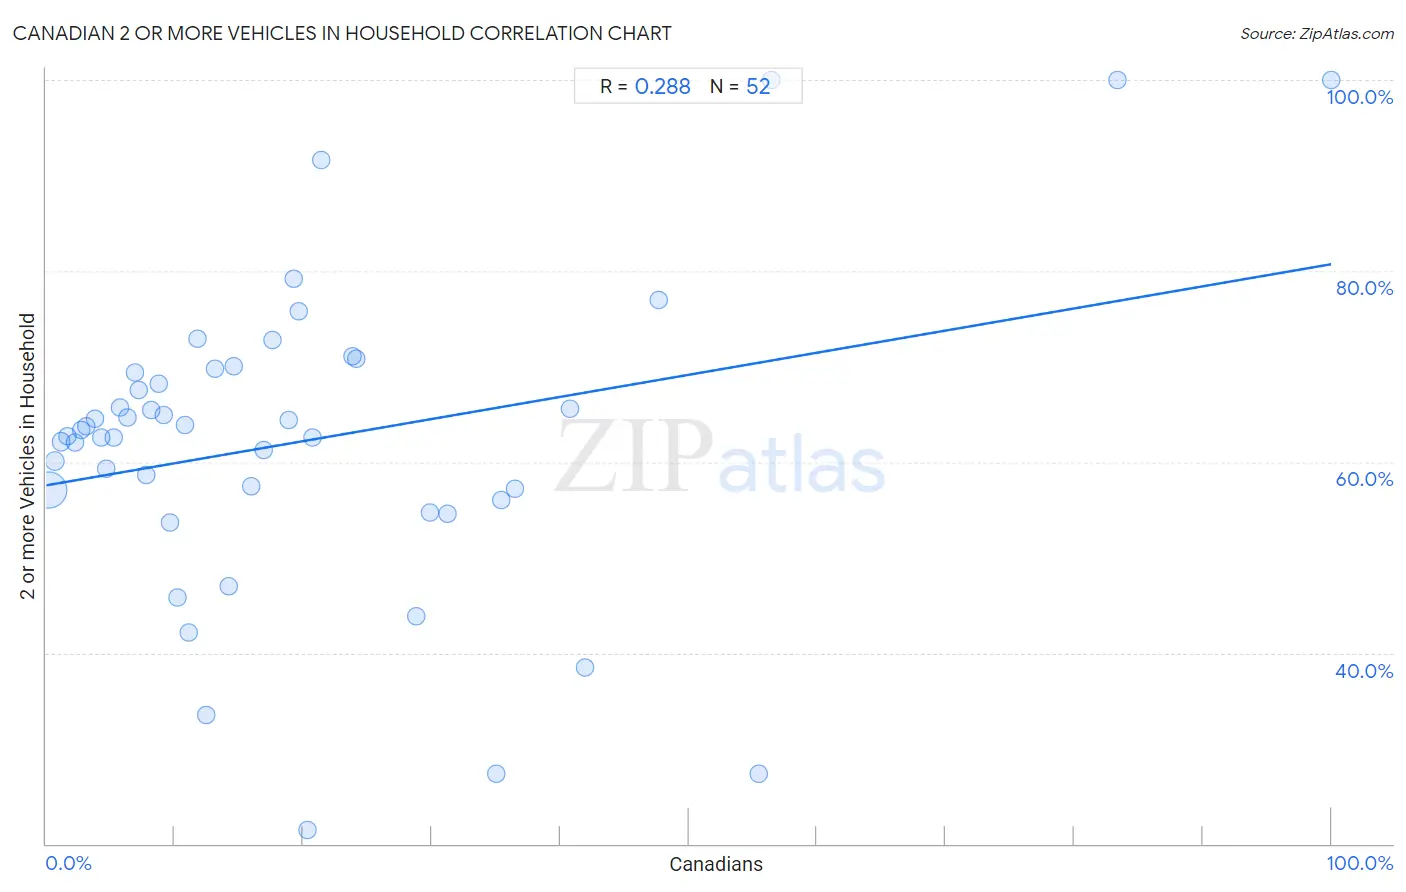
Canadian 2 or more Vehicles in Household Correlation Chart

The statistical analysis conducted on geographies consisting of 437,314,459 people shows a weak positive correlation between the proportion of Canadians and percentage of households with 2 or more vehicles available in the United States with a correlation coefficient (R) of 0.288 and weighted average of 58.6%. On average, for every 1% (one percent) increase in Canadians within a typical geography, there is an increase of 0.23% in percentage of households with 2 or more vehicles available.
Canadian 2 or more Vehicles in Household
It is essential to understand that the correlation between the percentage of Canadians and percentage of households with 2 or more vehicles available does not imply a direct cause-and-effect relationship. It remains uncertain whether the presence of Canadians influences an upward or downward trend in the level of percentage of households with 2 or more vehicles available within an area, or if Canadians simply ended up residing in those areas with higher or lower levels of percentage of households with 2 or more vehicles available due to other factors.

Demographics Similar to Canadians by 2 or more Vehicles in Household

In terms of 2 or more vehicles in household, the demographic groups most similar to Canadians are Laotian (58.6%, a difference of 0.010%), Croatian (58.6%, a difference of 0.030%), Immigrants from Central America (58.6%, a difference of 0.040%), Portuguese (58.6%, a difference of 0.090%), and Pennsylvania German (58.5%, a difference of 0.12%).
DemographicsRating | Rank2 or more Vehicles in Household
Osage
99.8
/100
|
#61
Exceptional
58.8%
Nonimmigrants
99.8
/100
|
#62
Exceptional
58.8%
Mexican American Indians
99.8
/100
|
#63
Exceptional
58.7%
Portuguese
99.7
/100
|
#64
Exceptional
58.6%
Immigrants from Central America
99.7
/100
|
#65
Exceptional
58.6%
Croatians
99.7
/100
|
#66
Exceptional
58.6%
Laotians
99.7
/100
|
#67
Exceptional
58.6%
Canadians
99.7
/100
|
#68
Exceptional
58.6%
Pennsylvania Germans
99.7
/100
|
#69
Exceptional
58.5%
Italians
99.6
/100
|
#70
Exceptional
58.4%
Bangladeshis
99.6
/100
|
#71
Exceptional
58.4%
Austrians
99.6
/100
|
#72
Exceptional
58.4%
Bolivians
99.6
/100
|
#73
Exceptional
58.3%
Immigrants from Afghanistan
99.6
/100
|
#74
Exceptional
58.3%
Poles
99.5
/100
|
#75
Exceptional
58.3%

Canadian 2 or more Vehicles in Household Correlation Summary

MeasurementCanadian Data2 or more Vehicles in Household Data
Minimum0.16%21.4%
Maximum100.0%100.0%
Range99.8%78.6%
Mean20.0%62.2%
Median13.7%63.0%
Interquartile 25% (IQ1)6.6%56.5%
Interquartile 75% (IQ3)26.5%69.6%
Interquartile Range (IQR)19.8%13.0%
Standard Deviation (Sample)20.3%16.3%
Standard Deviation (Population)20.1%16.2%

Correlation Details

Canadian PercentileSample Size2 or more Vehicles in Household
[
0.0%
-
0.5%
]
0.16%
393,487,10257.1%
[
0.5%
-
1.0%
]
0.67%
34,565,55460.1%
[
1.0%
-
1.5%
]
1.19%
5,666,37062.1%
[
1.5%
-
2.0%
]
1.68%
2,007,52962.7%
[
2.0%
-
2.5%
]
2.24%
728,04462.1%
[
2.5%
-
3.0%
]
2.76%
277,47763.3%
[
3.0%
-
3.5%
]
3.16%
178,36463.7%
[
3.5%
-
4.0%
]
3.80%
140,07964.6%
[
4.0%
-
4.5%
]
4.29%
61,21362.5%
[
4.5%
-
5.0%
]
4.68%
61,18759.3%
[
5.0%
-
5.5%
]
5.28%
13,89262.5%
[
5.5%
-
6.0%
]
5.78%
20,41965.7%
[
6.0%
-
6.5%
]
6.33%
41,35464.6%
[
6.5%
-
7.0%
]
6.89%
8,79469.4%
[
7.0%
-
7.5%
]
7.19%
12,12167.5%
[
7.5%
-
8.0%
]
7.83%
1,85258.6%
[
8.0%
-
8.5%
]
8.20%
4,57565.5%
[
8.5%
-
9.0%
]
8.72%
12,76568.2%
[
9.0%
-
9.5%
]
9.11%
3,47865.0%
[
9.5%
-
10.0%
]
9.67%
5,16853.7%
[
10.0%
-
10.5%
]
10.26%
1,18945.8%
[
10.5%
-
11.0%
]
10.81%
2,21163.9%
[
11.0%
-
11.5%
]
11.06%
85942.1%
[
11.5%
-
12.0%
]
11.73%
3,58972.9%
[
12.0%
-
12.5%
]
12.46%
2,56033.5%
[
13.0%
-
13.5%
]
13.13%
9969.8%
[
14.0%
-
14.5%
]
14.21%
1,56246.9%
[
14.5%
-
15.0%
]
14.63%
8270.0%
[
15.5%
-
16.0%
]
15.91%
2,03757.4%
[
16.5%
-
17.0%
]
16.90%
7161.3%
[
17.5%
-
18.0%
]
17.65%
1772.7%
[
18.5%
-
19.0%
]
18.89%
18064.4%
[
19.0%
-
19.5%
]
19.24%
44779.2%
[
19.5%
-
20.0%
]
19.67%
23975.8%
[
20.0%
-
20.5%
]
20.37%
10821.4%
[
20.5%
-
21.0%
]
20.73%
8262.5%
[
21.0%
-
21.5%
]
21.43%
2891.7%
[
23.5%
-
24.0%
]
23.79%
39171.0%
[
24.0%
-
24.5%
]
24.14%
2970.8%
[
28.5%
-
29.0%
]
28.77%
28543.9%
[
29.5%
-
30.0%
]
29.84%
31554.7%
[
31.0%
-
31.5%
]
31.25%
1654.5%
[
35.0%
-
35.5%
]
35.00%
2027.3%
[
35.0%
-
35.5%
]
35.42%
9656.0%
[
36.5%
-
37.0%
]
36.51%
6357.1%
[
40.5%
-
41.0%
]
40.74%
5465.6%
[
41.5%
-
42.0%
]
41.94%
3138.5%
[
47.5%
-
48.0%
]
47.62%
10576.9%
[
55.0%
-
55.5%
]
55.45%
10127.3%
[
56.0%
-
56.5%
]
56.39%
133100.0%
[
83.0%
-
83.5%
]
83.33%
120100.0%
[
99.5%
-
100.0%
]
100.00%
3100.0%