Rafter J Ranch, WY Map & Demographics
Rafter J Ranch Map
Rafter J Ranch Overview
$71,531
PER CAPITA INCOME
$157,159
AVG FAMILY INCOME
$144,844
AVG HOUSEHOLD INCOME
46.3%
WAGE / INCOME GAP [ % ]
53.7¢/ $1
WAGE / INCOME GAP [ $ ]
0.43
INEQUALITY / GINI INDEX
1,233
TOTAL POPULATION
553
MALE POPULATION
680
FEMALE POPULATION
81.32
MALES / 100 FEMALES
122.97
FEMALES / 100 MALES
52.3
MEDIAN AGE
2.6
AVG FAMILY SIZE
2.1
AVG HOUSEHOLD SIZE
769
LABOR FORCE [ PEOPLE ]
68.7%
PERCENT IN LABOR FORCE
Income in Rafter J Ranch
Income Overview in Rafter J Ranch
Per Capita Income in Rafter J Ranch is $71,531, while median incomes of families and households are $157,159 and $144,844 respectively.
| Characteristic | Number | Measure |
| Per Capita Income | 1,233 | $71,531 |
| Median Family Income | 324 | $157,159 |
| Mean Family Income | 324 | $163,788 |
| Median Household Income | 591 | $144,844 |
| Mean Household Income | 591 | $144,244 |
| Income Deficit | 324 | $0 |
| Wage / Income Gap (%) | 1,233 | 46.25% |
| Wage / Income Gap ($) | 1,233 | 53.75¢ per $1 |
| Gini / Inequality Index | 1,233 | 0.43 |
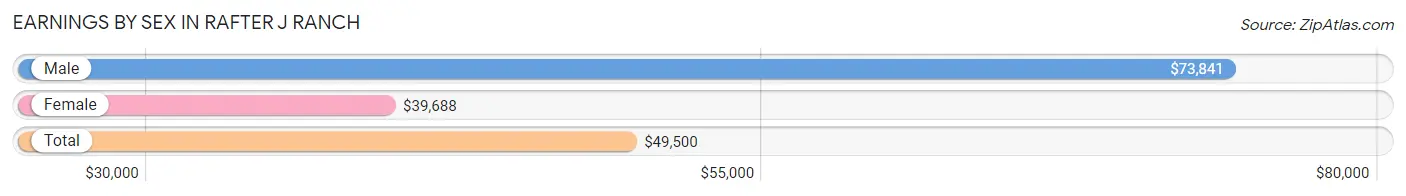
Earnings by Sex in Rafter J Ranch
Average Earnings in Rafter J Ranch are $49,500, $73,841 for men and $39,688 for women, a difference of 46.3%.
| Sex | Number | Average Earnings |
| Male | 436 (52.7%) | $73,841 |
| Female | 392 (47.3%) | $39,688 |
| Total | 828 (100.0%) | $49,500 |
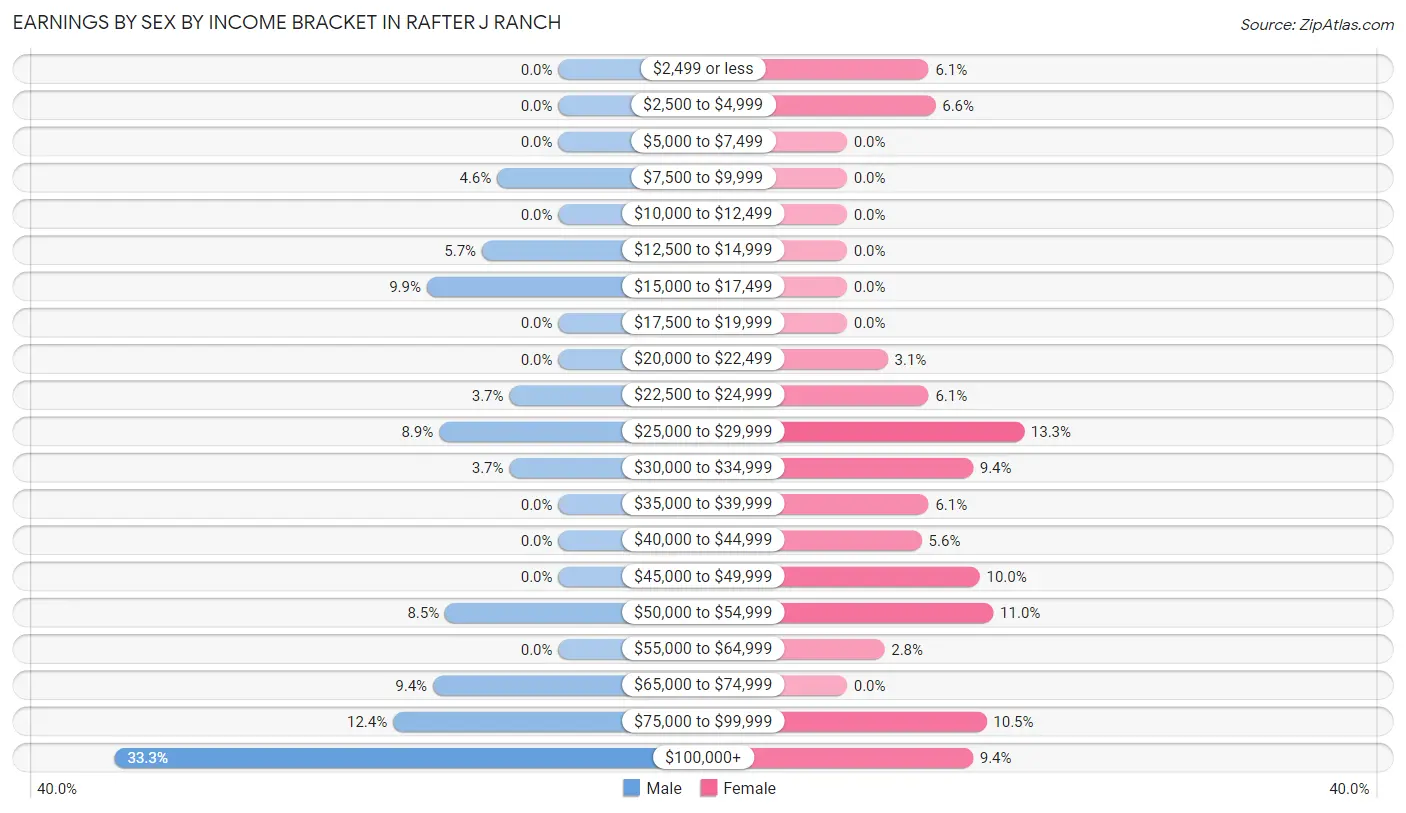
Earnings by Sex by Income Bracket in Rafter J Ranch
The most common earnings brackets in Rafter J Ranch are $100,000+ for men (145 | 33.3%) and $25,000 to $29,999 for women (52 | 13.3%).
| Income | Male | Female |
| $2,499 or less | 0 (0.0%) | 24 (6.1%) |
| $2,500 to $4,999 | 0 (0.0%) | 26 (6.6%) |
| $5,000 to $7,499 | 0 (0.0%) | 0 (0.0%) |
| $7,500 to $9,999 | 20 (4.6%) | 0 (0.0%) |
| $10,000 to $12,499 | 0 (0.0%) | 0 (0.0%) |
| $12,500 to $14,999 | 25 (5.7%) | 0 (0.0%) |
| $15,000 to $17,499 | 43 (9.9%) | 0 (0.0%) |
| $17,500 to $19,999 | 0 (0.0%) | 0 (0.0%) |
| $20,000 to $22,499 | 0 (0.0%) | 12 (3.1%) |
| $22,500 to $24,999 | 16 (3.7%) | 24 (6.1%) |
| $25,000 to $29,999 | 39 (8.9%) | 52 (13.3%) |
| $30,000 to $34,999 | 16 (3.7%) | 37 (9.4%) |
| $35,000 to $39,999 | 0 (0.0%) | 24 (6.1%) |
| $40,000 to $44,999 | 0 (0.0%) | 22 (5.6%) |
| $45,000 to $49,999 | 0 (0.0%) | 39 (10.0%) |
| $50,000 to $54,999 | 37 (8.5%) | 43 (11.0%) |
| $55,000 to $64,999 | 0 (0.0%) | 11 (2.8%) |
| $65,000 to $74,999 | 41 (9.4%) | 0 (0.0%) |
| $75,000 to $99,999 | 54 (12.4%) | 41 (10.5%) |
| $100,000+ | 145 (33.3%) | 37 (9.4%) |
| Total | 436 (100.0%) | 392 (100.0%) |
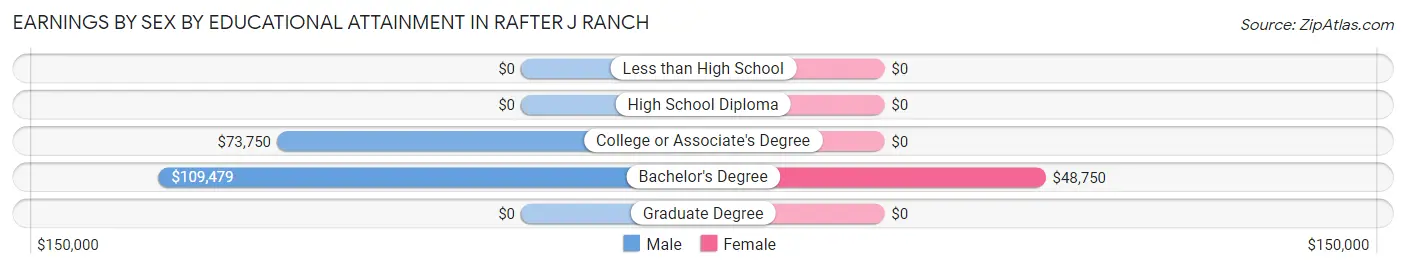
Earnings by Sex by Educational Attainment in Rafter J Ranch
Average earnings in Rafter J Ranch are $74,665 for men and $41,023 for women, a difference of 45.1%. Men with an educational attainment of bachelor's degree enjoy the highest average annual earnings of $109,479, while those with college or associate's degree education earn the least with $73,750. Women with an educational attainment of bachelor's degree earn the most with the average annual earnings of $48,750, while those with bachelor's degree education have the smallest earnings of $48,750.
| Educational Attainment | Male Income | Female Income |
| Less than High School | - | - |
| High School Diploma | - | - |
| College or Associate's Degree | $73,750 | $0 |
| Bachelor's Degree | $109,479 | $48,750 |
| Graduate Degree | - | - |
| Total | $74,665 | $41,023 |
Family Income in Rafter J Ranch
Family Income Brackets in Rafter J Ranch
According to the Rafter J Ranch family income data, there are 101 families falling into the $200,000+ income range, which is the most common income bracket and makes up 31.2% of all families.
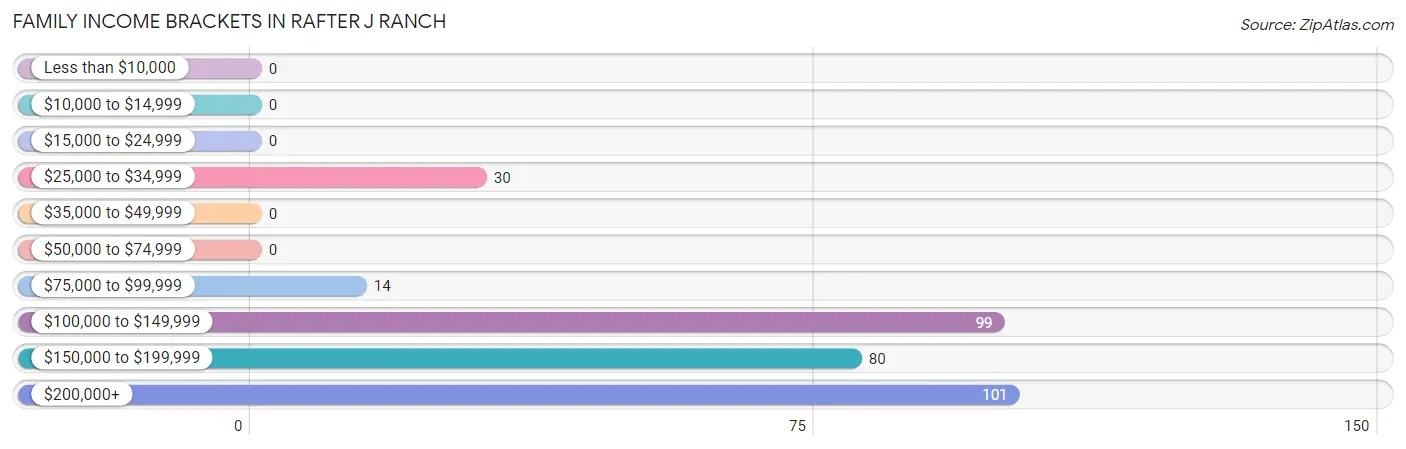
| Income Bracket | # Families | % Families |
| Less than $10,000 | 0 | 0.0% |
| $10,000 to $14,999 | 0 | 0.0% |
| $15,000 to $24,999 | 0 | 0.0% |
| $25,000 to $34,999 | 30 | 9.3% |
| $35,000 to $49,999 | 0 | 0.0% |
| $50,000 to $74,999 | 0 | 0.0% |
| $75,000 to $99,999 | 14 | 4.3% |
| $100,000 to $149,999 | 99 | 30.6% |
| $150,000 to $199,999 | 80 | 24.7% |
| $200,000+ | 101 | 31.2% |
Family Income by Famaliy Size in Rafter J Ranch
2-person families (186 | 57.4%) account for the highest median family income in Rafter J Ranch with $178,707 per family, while 2-person families (186 | 57.4%) have the highest median income of $89,354 per family member.
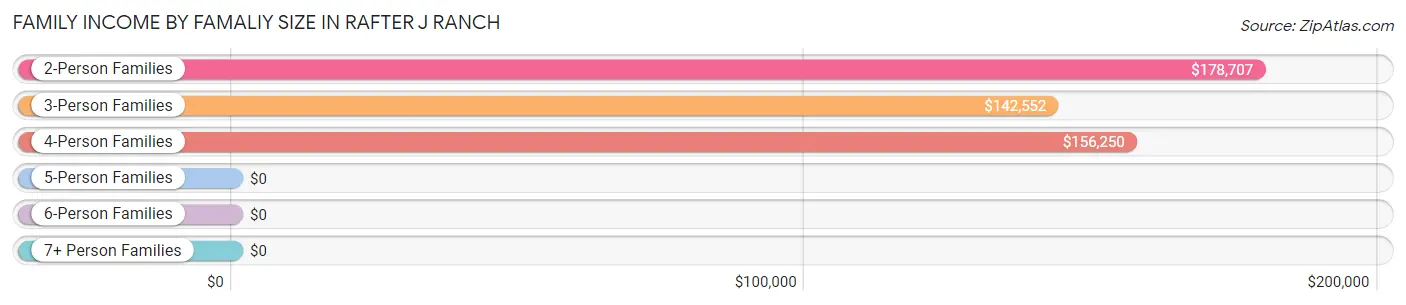
| Income Bracket | # Families | Median Income |
| 2-Person Families | 186 (57.4%) | $178,707 |
| 3-Person Families | 75 (23.2%) | $142,552 |
| 4-Person Families | 37 (11.4%) | $156,250 |
| 5-Person Families | 26 (8.0%) | $0 |
| 6-Person Families | 0 (0.0%) | $0 |
| 7+ Person Families | 0 (0.0%) | $0 |
| Total | 324 (100.0%) | $157,159 |
Family Income by Number of Earners in Rafter J Ranch
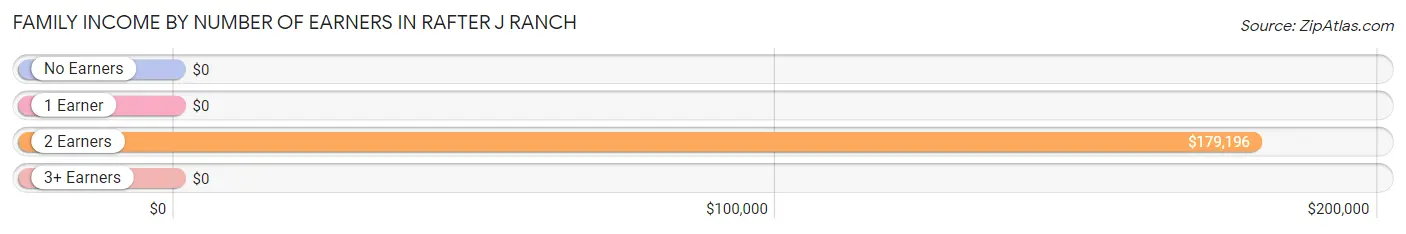
| Number of Earners | # Families | Median Income |
| No Earners | 28 (8.6%) | $0 |
| 1 Earner | 43 (13.3%) | $0 |
| 2 Earners | 203 (62.6%) | $179,196 |
| 3+ Earners | 50 (15.4%) | $0 |
| Total | 324 (100.0%) | $157,159 |
Household Income in Rafter J Ranch
Household Income Brackets in Rafter J Ranch
With 151 households falling in the category, the $150,000 to $199,999 income range is the most frequent in Rafter J Ranch, accounting for 25.6% of all households.
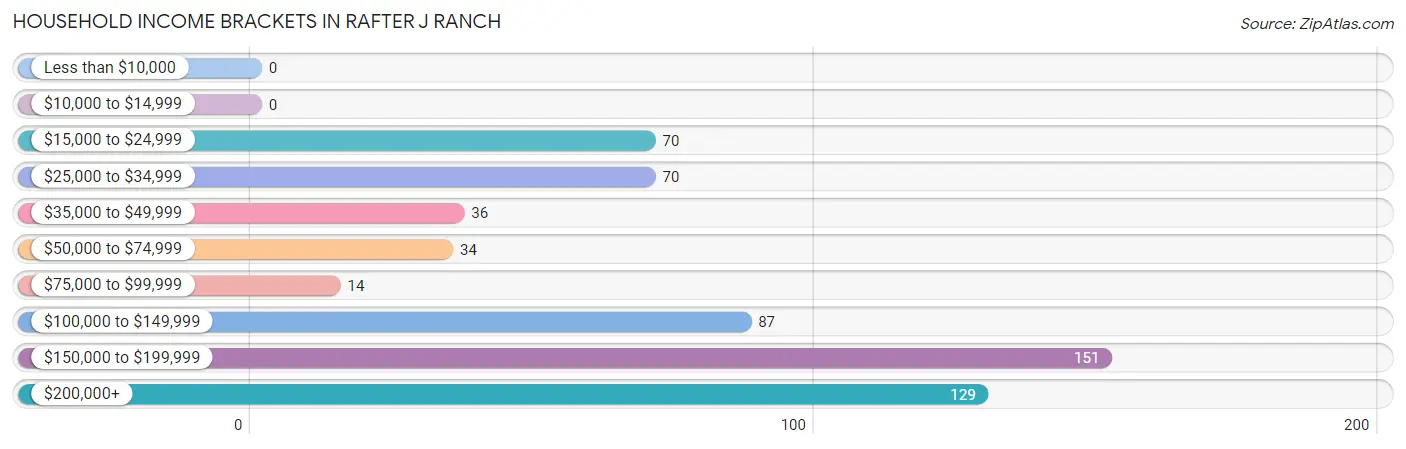
| Income Bracket | # Households | % Households |
| Less than $10,000 | 0 | 0.0% |
| $10,000 to $14,999 | 0 | 0.0% |
| $15,000 to $24,999 | 70 | 11.8% |
| $25,000 to $34,999 | 70 | 11.8% |
| $35,000 to $49,999 | 36 | 6.1% |
| $50,000 to $74,999 | 34 | 5.8% |
| $75,000 to $99,999 | 14 | 2.4% |
| $100,000 to $149,999 | 87 | 14.7% |
| $150,000 to $199,999 | 151 | 25.5% |
| $200,000+ | 129 | 21.8% |
Household Income by Householder Age in Rafter J Ranch
The median household income in Rafter J Ranch is $144,844, with the highest median household income of $178,304 found in the 25 to 44 years age bracket for the primary householder. A total of 133 households (22.5%) fall into this category.
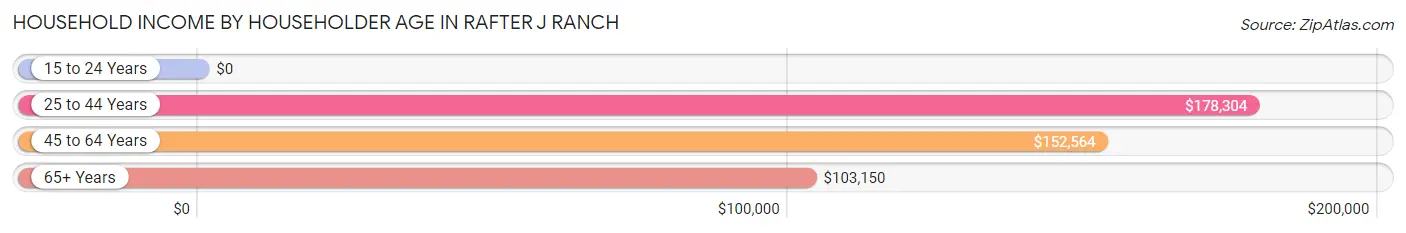
| Income Bracket | # Households | Median Income |
| 15 to 24 Years | 0 (0.0%) | $0 |
| 25 to 44 Years | 133 (22.5%) | $178,304 |
| 45 to 64 Years | 247 (41.8%) | $152,564 |
| 65+ Years | 211 (35.7%) | $103,150 |
| Total | 591 (100.0%) | $144,844 |
Poverty in Rafter J Ranch
Income Below Poverty by Sex and Age in Rafter J Ranch
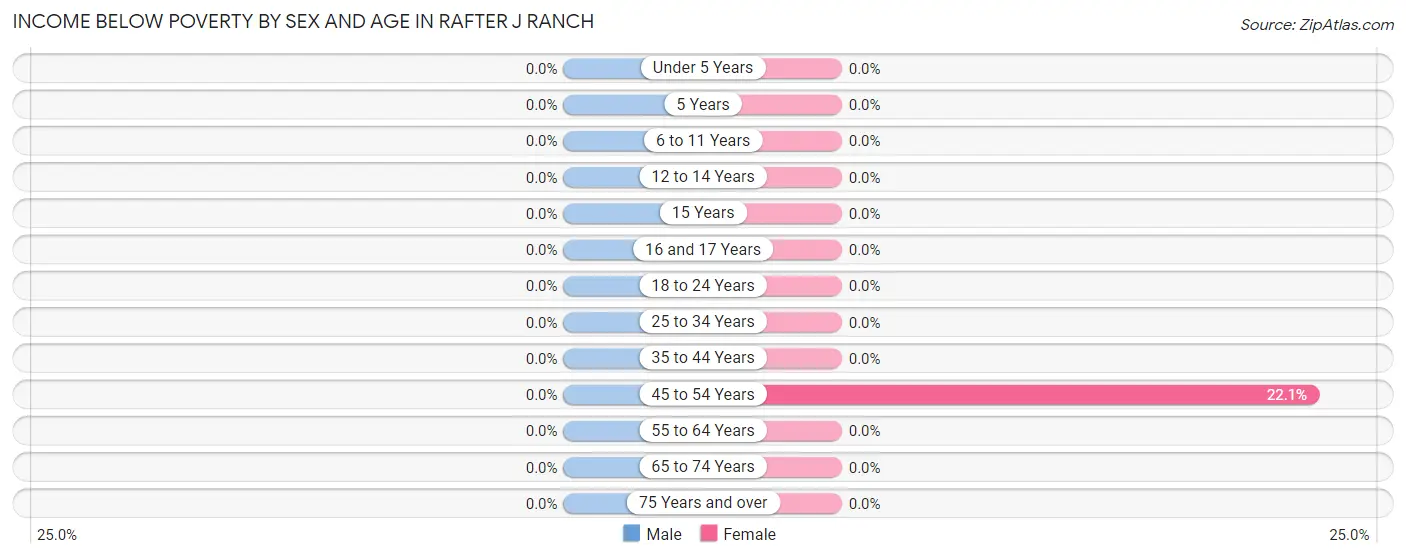
| Age Bracket | Male | Female |
| Under 5 Years | 0 (0.0%) | 0 (0.0%) |
| 5 Years | 0 (0.0%) | 0 (0.0%) |
| 6 to 11 Years | 0 (0.0%) | 0 (0.0%) |
| 12 to 14 Years | 0 (0.0%) | 0 (0.0%) |
| 15 Years | 0 (0.0%) | 0 (0.0%) |
| 16 and 17 Years | 0 (0.0%) | 0 (0.0%) |
| 18 to 24 Years | 0 (0.0%) | 0 (0.0%) |
| 25 to 34 Years | 0 (0.0%) | 0 (0.0%) |
| 35 to 44 Years | 0 (0.0%) | 0 (0.0%) |
| 45 to 54 Years | 0 (0.0%) | 31 (22.1%) |
| 55 to 64 Years | 0 (0.0%) | 0 (0.0%) |
| 65 to 74 Years | 0 (0.0%) | 0 (0.0%) |
| 75 Years and over | 0 (0.0%) | 0 (0.0%) |
| Total | 0 (0.0%) | 31 (4.7%) |
Income Above Poverty by Sex and Age in Rafter J Ranch
According to the poverty statistics in Rafter J Ranch, males aged under 5 years and females aged under 5 years are the age groups that are most secure financially, with 100.0% of males and 100.0% of females in these age groups living above the poverty line.
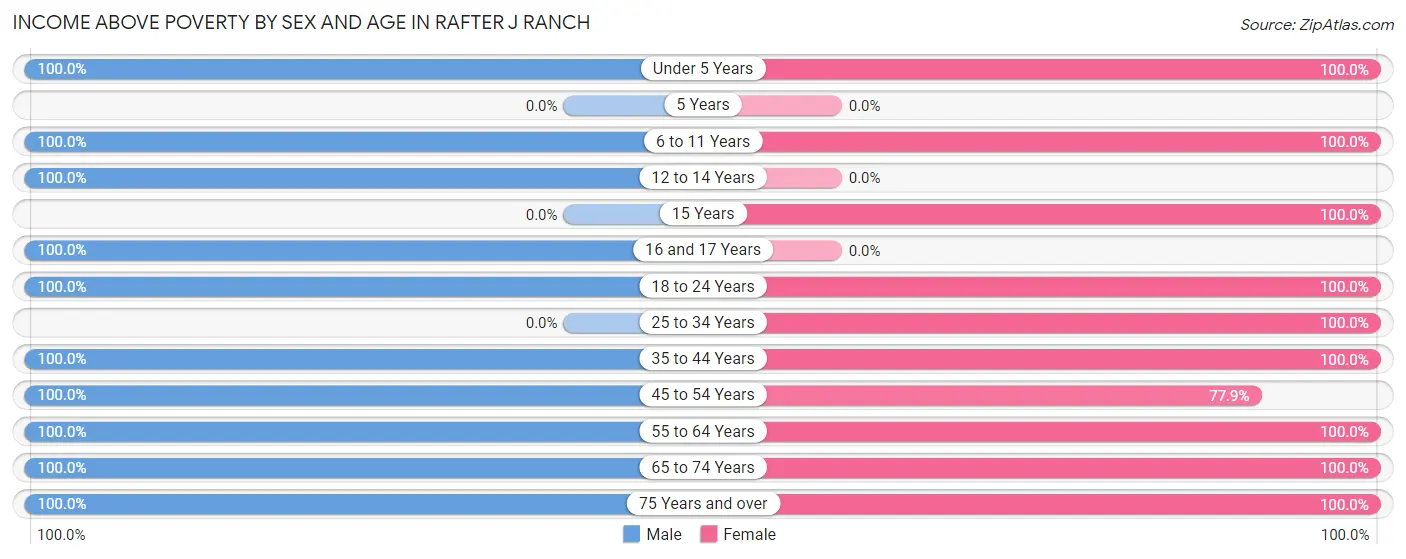
| Age Bracket | Male | Female |
| Under 5 Years | 31 (100.0%) | 15 (100.0%) |
| 5 Years | 0 (0.0%) | 0 (0.0%) |
| 6 to 11 Years | 20 (100.0%) | 29 (100.0%) |
| 12 to 14 Years | 5 (100.0%) | 0 (0.0%) |
| 15 Years | 0 (0.0%) | 14 (100.0%) |
| 16 and 17 Years | 15 (100.0%) | 0 (0.0%) |
| 18 to 24 Years | 27 (100.0%) | 24 (100.0%) |
| 25 to 34 Years | 0 (0.0%) | 25 (100.0%) |
| 35 to 44 Years | 147 (100.0%) | 109 (100.0%) |
| 45 to 54 Years | 99 (100.0%) | 109 (77.9%) |
| 55 to 64 Years | 105 (100.0%) | 89 (100.0%) |
| 65 to 74 Years | 72 (100.0%) | 62 (100.0%) |
| 75 Years and over | 32 (100.0%) | 156 (100.0%) |
| Total | 553 (100.0%) | 632 (95.3%) |
Income Below Poverty Among Married-Couple Families in Rafter J Ranch
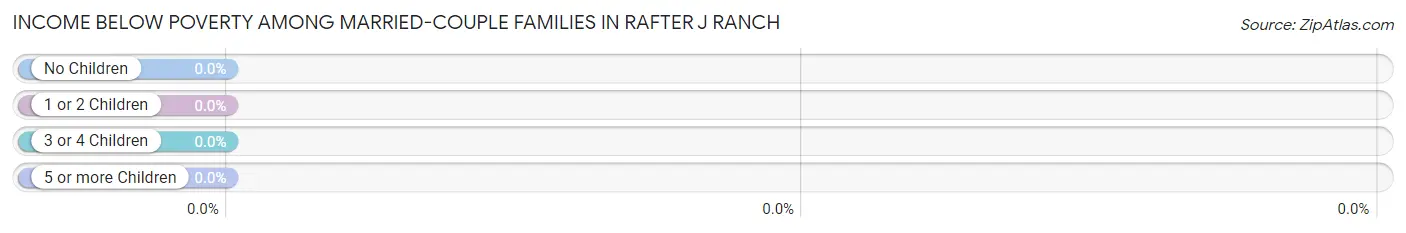
| Children | Above Poverty | Below Poverty |
| No Children | 193 (100.0%) | 0 (0.0%) |
| 1 or 2 Children | 62 (100.0%) | 0 (0.0%) |
| 3 or 4 Children | 26 (100.0%) | 0 (0.0%) |
| 5 or more Children | 0 (0.0%) | 0 (0.0%) |
| Total | 281 (100.0%) | 0 (0.0%) |
Income Below Poverty Among Single-Parent Households in Rafter J Ranch
| Children | Single Father | Single Mother |
| No Children | 0 (0.0%) | 0 (0.0%) |
| 1 or 2 Children | 0 (0.0%) | 0 (0.0%) |
| 3 or 4 Children | 0 (0.0%) | 0 (0.0%) |
| 5 or more Children | 0 (0.0%) | 0 (0.0%) |
| Total | 0 (0.0%) | 0 (0.0%) |
Income Below Poverty Among Married-Couple vs Single-Parent Households in Rafter J Ranch
| Children | Married-Couple Families | Single-Parent Households |
| No Children | 0 (0.0%) | 0 (0.0%) |
| 1 or 2 Children | 0 (0.0%) | 0 (0.0%) |
| 3 or 4 Children | 0 (0.0%) | 0 (0.0%) |
| 5 or more Children | 0 (0.0%) | 0 (0.0%) |
| Total | 0 (0.0%) | 0 (0.0%) |
Race in Rafter J Ranch
The most populous races in Rafter J Ranch are White / Caucasian (1,142 | 92.6%), Two or more Races (51 | 4.1%), and Hispanic or Latino (31 | 2.5%).
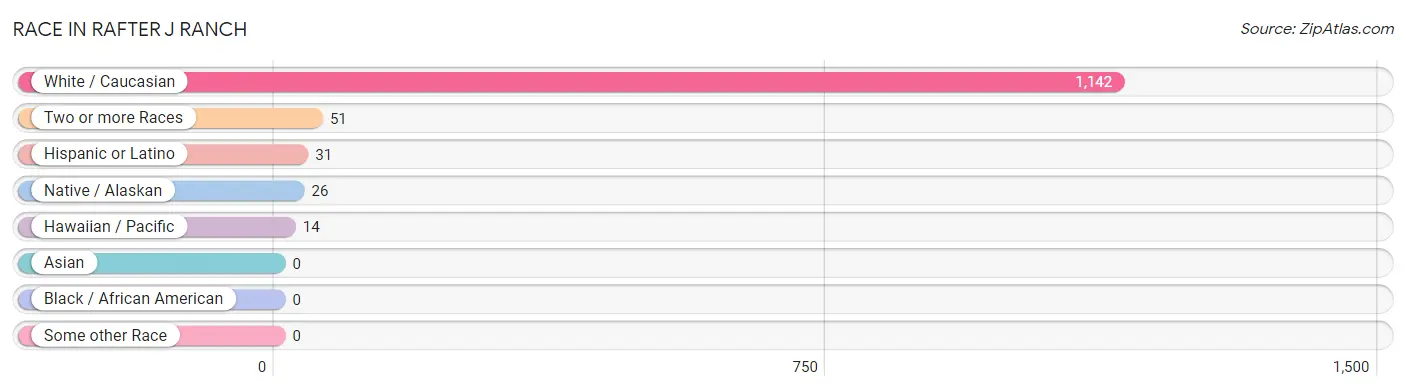
| Race | # Population | % Population |
| Asian | 0 | 0.0% |
| Black / African American | 0 | 0.0% |
| Hawaiian / Pacific | 14 | 1.1% |
| Hispanic or Latino | 31 | 2.5% |
| Native / Alaskan | 26 | 2.1% |
| White / Caucasian | 1,142 | 92.6% |
| Two or more Races | 51 | 4.1% |
| Some other Race | 0 | 0.0% |
| Total | 1,233 | 100.0% |
Ancestry in Rafter J Ranch
The most populous ancestries reported in Rafter J Ranch are English (268 | 21.7%), Irish (177 | 14.4%), German (170 | 13.8%), Scottish (60 | 4.9%), and Polish (57 | 4.6%), together accounting for 59.4% of all Rafter J Ranch residents.
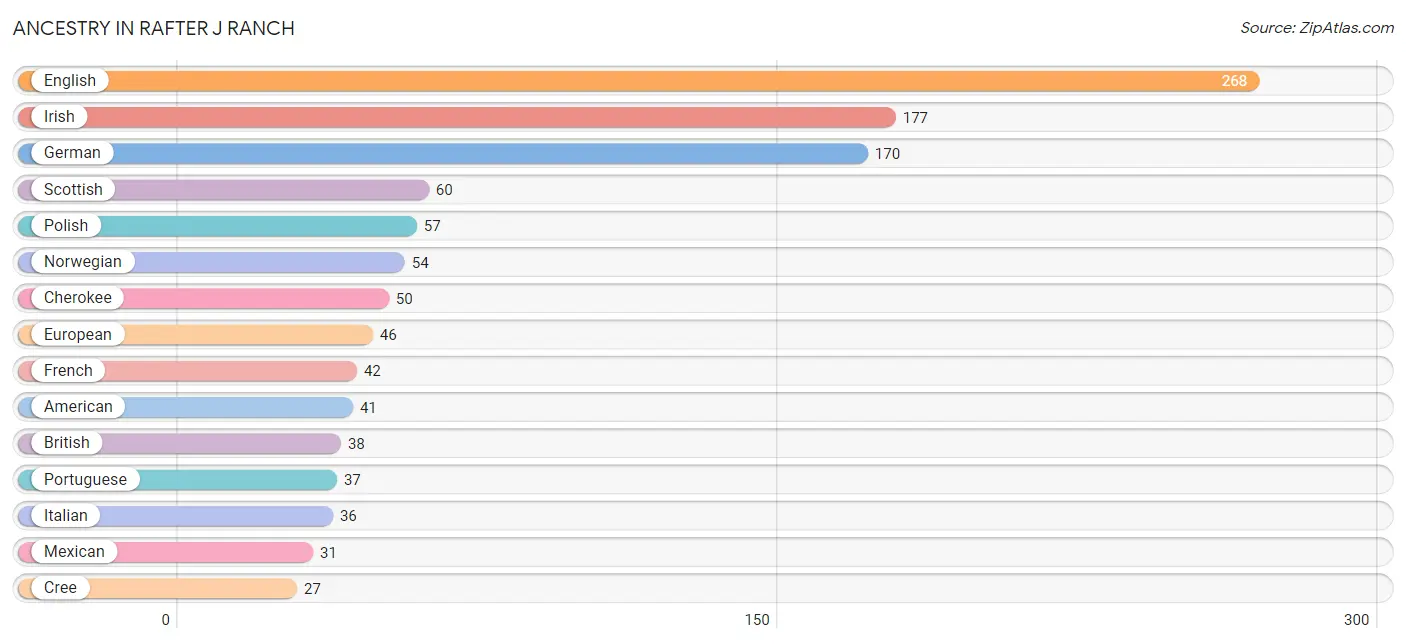
| Ancestry | # Population | % Population |
| American | 41 | 3.3% |
| British | 38 | 3.1% |
| Cherokee | 50 | 4.1% |
| Cree | 27 | 2.2% |
| Danish | 10 | 0.8% |
| English | 268 | 21.7% |
| European | 46 | 3.7% |
| Finnish | 24 | 1.9% |
| French | 42 | 3.4% |
| German | 170 | 13.8% |
| Irish | 177 | 14.4% |
| Italian | 36 | 2.9% |
| Mexican | 31 | 2.5% |
| Norwegian | 54 | 4.4% |
| Polish | 57 | 4.6% |
| Portuguese | 37 | 3.0% |
| Russian | 12 | 1.0% |
| Scottish | 60 | 4.9% |
| Serbian | 22 | 1.8% |
| Swedish | 12 | 1.0% |
| Swiss | 13 | 1.1% |
| Welsh | 10 | 0.8% | View All 22 Rows |
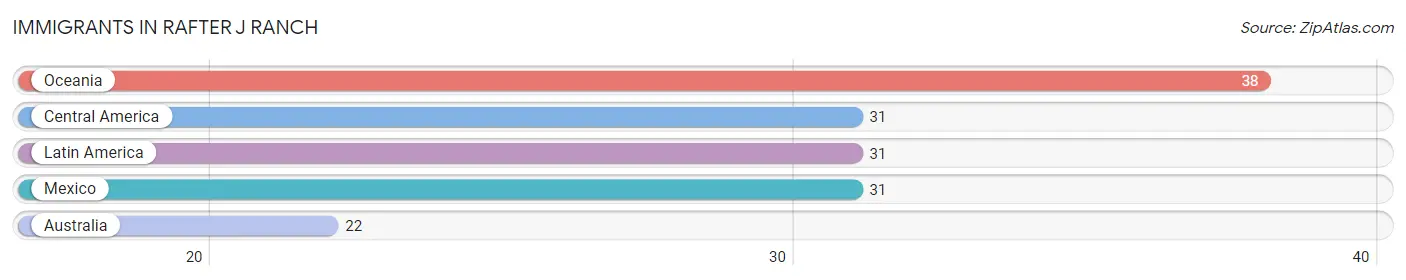
Immigrants in Rafter J Ranch
The most numerous immigrant groups reported in Rafter J Ranch came from Oceania (38 | 3.1%), Central America (31 | 2.5%), Latin America (31 | 2.5%), Mexico (31 | 2.5%), and Australia (22 | 1.8%), together accounting for 12.4% of all Rafter J Ranch residents.
| Immigration Origin | # Population | % Population |
| Australia | 22 | 1.8% |
| Central America | 31 | 2.5% |
| Latin America | 31 | 2.5% |
| Mexico | 31 | 2.5% |
| Oceania | 38 | 3.1% | View All 5 Rows |
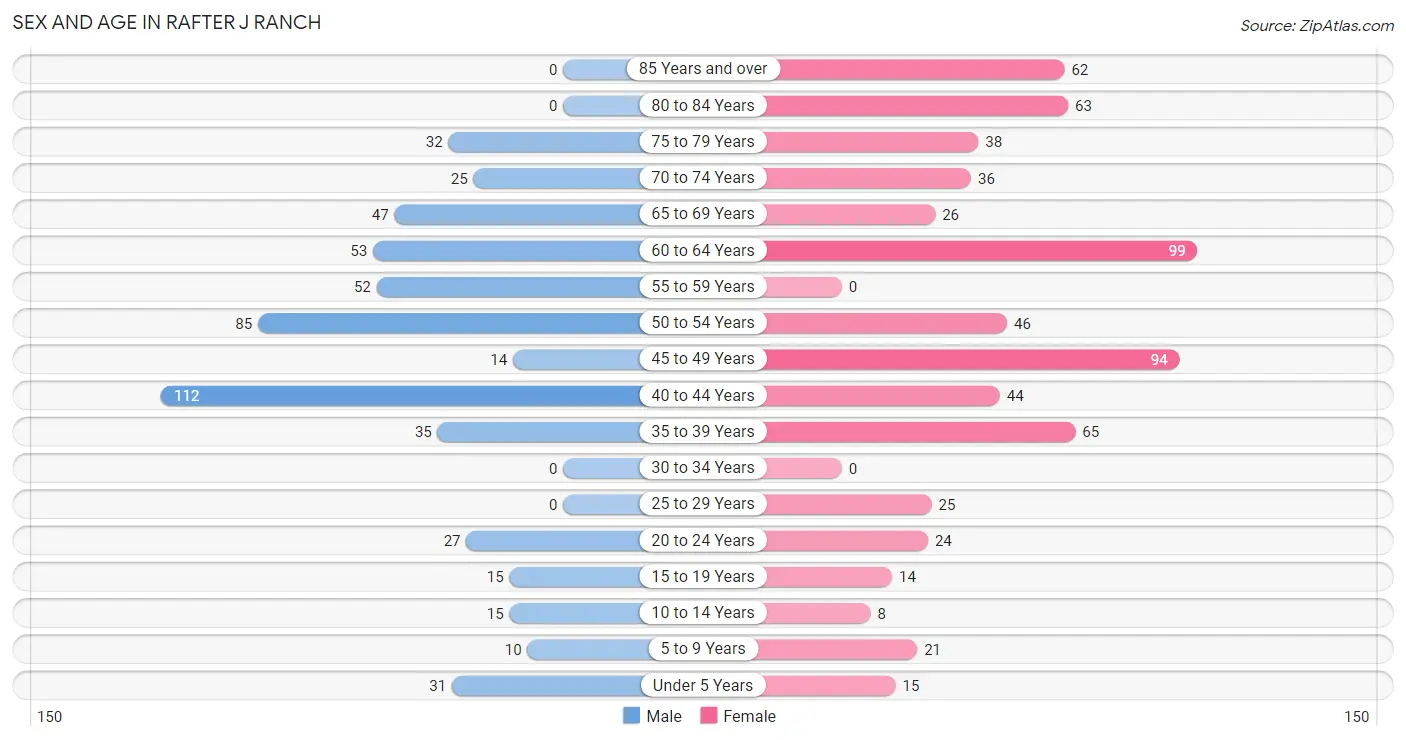
Sex and Age in Rafter J Ranch
Sex and Age in Rafter J Ranch
The most populous age groups in Rafter J Ranch are 40 to 44 Years (112 | 20.3%) for men and 60 to 64 Years (99 | 14.6%) for women.
| Age Bracket | Male | Female |
| Under 5 Years | 31 (5.6%) | 15 (2.2%) |
| 5 to 9 Years | 10 (1.8%) | 21 (3.1%) |
| 10 to 14 Years | 15 (2.7%) | 8 (1.2%) |
| 15 to 19 Years | 15 (2.7%) | 14 (2.1%) |
| 20 to 24 Years | 27 (4.9%) | 24 (3.5%) |
| 25 to 29 Years | 0 (0.0%) | 25 (3.7%) |
| 30 to 34 Years | 0 (0.0%) | 0 (0.0%) |
| 35 to 39 Years | 35 (6.3%) | 65 (9.6%) |
| 40 to 44 Years | 112 (20.3%) | 44 (6.5%) |
| 45 to 49 Years | 14 (2.5%) | 94 (13.8%) |
| 50 to 54 Years | 85 (15.4%) | 46 (6.8%) |
| 55 to 59 Years | 52 (9.4%) | 0 (0.0%) |
| 60 to 64 Years | 53 (9.6%) | 99 (14.6%) |
| 65 to 69 Years | 47 (8.5%) | 26 (3.8%) |
| 70 to 74 Years | 25 (4.5%) | 36 (5.3%) |
| 75 to 79 Years | 32 (5.8%) | 38 (5.6%) |
| 80 to 84 Years | 0 (0.0%) | 63 (9.3%) |
| 85 Years and over | 0 (0.0%) | 62 (9.1%) |
| Total | 553 (100.0%) | 680 (100.0%) |
Families and Households in Rafter J Ranch
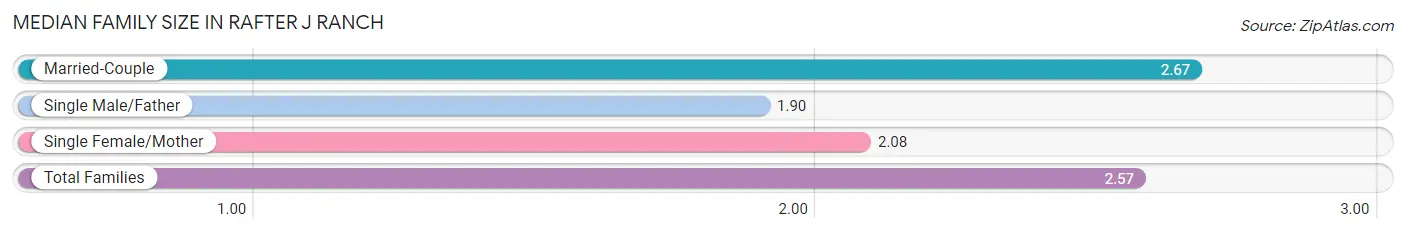
Median Family Size in Rafter J Ranch
The median family size in Rafter J Ranch is 2.57 persons per family, with married-couple families (281 | 86.7%) accounting for the largest median family size of 2.67 persons per family. On the other hand, single male/father families (30 | 9.3%) represent the smallest median family size with 1.90 persons per family.
| Family Type | # Families | Family Size |
| Married-Couple | 281 (86.7%) | 2.67 |
| Single Male/Father | 30 (9.3%) | 1.90 |
| Single Female/Mother | 13 (4.0%) | 2.08 |
| Total Families | 324 (100.0%) | 2.57 |
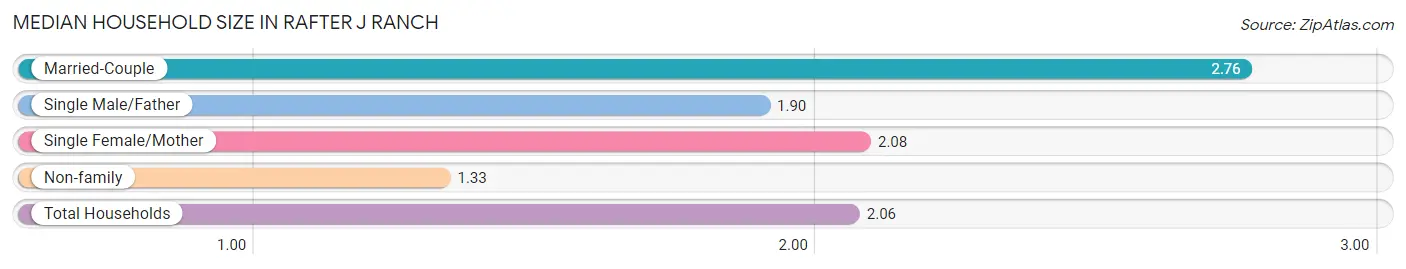
Median Household Size in Rafter J Ranch
The median household size in Rafter J Ranch is 2.06 persons per household, with married-couple households (281 | 47.5%) accounting for the largest median household size of 2.76 persons per household. non-family households (267 | 45.2%) represent the smallest median household size with 1.33 persons per household.
| Household Type | # Households | Household Size |
| Married-Couple | 281 (47.5%) | 2.76 |
| Single Male/Father | 30 (5.1%) | 1.90 |
| Single Female/Mother | 13 (2.2%) | 2.08 |
| Non-family | 267 (45.2%) | 1.33 |
| Total Households | 591 (100.0%) | 2.06 |
Household Size by Marriage Status in Rafter J Ranch
Out of a total of 591 households in Rafter J Ranch, 324 (54.8%) are family households, while 267 (45.2%) are nonfamily households. The most numerous type of family households are 2-person households, comprising 186, and the most common type of nonfamily households are 1-person households, comprising 192.
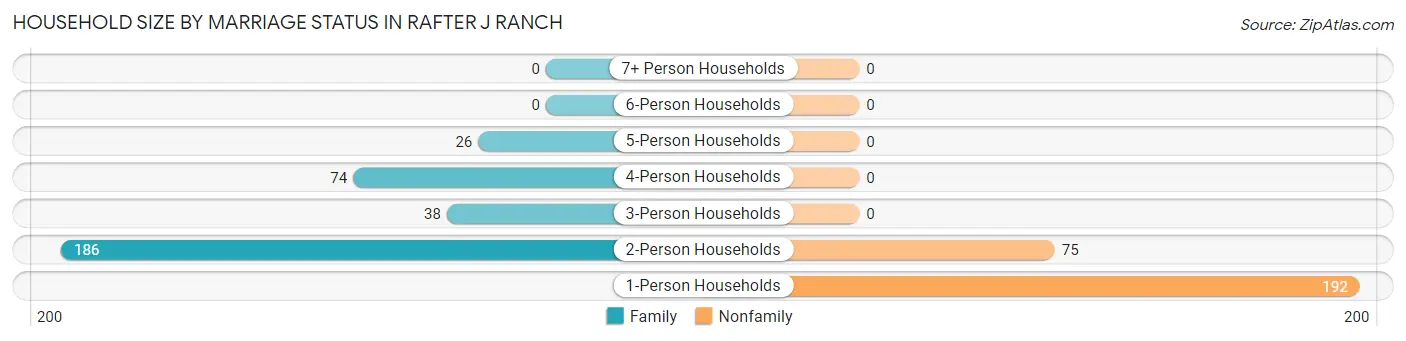
| Household Size | Family Households | Nonfamily Households |
| 1-Person Households | - | 192 (32.5%) |
| 2-Person Households | 186 (31.5%) | 75 (12.7%) |
| 3-Person Households | 38 (6.4%) | 0 (0.0%) |
| 4-Person Households | 74 (12.5%) | 0 (0.0%) |
| 5-Person Households | 26 (4.4%) | 0 (0.0%) |
| 6-Person Households | 0 (0.0%) | 0 (0.0%) |
| 7+ Person Households | 0 (0.0%) | 0 (0.0%) |
| Total | 324 (54.8%) | 267 (45.2%) |
Female Fertility in Rafter J Ranch
Fertility by Age in Rafter J Ranch
Average fertility rate in Rafter J Ranch is 102.0 births per 1,000 women. Women in the age bracket of 35 to 50 years have the highest fertility rate with 133.0 births per 1,000 women. Women in the age bracket of 35 to 50 years acount for 100.0% of all women with births.
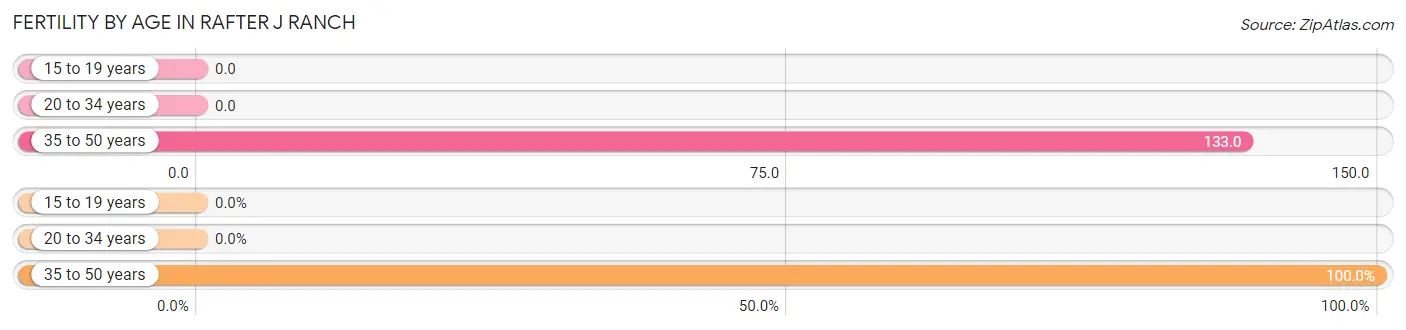
| Age Bracket | Women with Births | Births / 1,000 Women |
| 15 to 19 years | 0 (0.0%) | 0.0 |
| 20 to 34 years | 0 (0.0%) | 0.0 |
| 35 to 50 years | 27 (100.0%) | 133.0 |
| Total | 27 (100.0%) | 102.0 |
Fertility by Age by Marriage Status in Rafter J Ranch
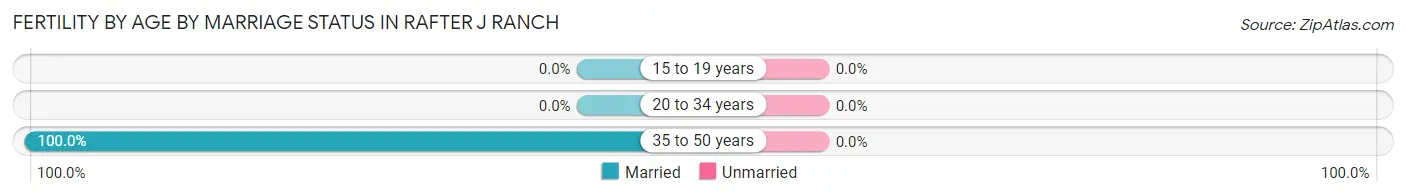
| Age Bracket | Married | Unmarried |
| 15 to 19 years | 0 (0.0%) | 0 (0.0%) |
| 20 to 34 years | 0 (0.0%) | 0 (0.0%) |
| 35 to 50 years | 27 (100.0%) | 0 (0.0%) |
| Total | 27 (100.0%) | 0 (0.0%) |
Fertility by Education in Rafter J Ranch
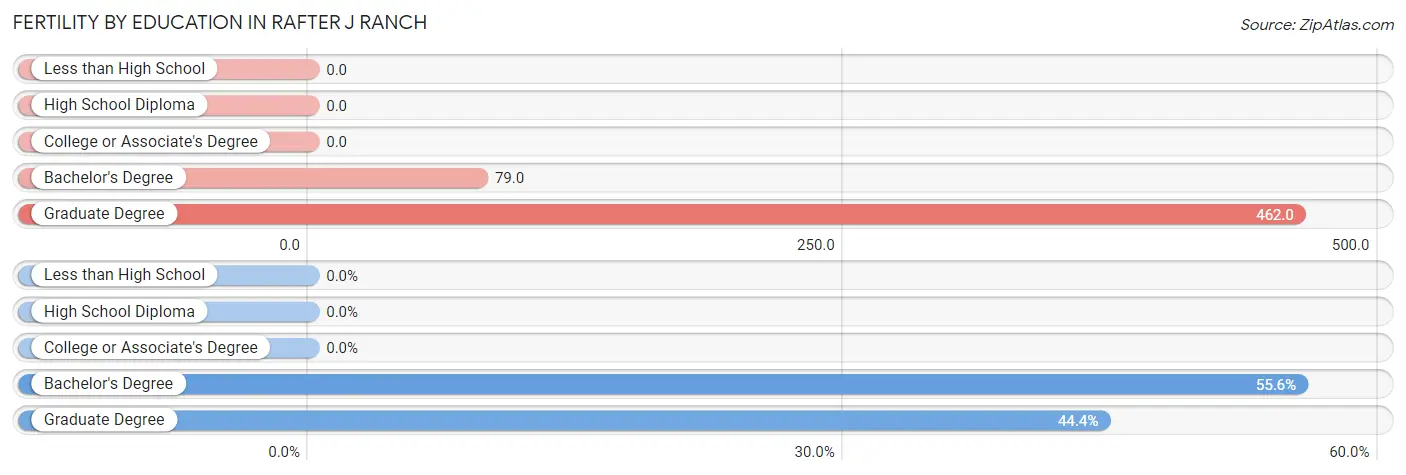
| Educational Attainment | Women with Births | Births / 1,000 Women |
| Less than High School | 0 (0.0%) | 0.0 |
| High School Diploma | 0 (0.0%) | 0.0 |
| College or Associate's Degree | 0 (0.0%) | 0.0 |
| Bachelor's Degree | 15 (55.6%) | 79.0 |
| Graduate Degree | 12 (44.4%) | 462.0 |
| Total | 27 (100.0%) | 102.0 |
Fertility by Education by Marriage Status in Rafter J Ranch
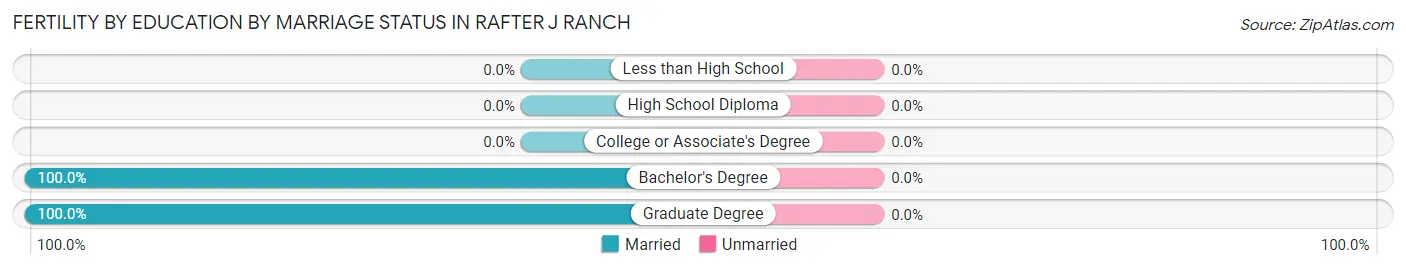
| Educational Attainment | Married | Unmarried |
| Less than High School | 0 (0.0%) | 0 (0.0%) |
| High School Diploma | 0 (0.0%) | 0 (0.0%) |
| College or Associate's Degree | 0 (0.0%) | 0 (0.0%) |
| Bachelor's Degree | 15 (100.0%) | 0 (0.0%) |
| Graduate Degree | 12 (100.0%) | 0 (0.0%) |
| Total | 27 (100.0%) | 0 (0.0%) |
Employment Characteristics in Rafter J Ranch
Employment by Class of Employer in Rafter J Ranch
Among the 732 employed individuals in Rafter J Ranch, private company employees (437 | 59.7%), local government employees (117 | 16.0%), and not-for-profit organizations (100 | 13.7%) make up the most common classes of employment.
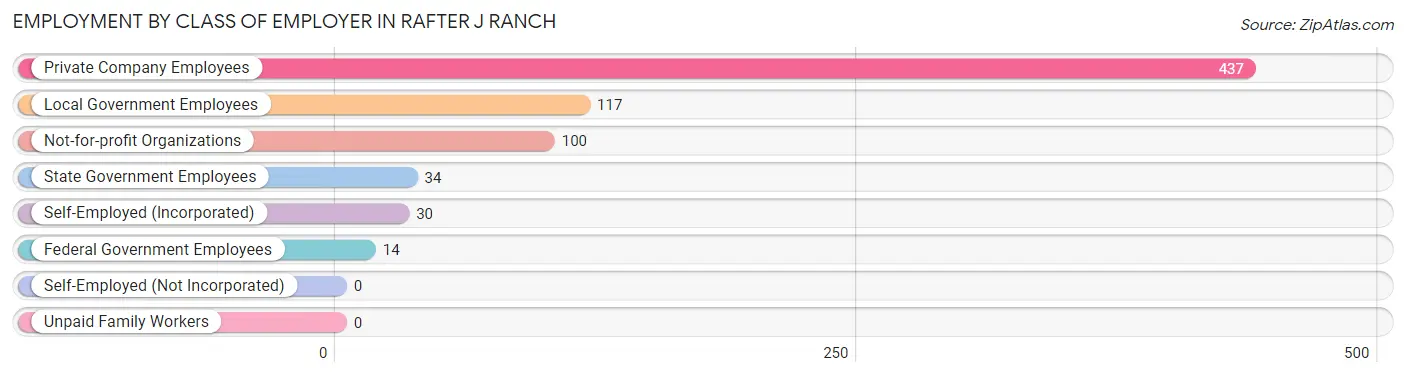
| Employer Class | # Employees | % Employees |
| Private Company Employees | 437 | 59.7% |
| Self-Employed (Incorporated) | 30 | 4.1% |
| Self-Employed (Not Incorporated) | 0 | 0.0% |
| Not-for-profit Organizations | 100 | 13.7% |
| Local Government Employees | 117 | 16.0% |
| State Government Employees | 34 | 4.6% |
| Federal Government Employees | 14 | 1.9% |
| Unpaid Family Workers | 0 | 0.0% |
| Total | 732 | 100.0% |
Employment Status by Age in Rafter J Ranch
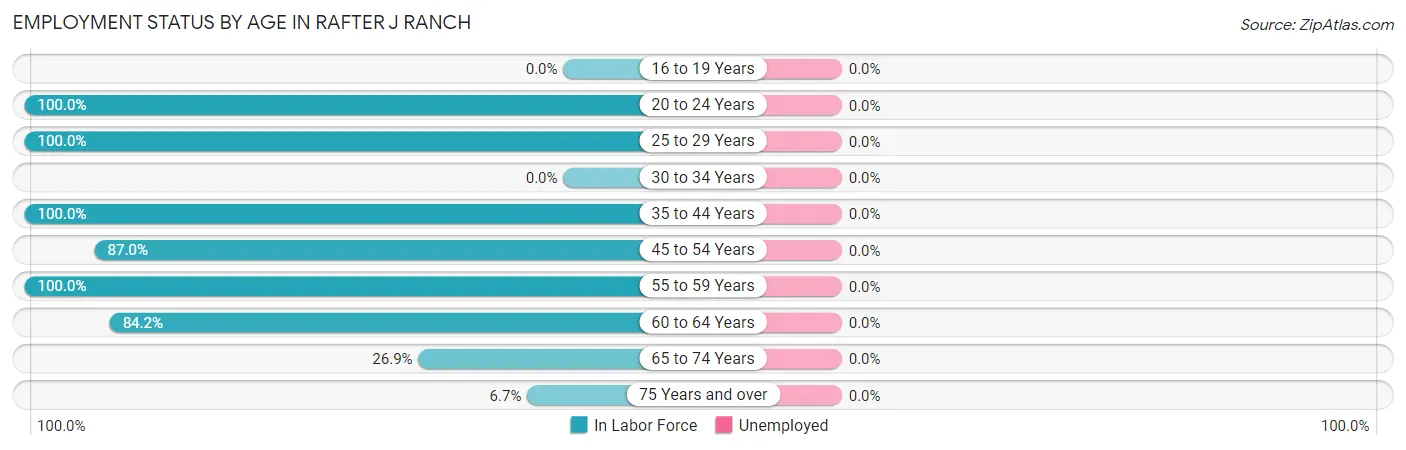
| Age Bracket | In Labor Force | Unemployed |
| 16 to 19 Years | 0 (0.0%) | 0 (0.0%) |
| 20 to 24 Years | 51 (100.0%) | 0 (0.0%) |
| 25 to 29 Years | 25 (100.0%) | 0 (0.0%) |
| 30 to 34 Years | 0 (0.0%) | 0 (0.0%) |
| 35 to 44 Years | 256 (100.0%) | 0 (0.0%) |
| 45 to 54 Years | 208 (87.0%) | 0 (0.0%) |
| 55 to 59 Years | 52 (100.0%) | 0 (0.0%) |
| 60 to 64 Years | 128 (84.2%) | 0 (0.0%) |
| 65 to 74 Years | 36 (26.9%) | 0 (0.0%) |
| 75 Years and over | 13 (6.7%) | 0 (0.0%) |
| Total | 769 (68.7%) | 0 (0.0%) |
Employment Status by Educational Attainment in Rafter J Ranch
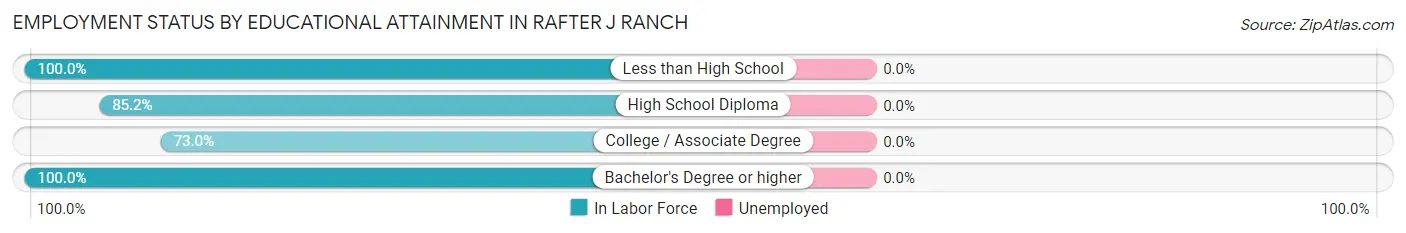
| Educational Attainment | In Labor Force | Unemployed |
| Less than High School | 14 (100.0%) | 0 (0.0%) |
| High School Diploma | 138 (85.2%) | 0 (0.0%) |
| College / Associate Degree | 84 (73.0%) | 0 (0.0%) |
| Bachelor's Degree or higher | 433 (100.0%) | 0 (0.0%) |
| Total | 669 (92.4%) | 0 (0.0%) |
Employment Occupations by Sex in Rafter J Ranch
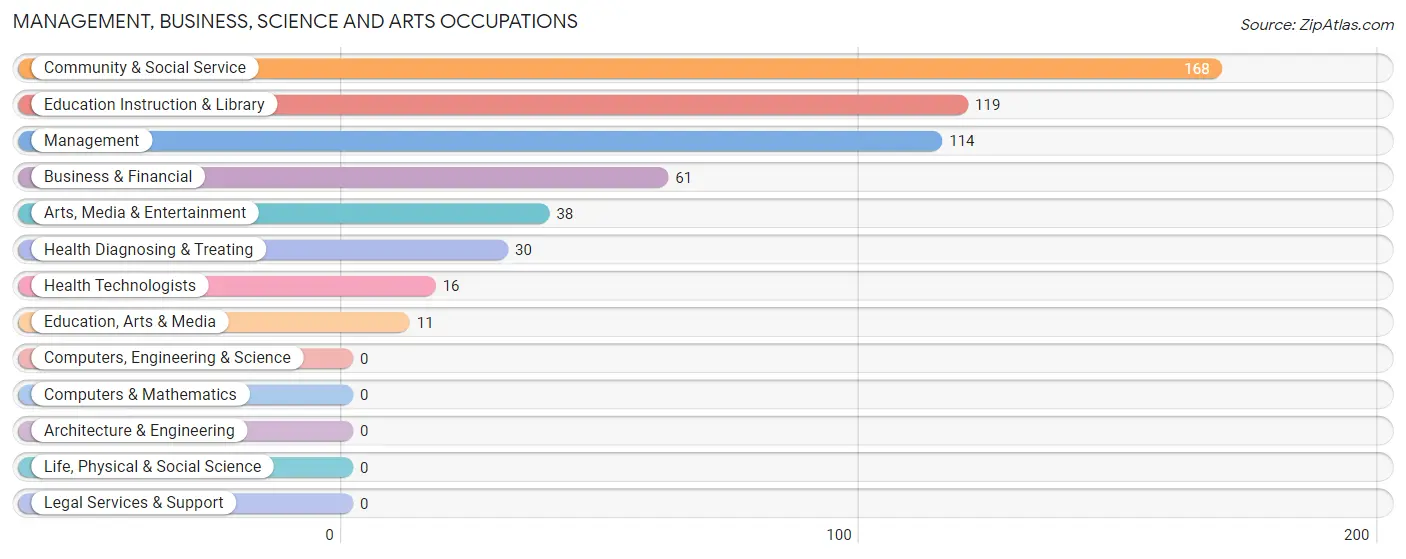
Management, Business, Science and Arts Occupations
The most common Management, Business, Science and Arts occupations in Rafter J Ranch are Community & Social Service (168 | 21.8%), Education Instruction & Library (119 | 15.5%), Management (114 | 14.8%), Business & Financial (61 | 7.9%), and Arts, Media & Entertainment (38 | 4.9%).
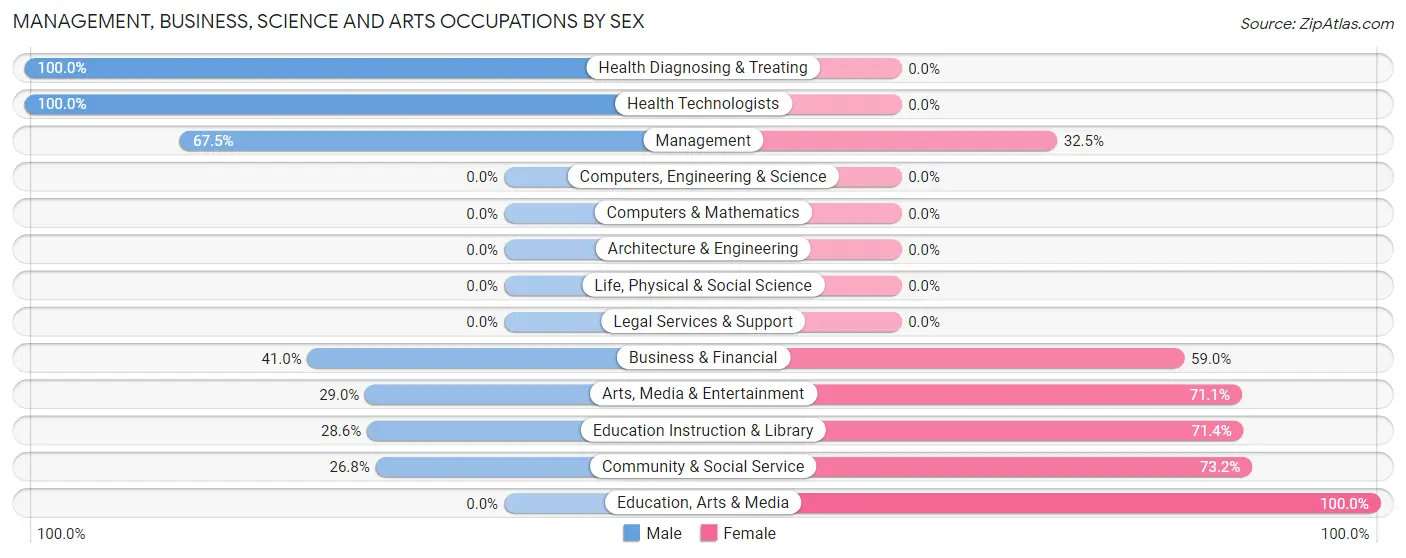
Management, Business, Science and Arts Occupations by Sex
Within the Management, Business, Science and Arts occupations in Rafter J Ranch, the most male-oriented occupations are Health Diagnosing & Treating (100.0%), Health Technologists (100.0%), and Management (67.5%), while the most female-oriented occupations are Education, Arts & Media (100.0%), Community & Social Service (73.2%), and Education Instruction & Library (71.4%).
| Occupation | Male | Female |
| Management | 77 (67.5%) | 37 (32.5%) |
| Business & Financial | 25 (41.0%) | 36 (59.0%) |
| Computers, Engineering & Science | 0 (0.0%) | 0 (0.0%) |
| Computers & Mathematics | 0 (0.0%) | 0 (0.0%) |
| Architecture & Engineering | 0 (0.0%) | 0 (0.0%) |
| Life, Physical & Social Science | 0 (0.0%) | 0 (0.0%) |
| Community & Social Service | 45 (26.8%) | 123 (73.2%) |
| Education, Arts & Media | 0 (0.0%) | 11 (100.0%) |
| Legal Services & Support | 0 (0.0%) | 0 (0.0%) |
| Education Instruction & Library | 34 (28.6%) | 85 (71.4%) |
| Arts, Media & Entertainment | 11 (28.9%) | 27 (71.1%) |
| Health Diagnosing & Treating | 30 (100.0%) | 0 (0.0%) |
| Health Technologists | 16 (100.0%) | 0 (0.0%) |
| Total (Category) | 177 (47.4%) | 196 (52.5%) |
| Total (Overall) | 427 (55.5%) | 342 (44.5%) |
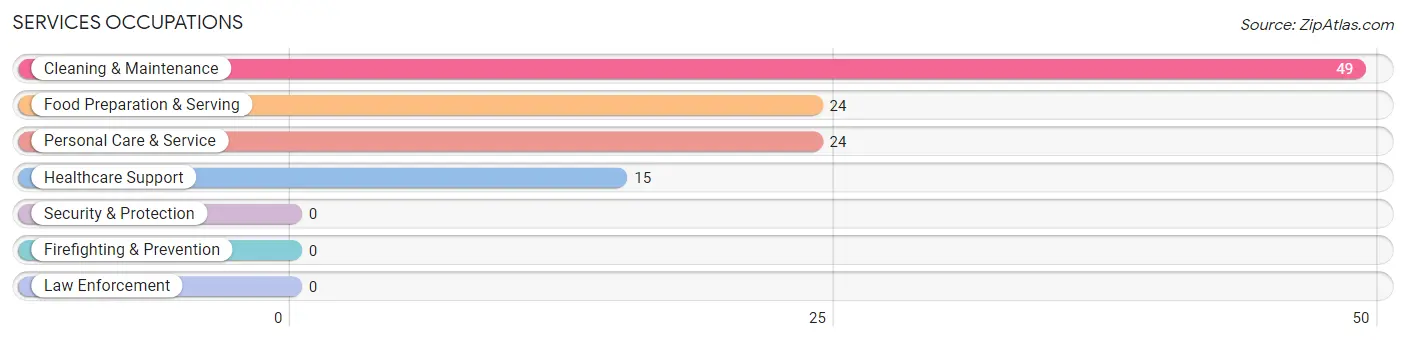
Services Occupations
The most common Services occupations in Rafter J Ranch are Cleaning & Maintenance (49 | 6.4%), Food Preparation & Serving (24 | 3.1%), Personal Care & Service (24 | 3.1%), and Healthcare Support (15 | 1.9%).
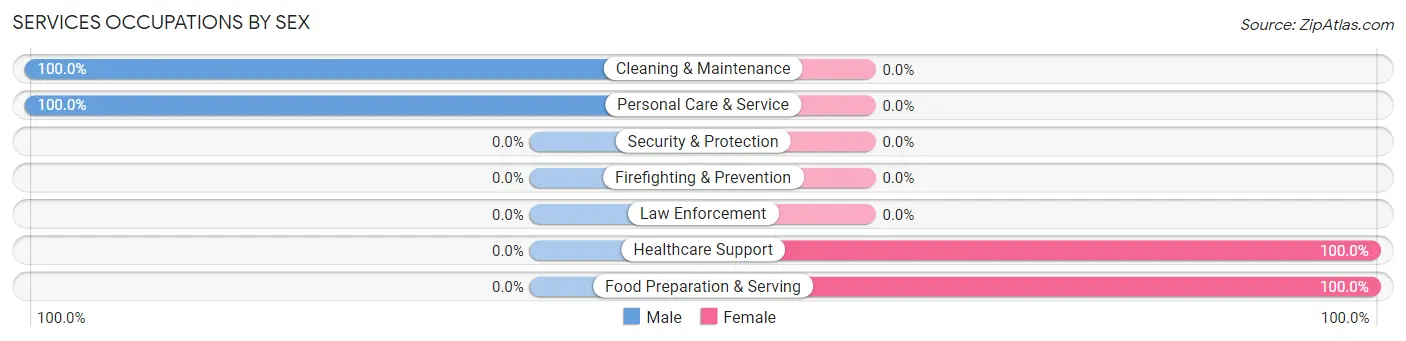
Services Occupations by Sex
Within the Services occupations in Rafter J Ranch, the most male-oriented occupations are Cleaning & Maintenance (100.0%), and Personal Care & Service (100.0%), while the most female-oriented occupations are Healthcare Support (100.0%), and Food Preparation & Serving (100.0%).
| Occupation | Male | Female |
| Healthcare Support | 0 (0.0%) | 15 (100.0%) |
| Security & Protection | 0 (0.0%) | 0 (0.0%) |
| Firefighting & Prevention | 0 (0.0%) | 0 (0.0%) |
| Law Enforcement | 0 (0.0%) | 0 (0.0%) |
| Food Preparation & Serving | 0 (0.0%) | 24 (100.0%) |
| Cleaning & Maintenance | 49 (100.0%) | 0 (0.0%) |
| Personal Care & Service | 24 (100.0%) | 0 (0.0%) |
| Total (Category) | 73 (65.2%) | 39 (34.8%) |
| Total (Overall) | 427 (55.5%) | 342 (44.5%) |
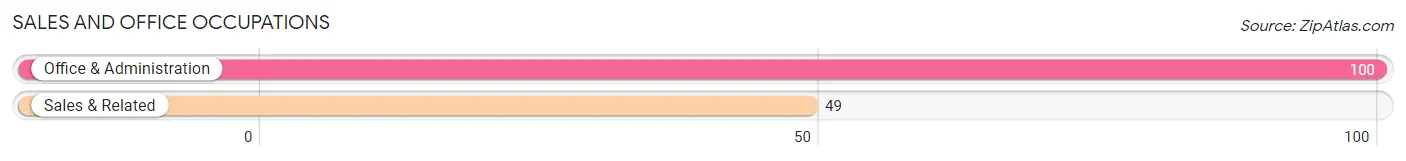
Sales and Office Occupations
The most common Sales and Office occupations in Rafter J Ranch are Office & Administration (100 | 13.0%), and Sales & Related (49 | 6.4%).
Sales and Office Occupations by Sex
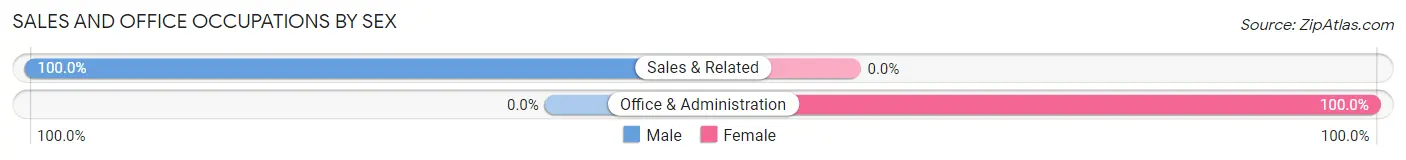
| Occupation | Male | Female |
| Sales & Related | 49 (100.0%) | 0 (0.0%) |
| Office & Administration | 0 (0.0%) | 100 (100.0%) |
| Total (Category) | 49 (32.9%) | 100 (67.1%) |
| Total (Overall) | 427 (55.5%) | 342 (44.5%) |
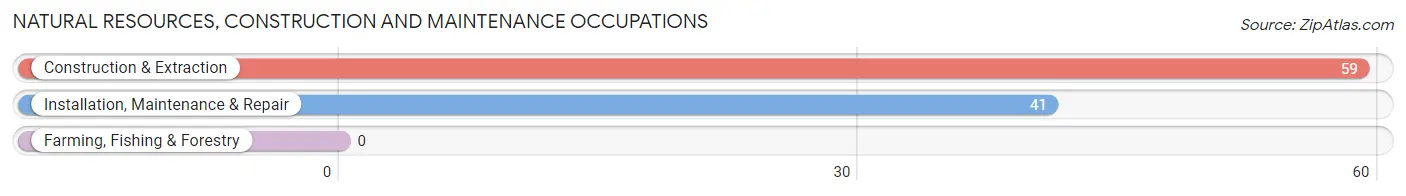
Natural Resources, Construction and Maintenance Occupations
The most common Natural Resources, Construction and Maintenance occupations in Rafter J Ranch are Construction & Extraction (59 | 7.7%), and Installation, Maintenance & Repair (41 | 5.3%).
Natural Resources, Construction and Maintenance Occupations by Sex
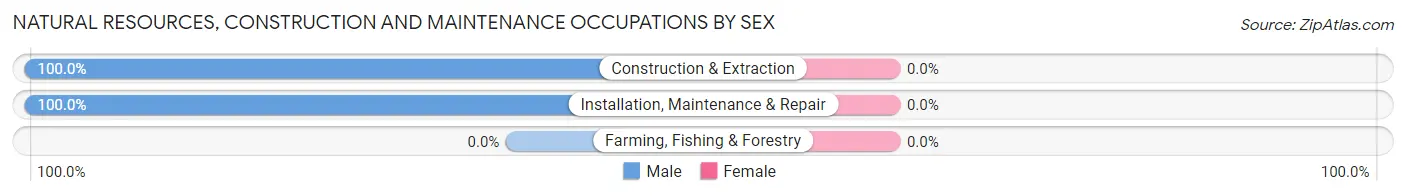
| Occupation | Male | Female |
| Farming, Fishing & Forestry | 0 (0.0%) | 0 (0.0%) |
| Construction & Extraction | 59 (100.0%) | 0 (0.0%) |
| Installation, Maintenance & Repair | 41 (100.0%) | 0 (0.0%) |
| Total (Category) | 100 (100.0%) | 0 (0.0%) |
| Total (Overall) | 427 (55.5%) | 342 (44.5%) |
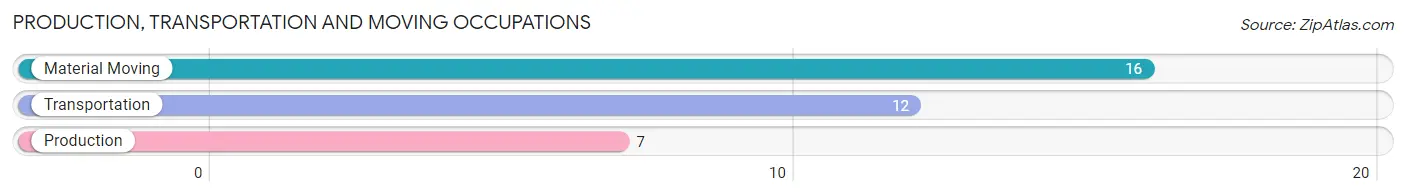
Production, Transportation and Moving Occupations
The most common Production, Transportation and Moving occupations in Rafter J Ranch are Material Moving (16 | 2.1%), Transportation (12 | 1.6%), and Production (7 | 0.9%).
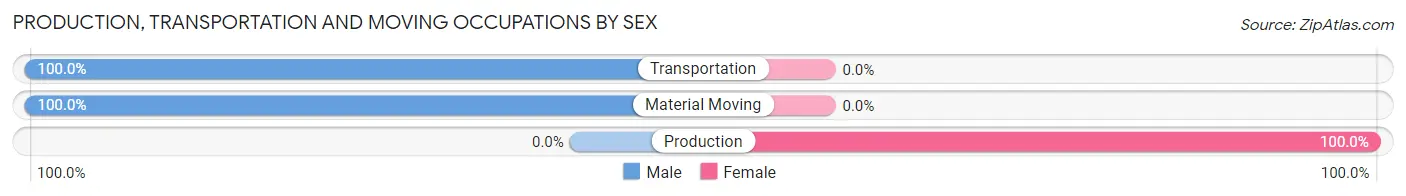
Production, Transportation and Moving Occupations by Sex
| Occupation | Male | Female |
| Production | 0 (0.0%) | 7 (100.0%) |
| Transportation | 12 (100.0%) | 0 (0.0%) |
| Material Moving | 16 (100.0%) | 0 (0.0%) |
| Total (Category) | 28 (80.0%) | 7 (20.0%) |
| Total (Overall) | 427 (55.5%) | 342 (44.5%) |
Employment Industries by Sex in Rafter J Ranch
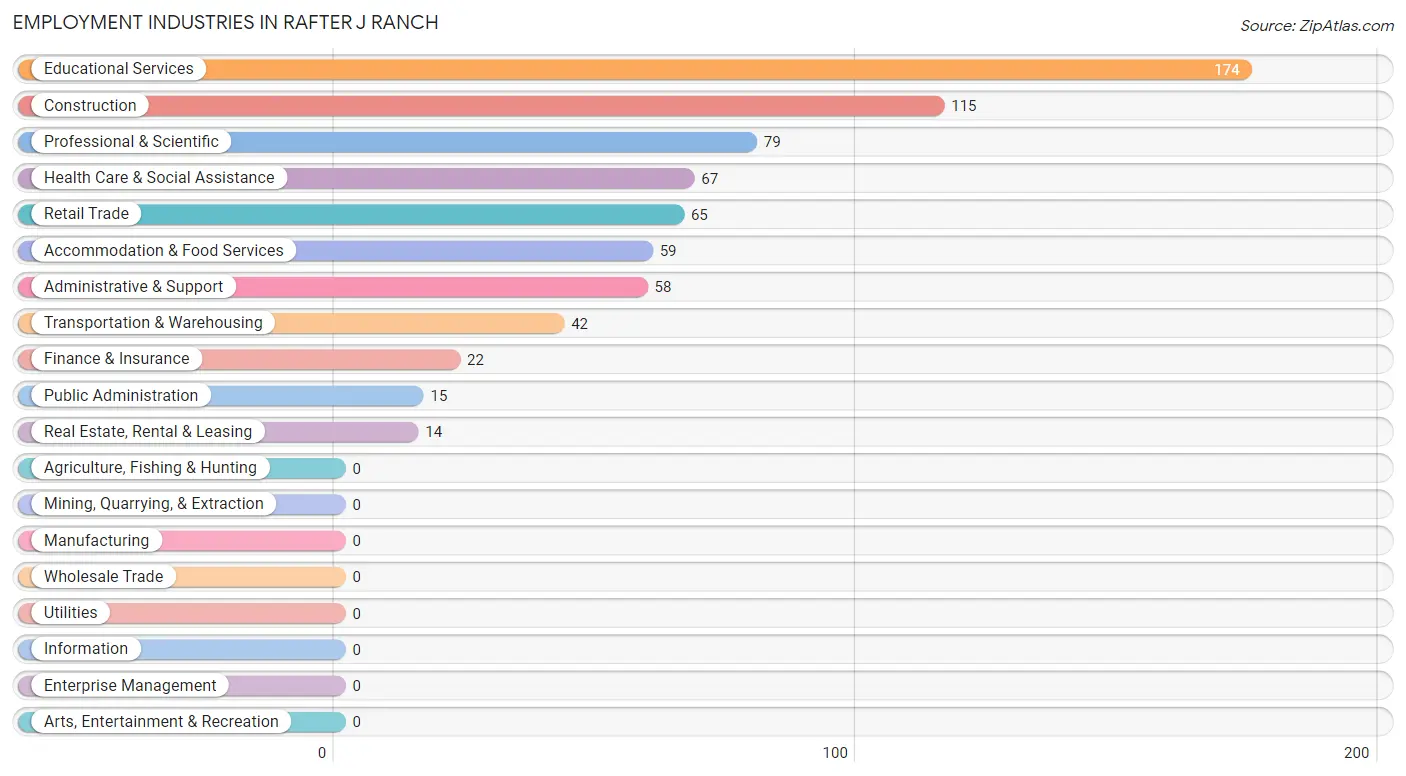
Employment Industries in Rafter J Ranch
The major employment industries in Rafter J Ranch include Educational Services (174 | 22.6%), Construction (115 | 14.9%), Professional & Scientific (79 | 10.3%), Health Care & Social Assistance (67 | 8.7%), and Retail Trade (65 | 8.5%).
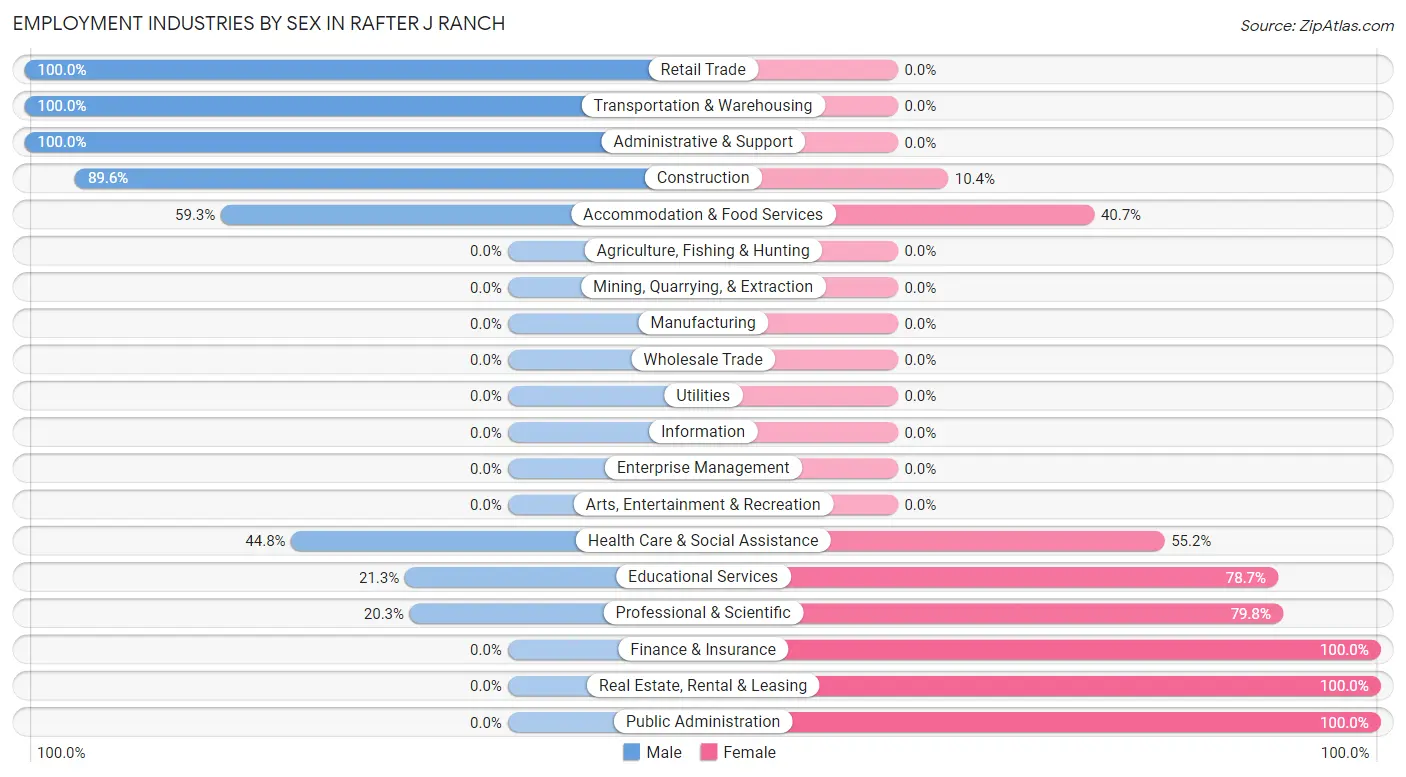
Employment Industries by Sex in Rafter J Ranch
The Rafter J Ranch industries that see more men than women are Retail Trade (100.0%), Transportation & Warehousing (100.0%), and Administrative & Support (100.0%), whereas the industries that tend to have a higher number of women are Finance & Insurance (100.0%), Real Estate, Rental & Leasing (100.0%), and Public Administration (100.0%).
| Industry | Male | Female |
| Agriculture, Fishing & Hunting | 0 (0.0%) | 0 (0.0%) |
| Mining, Quarrying, & Extraction | 0 (0.0%) | 0 (0.0%) |
| Construction | 103 (89.6%) | 12 (10.4%) |
| Manufacturing | 0 (0.0%) | 0 (0.0%) |
| Wholesale Trade | 0 (0.0%) | 0 (0.0%) |
| Retail Trade | 65 (100.0%) | 0 (0.0%) |
| Transportation & Warehousing | 42 (100.0%) | 0 (0.0%) |
| Utilities | 0 (0.0%) | 0 (0.0%) |
| Information | 0 (0.0%) | 0 (0.0%) |
| Finance & Insurance | 0 (0.0%) | 22 (100.0%) |
| Real Estate, Rental & Leasing | 0 (0.0%) | 14 (100.0%) |
| Professional & Scientific | 16 (20.3%) | 63 (79.7%) |
| Enterprise Management | 0 (0.0%) | 0 (0.0%) |
| Administrative & Support | 58 (100.0%) | 0 (0.0%) |
| Educational Services | 37 (21.3%) | 137 (78.7%) |
| Health Care & Social Assistance | 30 (44.8%) | 37 (55.2%) |
| Arts, Entertainment & Recreation | 0 (0.0%) | 0 (0.0%) |
| Accommodation & Food Services | 35 (59.3%) | 24 (40.7%) |
| Public Administration | 0 (0.0%) | 15 (100.0%) |
| Total | 427 (55.5%) | 342 (44.5%) |
Education in Rafter J Ranch
School Enrollment in Rafter J Ranch
The most common levels of schooling among the 127 students in Rafter J Ranch are elementary school (39 | 30.7%), high school (29 | 22.8%), and nursery / preschool (26 | 20.5%).
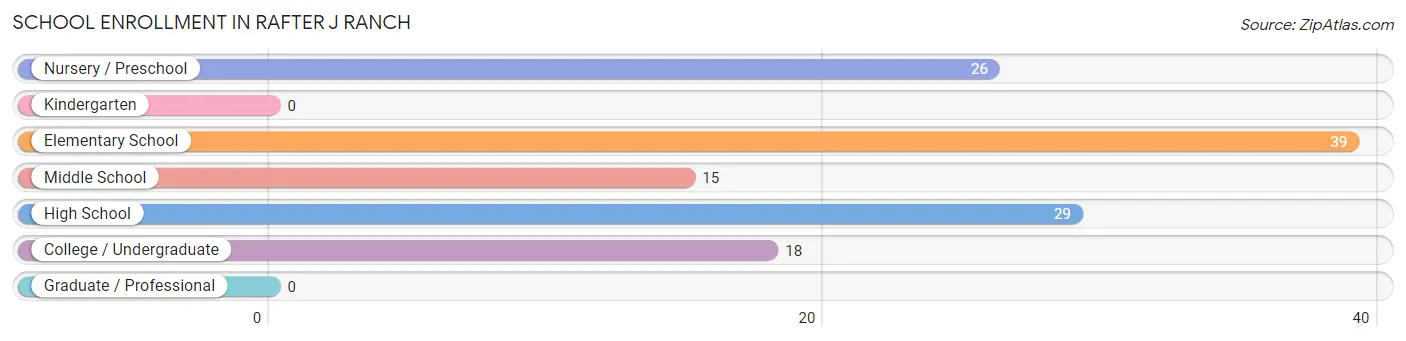
| School Level | # Students | % Students |
| Nursery / Preschool | 26 | 20.5% |
| Kindergarten | 0 | 0.0% |
| Elementary School | 39 | 30.7% |
| Middle School | 15 | 11.8% |
| High School | 29 | 22.8% |
| College / Undergraduate | 18 | 14.2% |
| Graduate / Professional | 0 | 0.0% |
| Total | 127 | 100.0% |
School Enrollment by Age by Funding Source in Rafter J Ranch
Out of a total of 127 students who are enrolled in schools in Rafter J Ranch, 34 (26.8%) attend a private institution, while the remaining 93 (73.2%) are enrolled in public schools. The age group of 3 to 4 year olds has the highest likelihood of being enrolled in private schools, with 26 (100.0% in the age bracket) enrolled. Conversely, the age group of 5 to 9 year old has the lowest likelihood of being enrolled in a private school, with 31 (100.0% in the age bracket) attending a public institution.
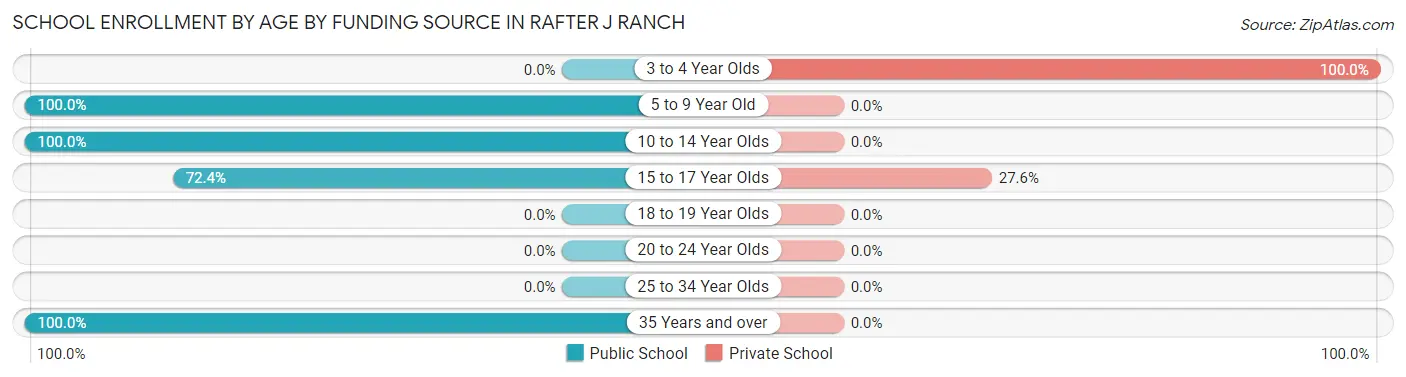
| Age Bracket | Public School | Private School |
| 3 to 4 Year Olds | 0 (0.0%) | 26 (100.0%) |
| 5 to 9 Year Old | 31 (100.0%) | 0 (0.0%) |
| 10 to 14 Year Olds | 23 (100.0%) | 0 (0.0%) |
| 15 to 17 Year Olds | 21 (72.4%) | 8 (27.6%) |
| 18 to 19 Year Olds | 0 (0.0%) | 0 (0.0%) |
| 20 to 24 Year Olds | 0 (0.0%) | 0 (0.0%) |
| 25 to 34 Year Olds | 0 (0.0%) | 0 (0.0%) |
| 35 Years and over | 18 (100.0%) | 0 (0.0%) |
| Total | 93 (73.2%) | 34 (26.8%) |
Educational Attainment by Field of Study in Rafter J Ranch
Bio, nature & agricultural (115 | 18.1%), business (96 | 15.1%), visual & performing arts (64 | 10.1%), literature & languages (61 | 9.6%), and education (56 | 8.8%) are the most common fields of study among 635 individuals in Rafter J Ranch who have obtained a bachelor's degree or higher.
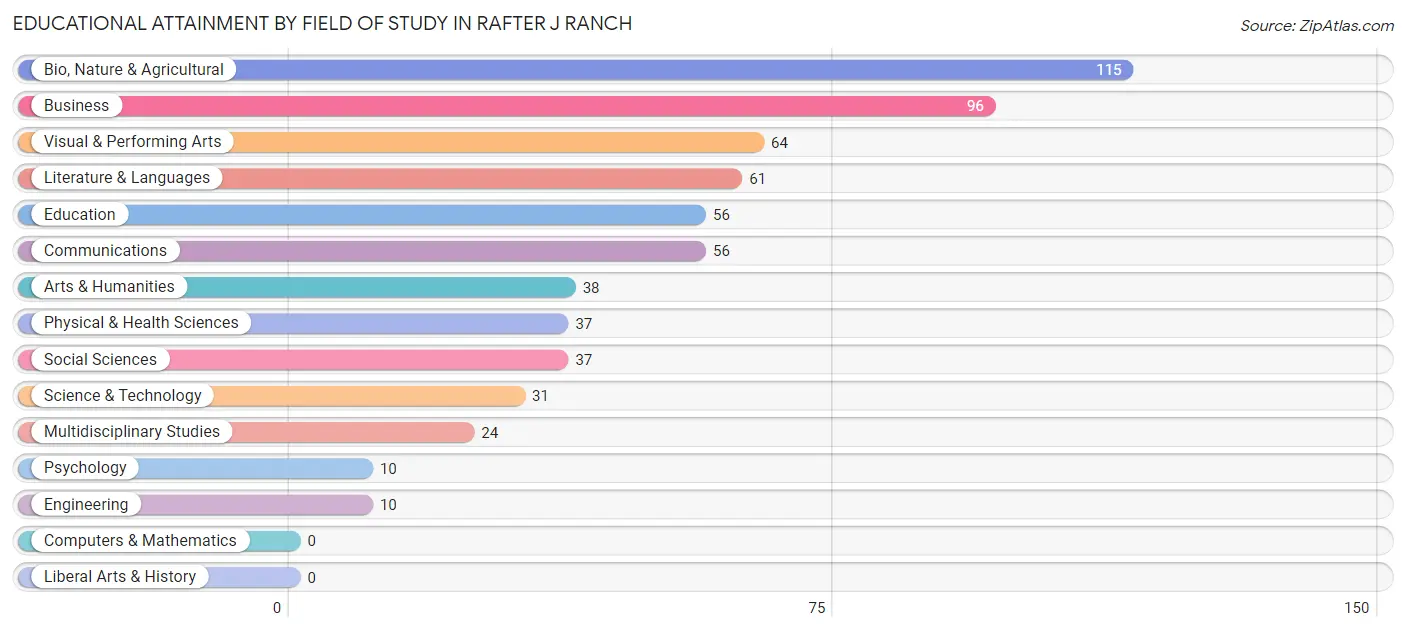
| Field of Study | # Graduates | % Graduates |
| Computers & Mathematics | 0 | 0.0% |
| Bio, Nature & Agricultural | 115 | 18.1% |
| Physical & Health Sciences | 37 | 5.8% |
| Psychology | 10 | 1.6% |
| Social Sciences | 37 | 5.8% |
| Engineering | 10 | 1.6% |
| Multidisciplinary Studies | 24 | 3.8% |
| Science & Technology | 31 | 4.9% |
| Business | 96 | 15.1% |
| Education | 56 | 8.8% |
| Literature & Languages | 61 | 9.6% |
| Liberal Arts & History | 0 | 0.0% |
| Visual & Performing Arts | 64 | 10.1% |
| Communications | 56 | 8.8% |
| Arts & Humanities | 38 | 6.0% |
| Total | 635 | 100.0% |
Transportation & Commute in Rafter J Ranch
Vehicle Availability by Sex in Rafter J Ranch
The most prevalent vehicle ownership categories in Rafter J Ranch are males with 2 vehicles (251, accounting for 64.4%) and females with 2 vehicles (164, making up 73.4%).
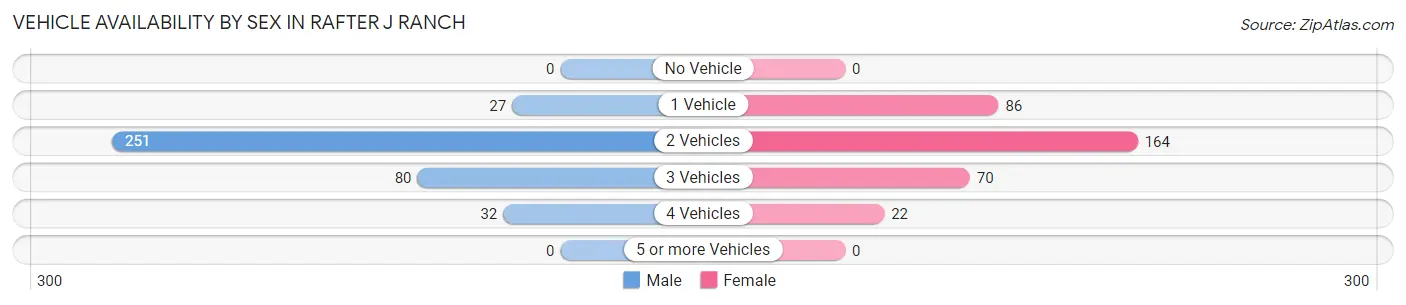
| Vehicles Available | Male | Female |
| No Vehicle | 0 (0.0%) | 0 (0.0%) |
| 1 Vehicle | 27 (6.9%) | 86 (25.2%) |
| 2 Vehicles | 251 (64.4%) | 164 (47.9%) |
| 3 Vehicles | 80 (20.5%) | 70 (20.5%) |
| 4 Vehicles | 32 (8.2%) | 22 (6.4%) |
| 5 or more Vehicles | 0 (0.0%) | 0 (0.0%) |
| Total | 390 (100.0%) | 342 (100.0%) |
Commute Time in Rafter J Ranch
The most frequently occuring commute durations in Rafter J Ranch are 10 to 14 minutes (271 commuters, 39.1%), 15 to 19 minutes (247 commuters, 35.6%), and 5 to 9 minutes (77 commuters, 11.1%).
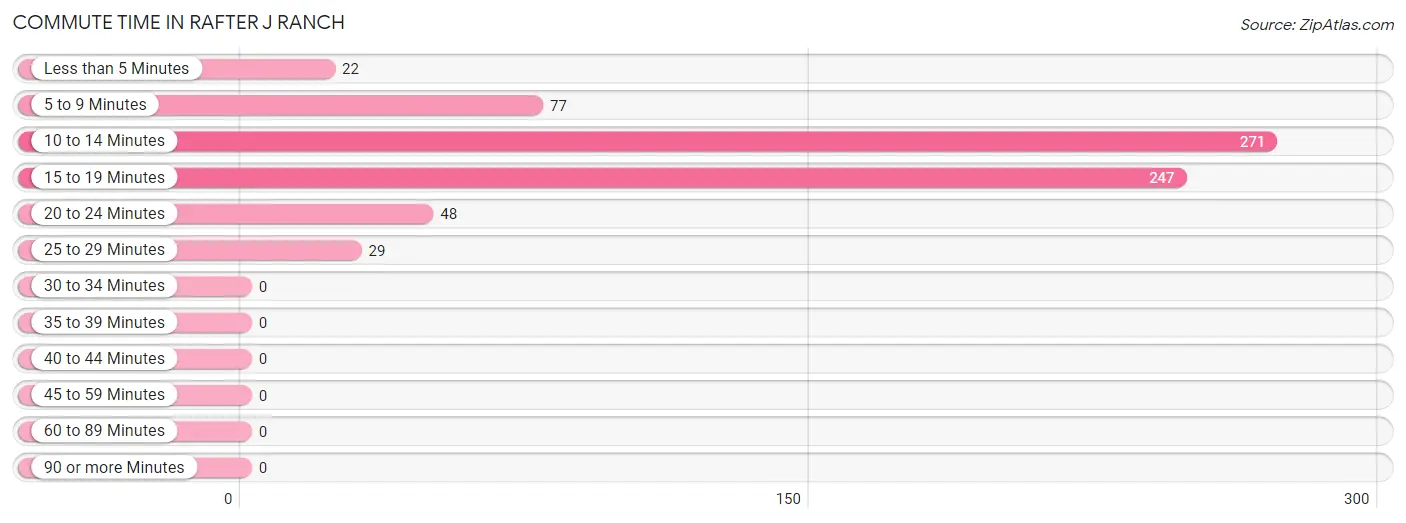
| Commute Time | # Commuters | % Commuters |
| Less than 5 Minutes | 22 | 3.2% |
| 5 to 9 Minutes | 77 | 11.1% |
| 10 to 14 Minutes | 271 | 39.1% |
| 15 to 19 Minutes | 247 | 35.6% |
| 20 to 24 Minutes | 48 | 6.9% |
| 25 to 29 Minutes | 29 | 4.2% |
| 30 to 34 Minutes | 0 | 0.0% |
| 35 to 39 Minutes | 0 | 0.0% |
| 40 to 44 Minutes | 0 | 0.0% |
| 45 to 59 Minutes | 0 | 0.0% |
| 60 to 89 Minutes | 0 | 0.0% |
| 90 or more Minutes | 0 | 0.0% |
Commute Time by Sex in Rafter J Ranch
The most common commute times in Rafter J Ranch are 10 to 14 minutes (142 commuters, 38.0%) for males and 10 to 14 minutes (129 commuters, 40.3%) for females.
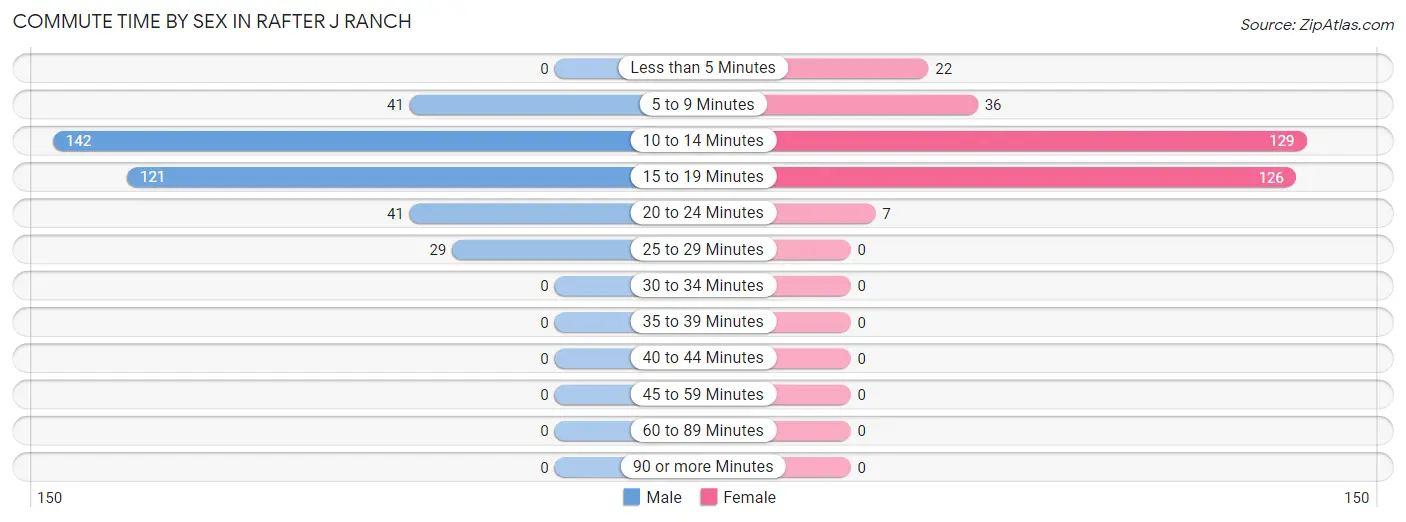
| Commute Time | Male | Female |
| Less than 5 Minutes | 0 (0.0%) | 22 (6.9%) |
| 5 to 9 Minutes | 41 (11.0%) | 36 (11.3%) |
| 10 to 14 Minutes | 142 (38.0%) | 129 (40.3%) |
| 15 to 19 Minutes | 121 (32.4%) | 126 (39.4%) |
| 20 to 24 Minutes | 41 (11.0%) | 7 (2.2%) |
| 25 to 29 Minutes | 29 (7.7%) | 0 (0.0%) |
| 30 to 34 Minutes | 0 (0.0%) | 0 (0.0%) |
| 35 to 39 Minutes | 0 (0.0%) | 0 (0.0%) |
| 40 to 44 Minutes | 0 (0.0%) | 0 (0.0%) |
| 45 to 59 Minutes | 0 (0.0%) | 0 (0.0%) |
| 60 to 89 Minutes | 0 (0.0%) | 0 (0.0%) |
| 90 or more Minutes | 0 (0.0%) | 0 (0.0%) |
Time of Departure to Work by Sex in Rafter J Ranch
The most frequent times of departure to work in Rafter J Ranch are 6:30 AM to 6:59 AM (79, 21.1%) for males and 7:30 AM to 7:59 AM (111, 34.7%) for females.
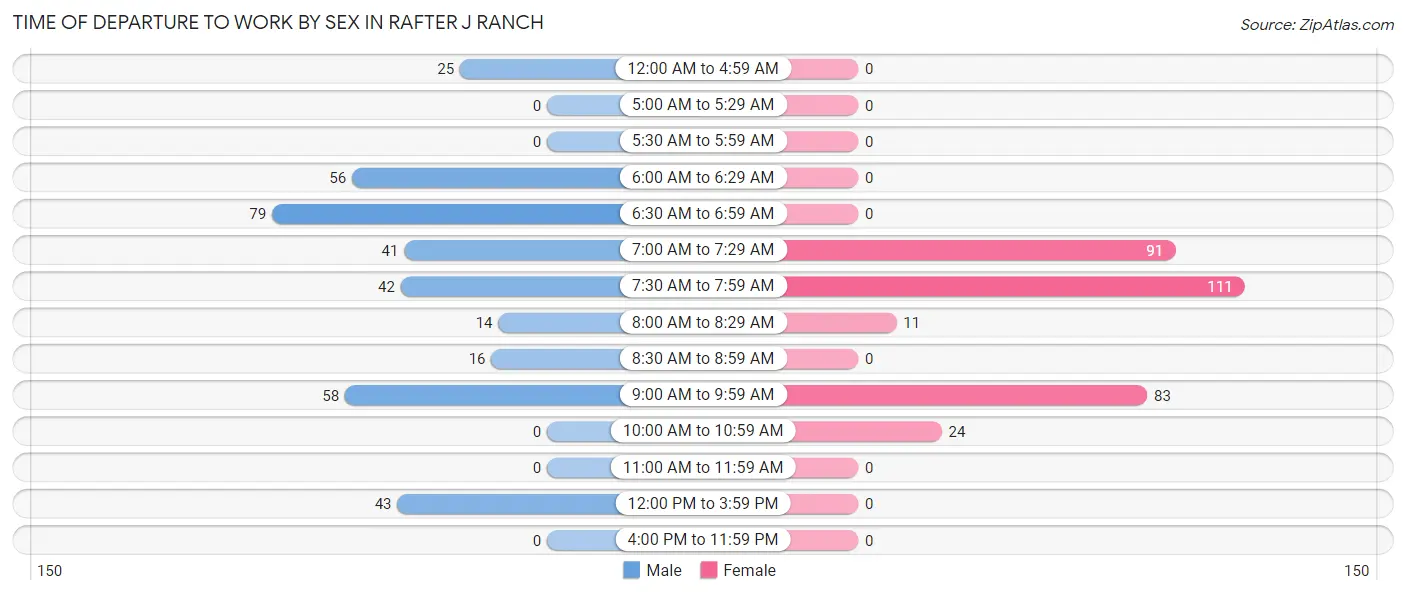
| Time of Departure | Male | Female |
| 12:00 AM to 4:59 AM | 25 (6.7%) | 0 (0.0%) |
| 5:00 AM to 5:29 AM | 0 (0.0%) | 0 (0.0%) |
| 5:30 AM to 5:59 AM | 0 (0.0%) | 0 (0.0%) |
| 6:00 AM to 6:29 AM | 56 (15.0%) | 0 (0.0%) |
| 6:30 AM to 6:59 AM | 79 (21.1%) | 0 (0.0%) |
| 7:00 AM to 7:29 AM | 41 (11.0%) | 91 (28.4%) |
| 7:30 AM to 7:59 AM | 42 (11.2%) | 111 (34.7%) |
| 8:00 AM to 8:29 AM | 14 (3.7%) | 11 (3.4%) |
| 8:30 AM to 8:59 AM | 16 (4.3%) | 0 (0.0%) |
| 9:00 AM to 9:59 AM | 58 (15.5%) | 83 (25.9%) |
| 10:00 AM to 10:59 AM | 0 (0.0%) | 24 (7.5%) |
| 11:00 AM to 11:59 AM | 0 (0.0%) | 0 (0.0%) |
| 12:00 PM to 3:59 PM | 43 (11.5%) | 0 (0.0%) |
| 4:00 PM to 11:59 PM | 0 (0.0%) | 0 (0.0%) |
| Total | 374 (100.0%) | 320 (100.0%) |
Housing Occupancy in Rafter J Ranch
Occupancy by Ownership in Rafter J Ranch
Of the total 591 dwellings in Rafter J Ranch, owner-occupied units account for 491 (83.1%), while renter-occupied units make up 100 (16.9%).
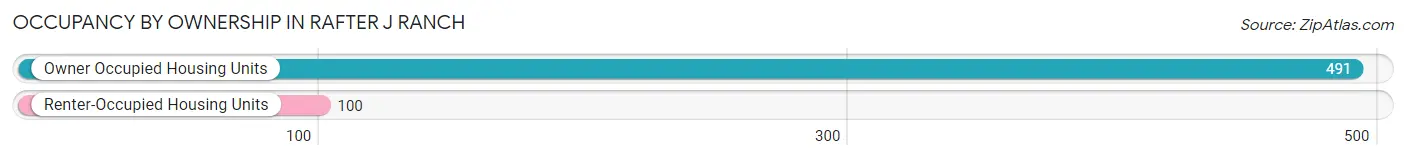
| Occupancy | # Housing Units | % Housing Units |
| Owner Occupied Housing Units | 491 | 83.1% |
| Renter-Occupied Housing Units | 100 | 16.9% |
| Total Occupied Housing Units | 591 | 100.0% |
Occupancy by Household Size in Rafter J Ranch
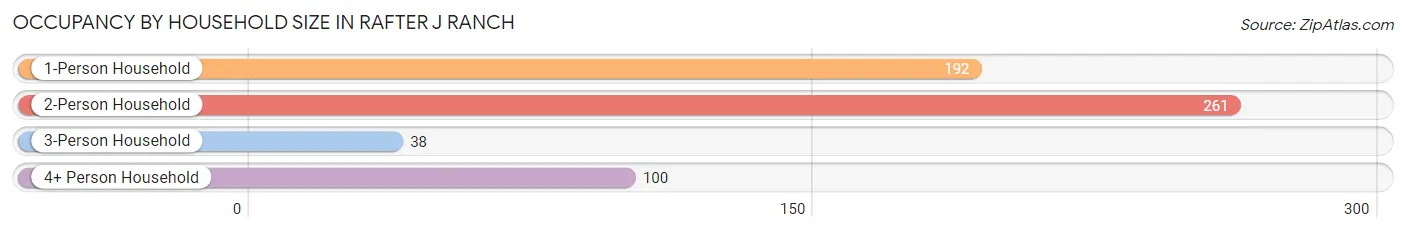
| Household Size | # Housing Units | % Housing Units |
| 1-Person Household | 192 | 32.5% |
| 2-Person Household | 261 | 44.2% |
| 3-Person Household | 38 | 6.4% |
| 4+ Person Household | 100 | 16.9% |
| Total Housing Units | 591 | 100.0% |
Occupancy by Ownership by Household Size in Rafter J Ranch
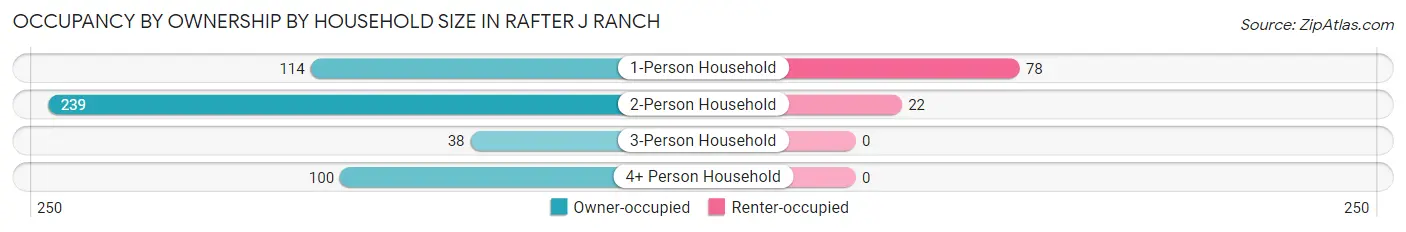
| Household Size | Owner-occupied | Renter-occupied |
| 1-Person Household | 114 (59.4%) | 78 (40.6%) |
| 2-Person Household | 239 (91.6%) | 22 (8.4%) |
| 3-Person Household | 38 (100.0%) | 0 (0.0%) |
| 4+ Person Household | 100 (100.0%) | 0 (0.0%) |
| Total Housing Units | 491 (83.1%) | 100 (16.9%) |
Occupancy by Educational Attainment in Rafter J Ranch
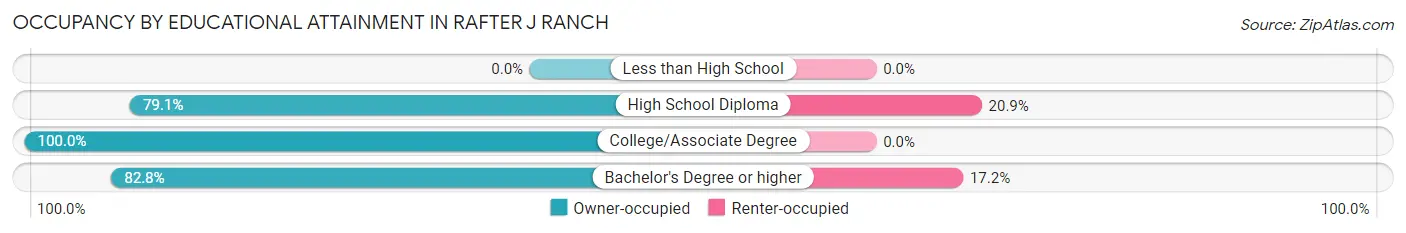
| Household Size | Owner-occupied | Renter-occupied |
| Less than High School | 0 (0.0%) | 0 (0.0%) |
| High School Diploma | 159 (79.1%) | 42 (20.9%) |
| College/Associate Degree | 53 (100.0%) | 0 (0.0%) |
| Bachelor's Degree or higher | 279 (82.8%) | 58 (17.2%) |
Occupancy by Age of Householder in Rafter J Ranch
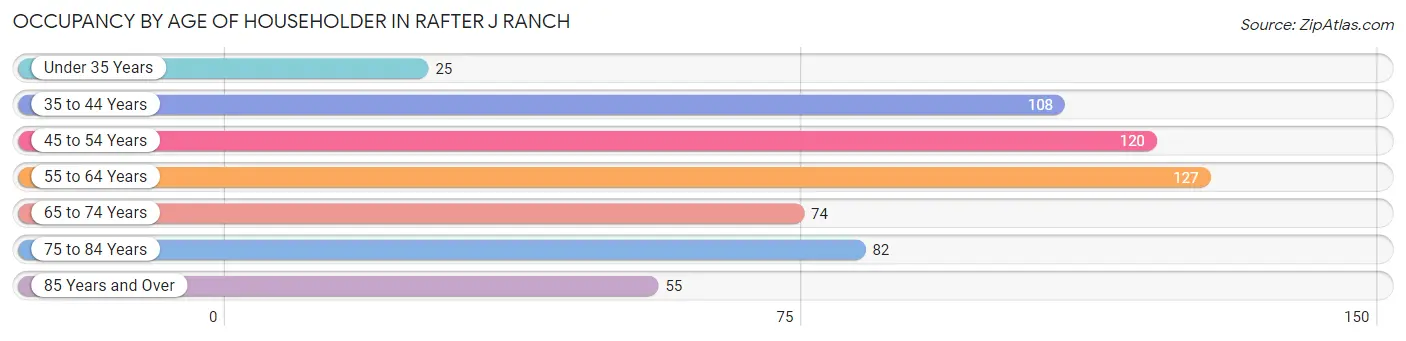
| Age Bracket | # Households | % Households |
| Under 35 Years | 25 | 4.2% |
| 35 to 44 Years | 108 | 18.3% |
| 45 to 54 Years | 120 | 20.3% |
| 55 to 64 Years | 127 | 21.5% |
| 65 to 74 Years | 74 | 12.5% |
| 75 to 84 Years | 82 | 13.9% |
| 85 Years and Over | 55 | 9.3% |
| Total | 591 | 100.0% |
Housing Finances in Rafter J Ranch
Median Income by Occupancy in Rafter J Ranch
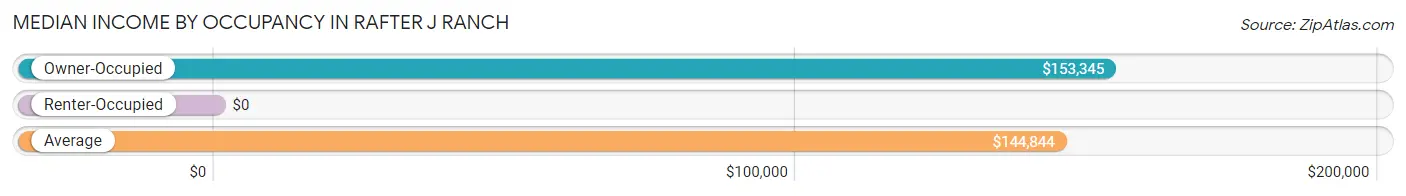
| Occupancy Type | # Households | Median Income |
| Owner-Occupied | 491 (83.1%) | $153,345 |
| Renter-Occupied | 100 (16.9%) | $0 |
| Average | 591 (100.0%) | $144,844 |
Occupancy by Householder Income Bracket in Rafter J Ranch
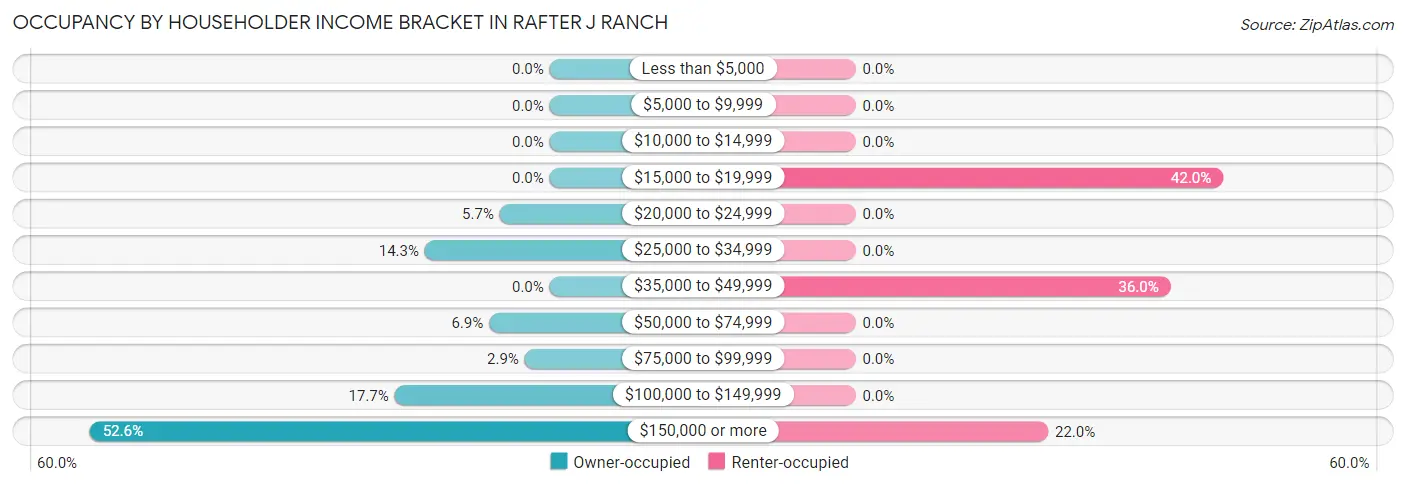
| Income Bracket | Owner-occupied | Renter-occupied |
| Less than $5,000 | 0 (0.0%) | 0 (0.0%) |
| $5,000 to $9,999 | 0 (0.0%) | 0 (0.0%) |
| $10,000 to $14,999 | 0 (0.0%) | 0 (0.0%) |
| $15,000 to $19,999 | 0 (0.0%) | 42 (42.0%) |
| $20,000 to $24,999 | 28 (5.7%) | 0 (0.0%) |
| $25,000 to $34,999 | 70 (14.3%) | 0 (0.0%) |
| $35,000 to $49,999 | 0 (0.0%) | 36 (36.0%) |
| $50,000 to $74,999 | 34 (6.9%) | 0 (0.0%) |
| $75,000 to $99,999 | 14 (2.9%) | 0 (0.0%) |
| $100,000 to $149,999 | 87 (17.7%) | 0 (0.0%) |
| $150,000 or more | 258 (52.5%) | 22 (22.0%) |
| Total | 491 (100.0%) | 100 (100.0%) |
Monthly Housing Cost Tiers in Rafter J Ranch
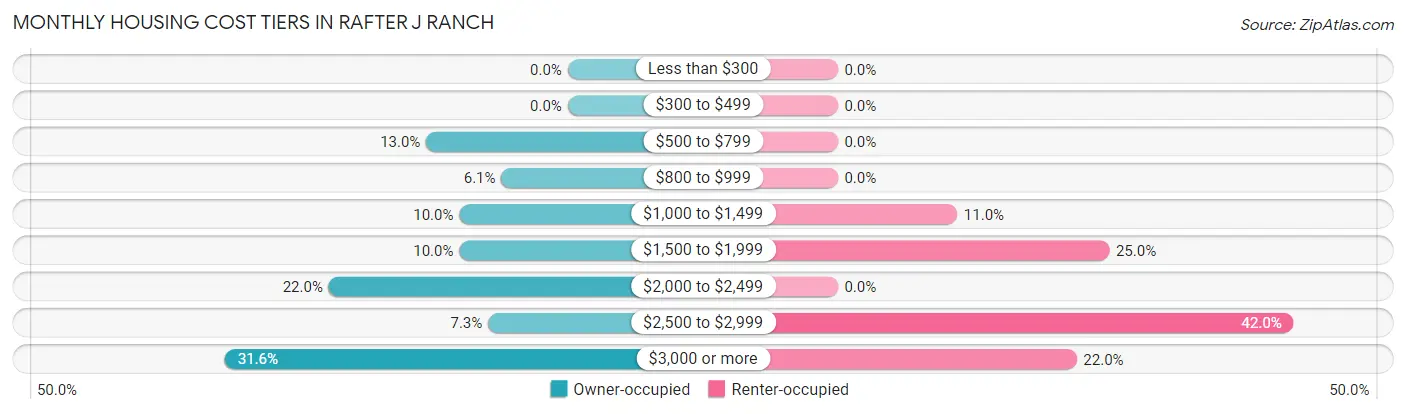
| Monthly Cost | Owner-occupied | Renter-occupied |
| Less than $300 | 0 (0.0%) | 0 (0.0%) |
| $300 to $499 | 0 (0.0%) | 0 (0.0%) |
| $500 to $799 | 64 (13.0%) | 0 (0.0%) |
| $800 to $999 | 30 (6.1%) | 0 (0.0%) |
| $1,000 to $1,499 | 49 (10.0%) | 11 (11.0%) |
| $1,500 to $1,999 | 49 (10.0%) | 25 (25.0%) |
| $2,000 to $2,499 | 108 (22.0%) | 0 (0.0%) |
| $2,500 to $2,999 | 36 (7.3%) | 42 (42.0%) |
| $3,000 or more | 155 (31.6%) | 22 (22.0%) |
| Total | 491 (100.0%) | 100 (100.0%) |
Physical Housing Characteristics in Rafter J Ranch
Housing Structures in Rafter J Ranch
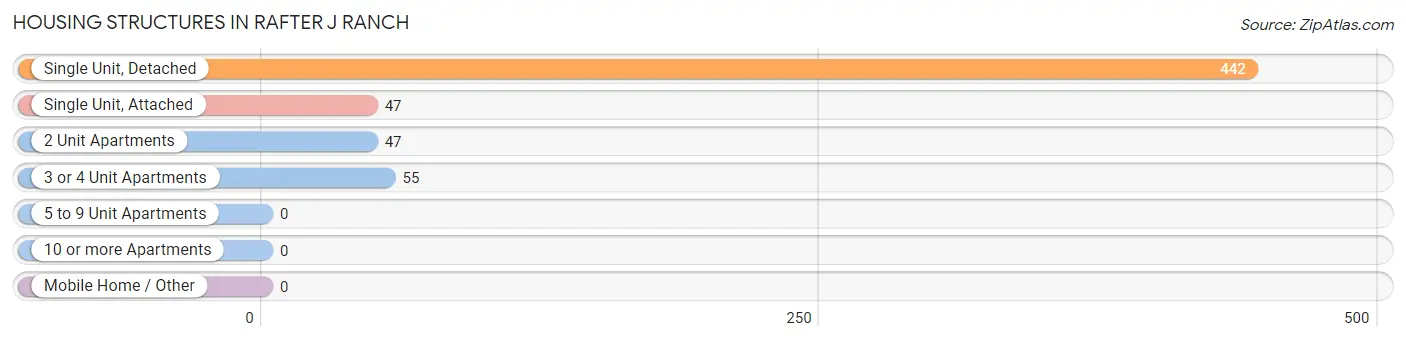
| Structure Type | # Housing Units | % Housing Units |
| Single Unit, Detached | 442 | 74.8% |
| Single Unit, Attached | 47 | 8.0% |
| 2 Unit Apartments | 47 | 8.0% |
| 3 or 4 Unit Apartments | 55 | 9.3% |
| 5 to 9 Unit Apartments | 0 | 0.0% |
| 10 or more Apartments | 0 | 0.0% |
| Mobile Home / Other | 0 | 0.0% |
| Total | 591 | 100.0% |
Housing Structures by Occupancy in Rafter J Ranch
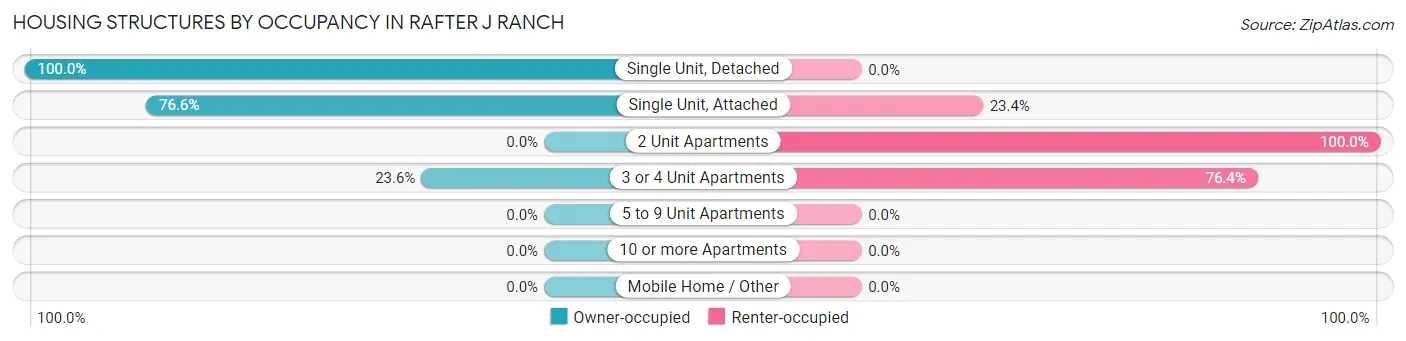
| Structure Type | Owner-occupied | Renter-occupied |
| Single Unit, Detached | 442 (100.0%) | 0 (0.0%) |
| Single Unit, Attached | 36 (76.6%) | 11 (23.4%) |
| 2 Unit Apartments | 0 (0.0%) | 47 (100.0%) |
| 3 or 4 Unit Apartments | 13 (23.6%) | 42 (76.4%) |
| 5 to 9 Unit Apartments | 0 (0.0%) | 0 (0.0%) |
| 10 or more Apartments | 0 (0.0%) | 0 (0.0%) |
| Mobile Home / Other | 0 (0.0%) | 0 (0.0%) |
| Total | 491 (83.1%) | 100 (16.9%) |
Housing Structures by Number of Rooms in Rafter J Ranch
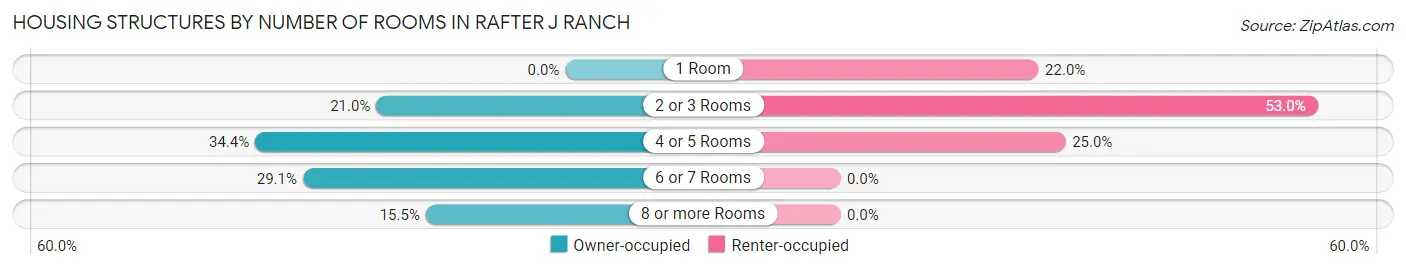
| Number of Rooms | Owner-occupied | Renter-occupied |
| 1 Room | 0 (0.0%) | 22 (22.0%) |
| 2 or 3 Rooms | 103 (21.0%) | 53 (53.0%) |
| 4 or 5 Rooms | 169 (34.4%) | 25 (25.0%) |
| 6 or 7 Rooms | 143 (29.1%) | 0 (0.0%) |
| 8 or more Rooms | 76 (15.5%) | 0 (0.0%) |
| Total | 491 (100.0%) | 100 (100.0%) |
Housing Structure by Heating Type in Rafter J Ranch
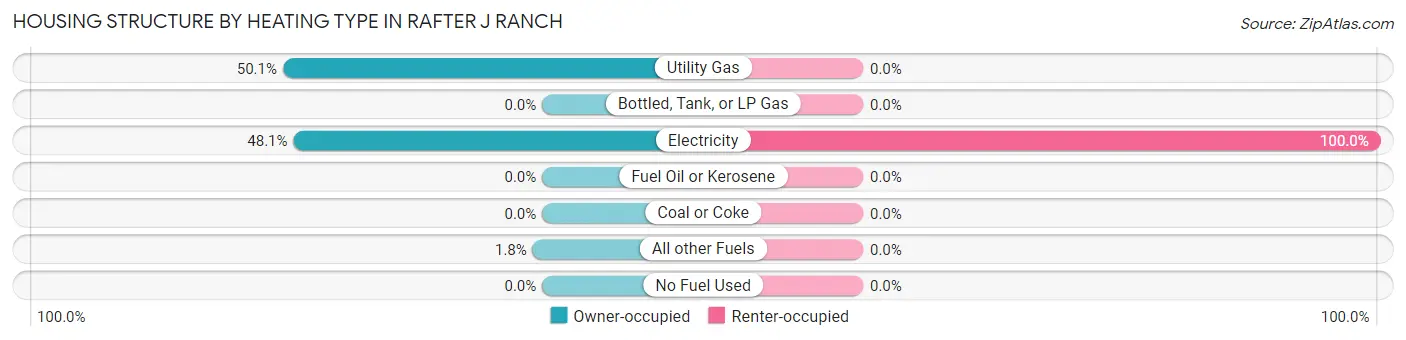
| Heating Type | Owner-occupied | Renter-occupied |
| Utility Gas | 246 (50.1%) | 0 (0.0%) |
| Bottled, Tank, or LP Gas | 0 (0.0%) | 0 (0.0%) |
| Electricity | 236 (48.1%) | 100 (100.0%) |
| Fuel Oil or Kerosene | 0 (0.0%) | 0 (0.0%) |
| Coal or Coke | 0 (0.0%) | 0 (0.0%) |
| All other Fuels | 9 (1.8%) | 0 (0.0%) |
| No Fuel Used | 0 (0.0%) | 0 (0.0%) |
| Total | 491 (100.0%) | 100 (100.0%) |
Household Vehicle Usage in Rafter J Ranch
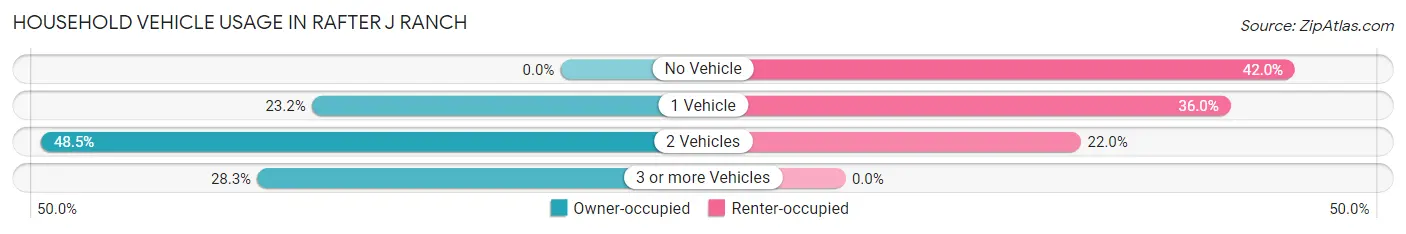
| Vehicles per Household | Owner-occupied | Renter-occupied |
| No Vehicle | 0 (0.0%) | 42 (42.0%) |
| 1 Vehicle | 114 (23.2%) | 36 (36.0%) |
| 2 Vehicles | 238 (48.5%) | 22 (22.0%) |
| 3 or more Vehicles | 139 (28.3%) | 0 (0.0%) |
| Total | 491 (100.0%) | 100 (100.0%) |
Real Estate & Mortgages in Rafter J Ranch
Real Estate and Mortgage Overview in Rafter J Ranch
| Characteristic | Without Mortgage | With Mortgage |
| Housing Units | 143 | 348 |
| Median Property Value | $1,103,300 | $871,400 |
| Median Household Income | $157,443 | $165 |
| Monthly Housing Costs | $1,108 | $155 |
| Real Estate Taxes | $6,493 | $0 |
Property Value by Mortgage Status in Rafter J Ranch
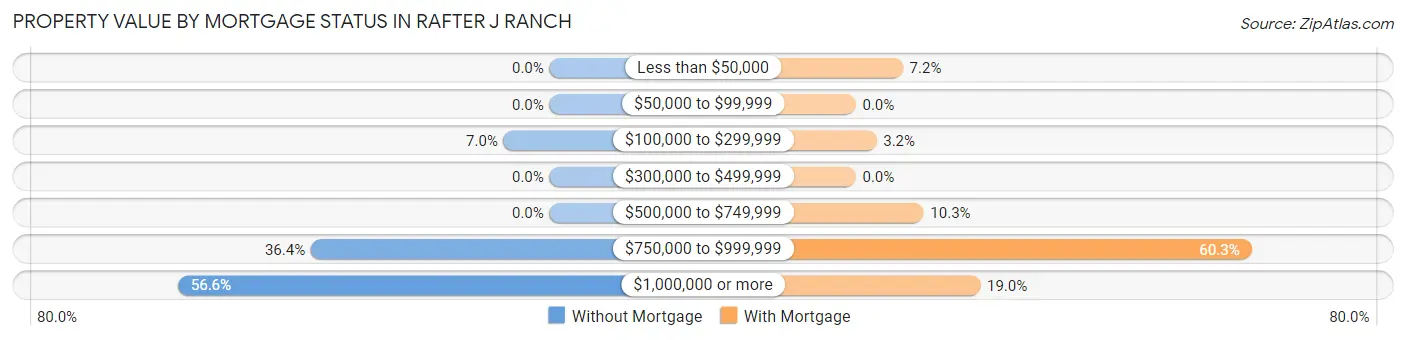
| Property Value | Without Mortgage | With Mortgage |
| Less than $50,000 | 0 (0.0%) | 25 (7.2%) |
| $50,000 to $99,999 | 0 (0.0%) | 0 (0.0%) |
| $100,000 to $299,999 | 10 (7.0%) | 11 (3.2%) |
| $300,000 to $499,999 | 0 (0.0%) | 0 (0.0%) |
| $500,000 to $749,999 | 0 (0.0%) | 36 (10.3%) |
| $750,000 to $999,999 | 52 (36.4%) | 210 (60.3%) |
| $1,000,000 or more | 81 (56.6%) | 66 (19.0%) |
| Total | 143 (100.0%) | 348 (100.0%) |
Household Income by Mortgage Status in Rafter J Ranch
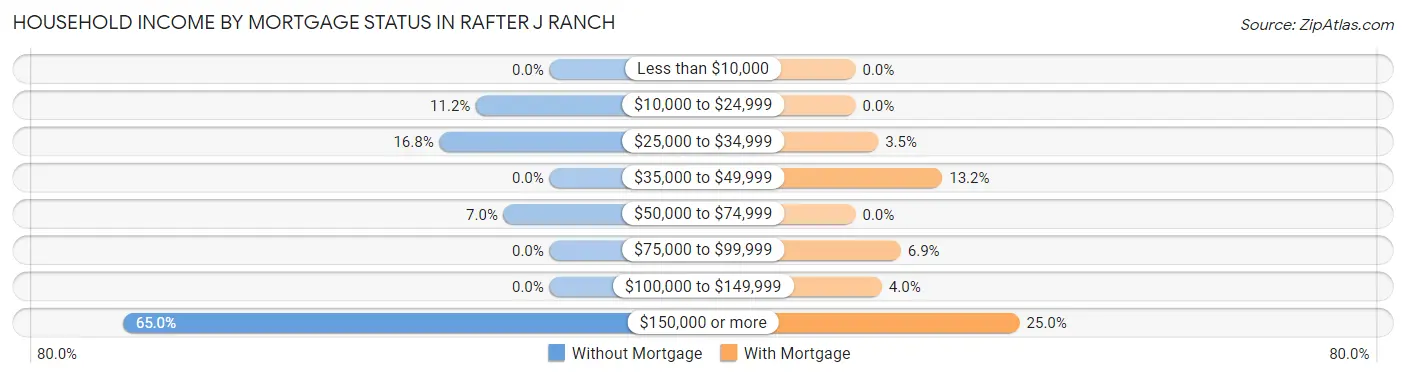
| Household Income | Without Mortgage | With Mortgage |
| Less than $10,000 | 0 (0.0%) | 0 (0.0%) |
| $10,000 to $24,999 | 16 (11.2%) | 0 (0.0%) |
| $25,000 to $34,999 | 24 (16.8%) | 12 (3.5%) |
| $35,000 to $49,999 | 0 (0.0%) | 46 (13.2%) |
| $50,000 to $74,999 | 10 (7.0%) | 0 (0.0%) |
| $75,000 to $99,999 | 0 (0.0%) | 24 (6.9%) |
| $100,000 to $149,999 | 0 (0.0%) | 14 (4.0%) |
| $150,000 or more | 93 (65.0%) | 87 (25.0%) |
| Total | 143 (100.0%) | 348 (100.0%) |
Property Value to Household Income Ratio in Rafter J Ranch
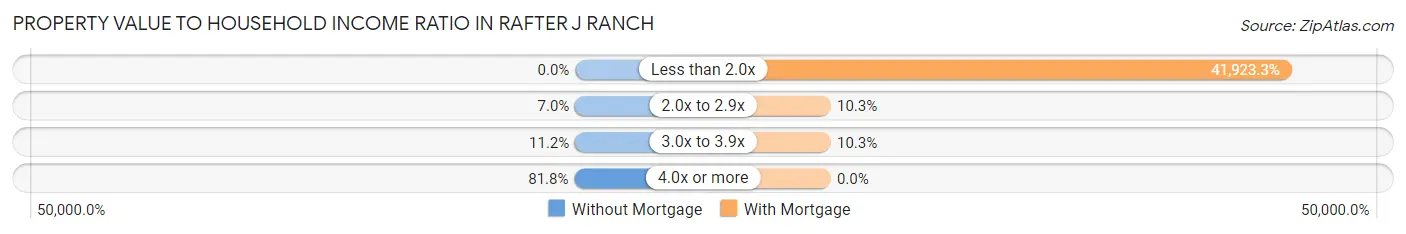
| Value-to-Income Ratio | Without Mortgage | With Mortgage |
| Less than 2.0x | 0 (0.0%) | 145,893 (41,923.3%) |
| 2.0x to 2.9x | 10 (7.0%) | 36 (10.3%) |
| 3.0x to 3.9x | 16 (11.2%) | 36 (10.3%) |
| 4.0x or more | 117 (81.8%) | 0 (0.0%) |
| Total | 143 (100.0%) | 348 (100.0%) |
Real Estate Taxes by Mortgage Status in Rafter J Ranch
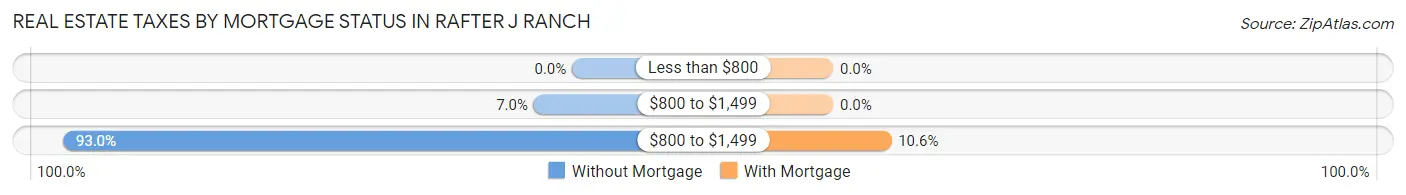
| Property Taxes | Without Mortgage | With Mortgage |
| Less than $800 | 0 (0.0%) | 0 (0.0%) |
| $800 to $1,499 | 10 (7.0%) | 0 (0.0%) |
| $800 to $1,499 | 133 (93.0%) | 37 (10.6%) |
| Total | 143 (100.0%) | 348 (100.0%) |
Health & Disability in Rafter J Ranch
Health Insurance Coverage by Age in Rafter J Ranch
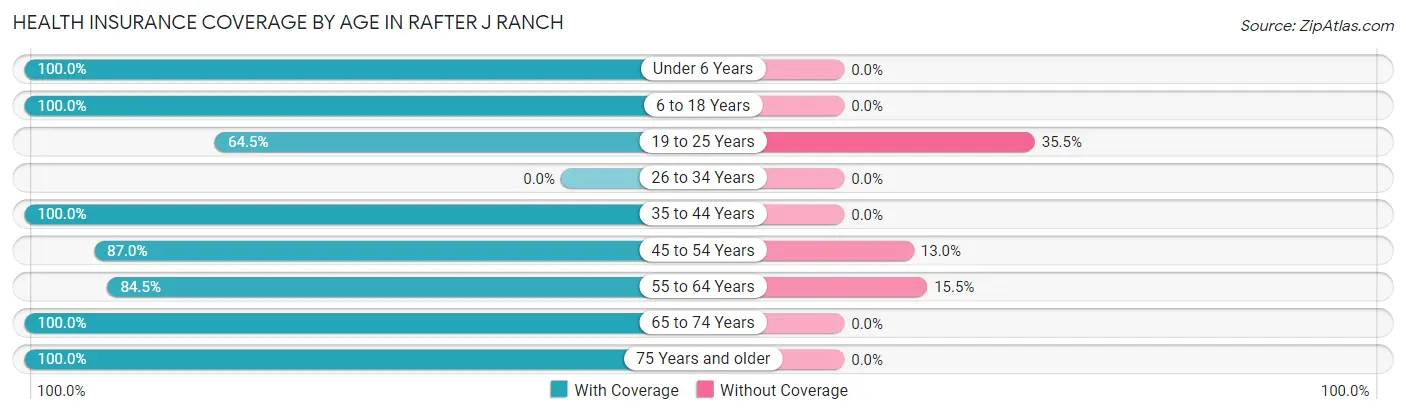
| Age Bracket | With Coverage | Without Coverage |
| Under 6 Years | 46 (100.0%) | 0 (0.0%) |
| 6 to 18 Years | 83 (100.0%) | 0 (0.0%) |
| 19 to 25 Years | 49 (64.5%) | 27 (35.5%) |
| 26 to 34 Years | 0 (0.0%) | 0 (0.0%) |
| 35 to 44 Years | 256 (100.0%) | 0 (0.0%) |
| 45 to 54 Years | 208 (87.0%) | 31 (13.0%) |
| 55 to 64 Years | 164 (84.5%) | 30 (15.5%) |
| 65 to 74 Years | 134 (100.0%) | 0 (0.0%) |
| 75 Years and older | 188 (100.0%) | 0 (0.0%) |
| Total | 1,128 (92.8%) | 88 (7.2%) |
Health Insurance Coverage by Citizenship Status in Rafter J Ranch
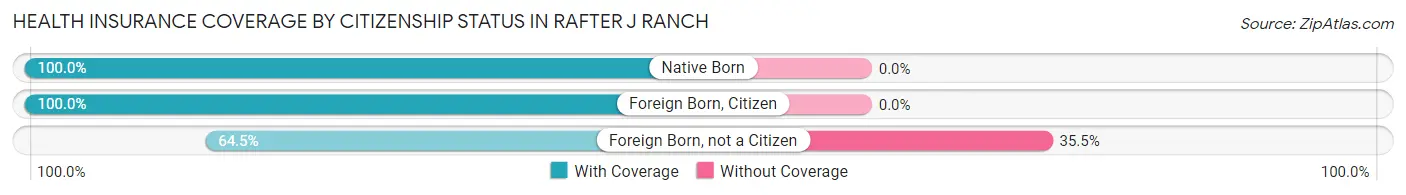
| Citizenship Status | With Coverage | Without Coverage |
| Native Born | 46 (100.0%) | 0 (0.0%) |
| Foreign Born, Citizen | 83 (100.0%) | 0 (0.0%) |
| Foreign Born, not a Citizen | 49 (64.5%) | 27 (35.5%) |
Health Insurance Coverage by Household Income in Rafter J Ranch
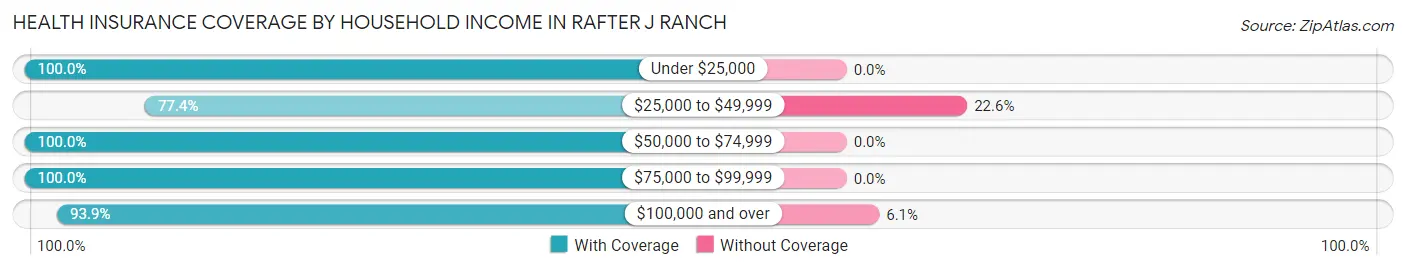
| Household Income | With Coverage | Without Coverage |
| Under $25,000 | 70 (100.0%) | 0 (0.0%) |
| $25,000 to $49,999 | 103 (77.4%) | 30 (22.6%) |
| $50,000 to $74,999 | 34 (100.0%) | 0 (0.0%) |
| $75,000 to $99,999 | 26 (100.0%) | 0 (0.0%) |
| $100,000 and over | 895 (93.9%) | 58 (6.1%) |
Public vs Private Health Insurance Coverage by Age in Rafter J Ranch
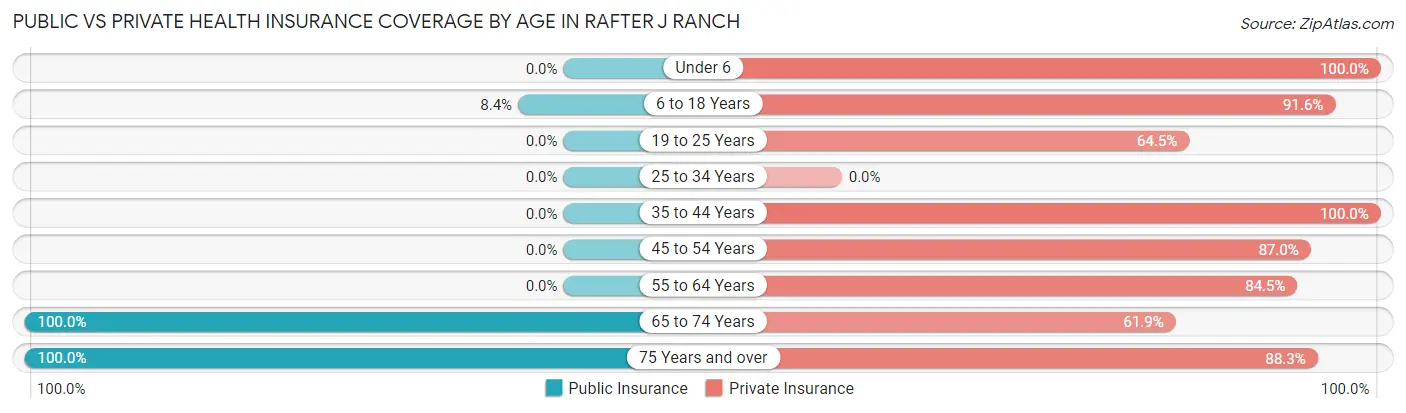
| Age Bracket | Public Insurance | Private Insurance |
| Under 6 | 0 (0.0%) | 46 (100.0%) |
| 6 to 18 Years | 7 (8.4%) | 76 (91.6%) |
| 19 to 25 Years | 0 (0.0%) | 49 (64.5%) |
| 25 to 34 Years | 0 (0.0%) | 0 (0.0%) |
| 35 to 44 Years | 0 (0.0%) | 256 (100.0%) |
| 45 to 54 Years | 0 (0.0%) | 208 (87.0%) |
| 55 to 64 Years | 0 (0.0%) | 164 (84.5%) |
| 65 to 74 Years | 134 (100.0%) | 83 (61.9%) |
| 75 Years and over | 188 (100.0%) | 166 (88.3%) |
| Total | 329 (27.1%) | 1,048 (86.2%) |
Disability Status by Sex by Age in Rafter J Ranch
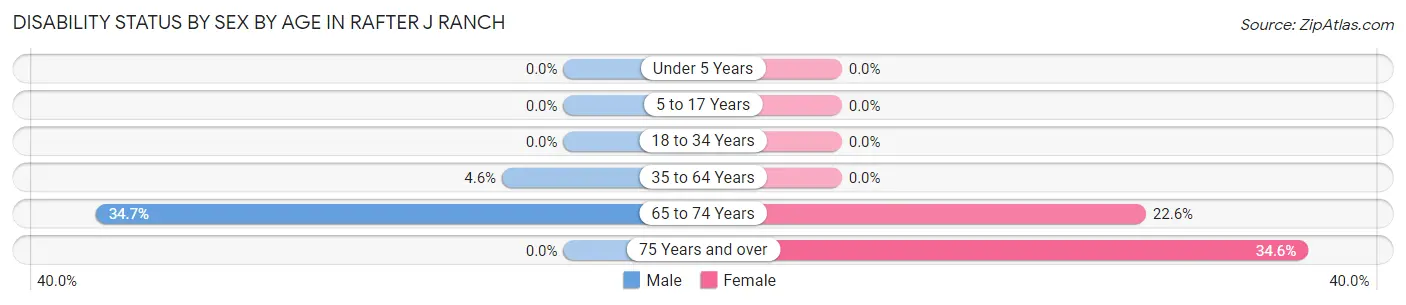
| Age Bracket | Male | Female |
| Under 5 Years | 0 (0.0%) | 0 (0.0%) |
| 5 to 17 Years | 0 (0.0%) | 0 (0.0%) |
| 18 to 34 Years | 0 (0.0%) | 0 (0.0%) |
| 35 to 64 Years | 16 (4.6%) | 0 (0.0%) |
| 65 to 74 Years | 25 (34.7%) | 14 (22.6%) |
| 75 Years and over | 0 (0.0%) | 54 (34.6%) |
Disability Class by Sex by Age in Rafter J Ranch
Disability Class: Hearing Difficulty
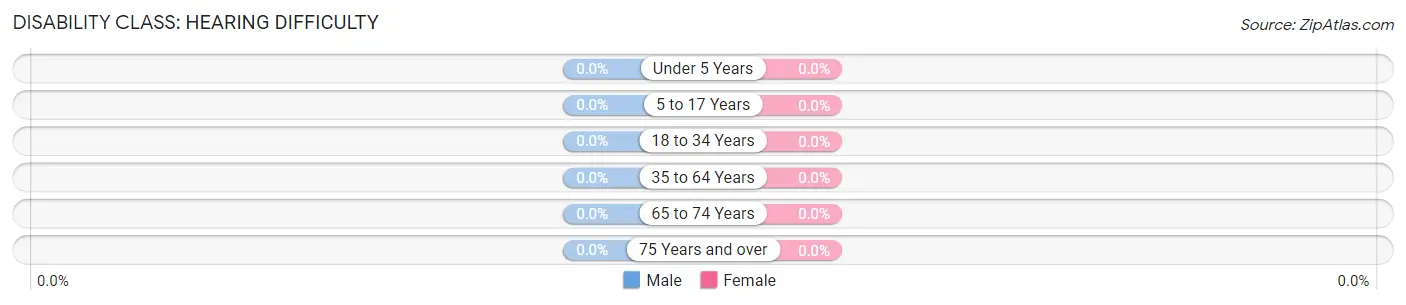
| Age Bracket | Male | Female |
| Under 5 Years | 0 (0.0%) | 0 (0.0%) |
| 5 to 17 Years | 0 (0.0%) | 0 (0.0%) |
| 18 to 34 Years | 0 (0.0%) | 0 (0.0%) |
| 35 to 64 Years | 0 (0.0%) | 0 (0.0%) |
| 65 to 74 Years | 0 (0.0%) | 0 (0.0%) |
| 75 Years and over | 0 (0.0%) | 0 (0.0%) |
Disability Class: Vision Difficulty
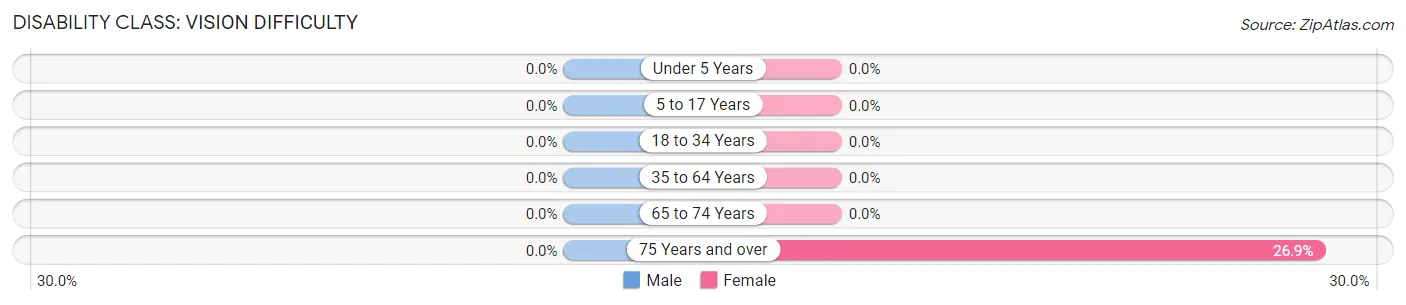
| Age Bracket | Male | Female |
| Under 5 Years | 0 (0.0%) | 0 (0.0%) |
| 5 to 17 Years | 0 (0.0%) | 0 (0.0%) |
| 18 to 34 Years | 0 (0.0%) | 0 (0.0%) |
| 35 to 64 Years | 0 (0.0%) | 0 (0.0%) |
| 65 to 74 Years | 0 (0.0%) | 0 (0.0%) |
| 75 Years and over | 0 (0.0%) | 42 (26.9%) |
Disability Class: Cognitive Difficulty
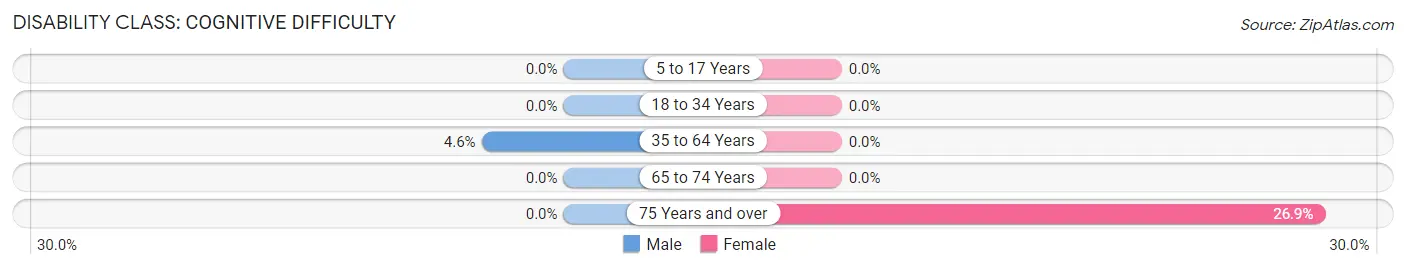
| Age Bracket | Male | Female |
| 5 to 17 Years | 0 (0.0%) | 0 (0.0%) |
| 18 to 34 Years | 0 (0.0%) | 0 (0.0%) |
| 35 to 64 Years | 16 (4.6%) | 0 (0.0%) |
| 65 to 74 Years | 0 (0.0%) | 0 (0.0%) |
| 75 Years and over | 0 (0.0%) | 42 (26.9%) |
Disability Class: Ambulatory Difficulty
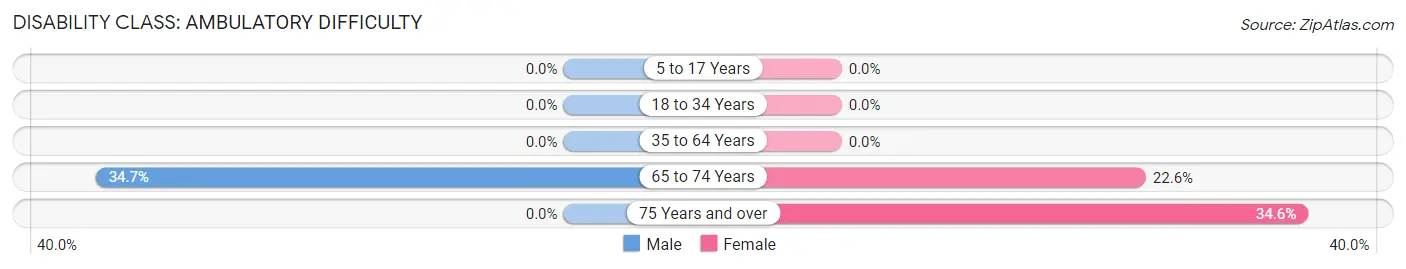
| Age Bracket | Male | Female |
| 5 to 17 Years | 0 (0.0%) | 0 (0.0%) |
| 18 to 34 Years | 0 (0.0%) | 0 (0.0%) |
| 35 to 64 Years | 0 (0.0%) | 0 (0.0%) |
| 65 to 74 Years | 25 (34.7%) | 14 (22.6%) |
| 75 Years and over | 0 (0.0%) | 54 (34.6%) |
Disability Class: Self-Care Difficulty
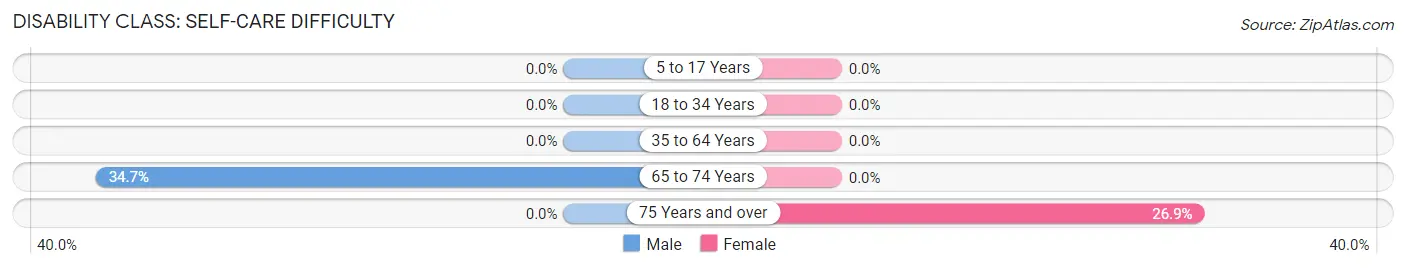
| Age Bracket | Male | Female |
| 5 to 17 Years | 0 (0.0%) | 0 (0.0%) |
| 18 to 34 Years | 0 (0.0%) | 0 (0.0%) |
| 35 to 64 Years | 0 (0.0%) | 0 (0.0%) |
| 65 to 74 Years | 25 (34.7%) | 0 (0.0%) |
| 75 Years and over | 0 (0.0%) | 42 (26.9%) |
Technology Access in Rafter J Ranch
Computing Device Access in Rafter J Ranch
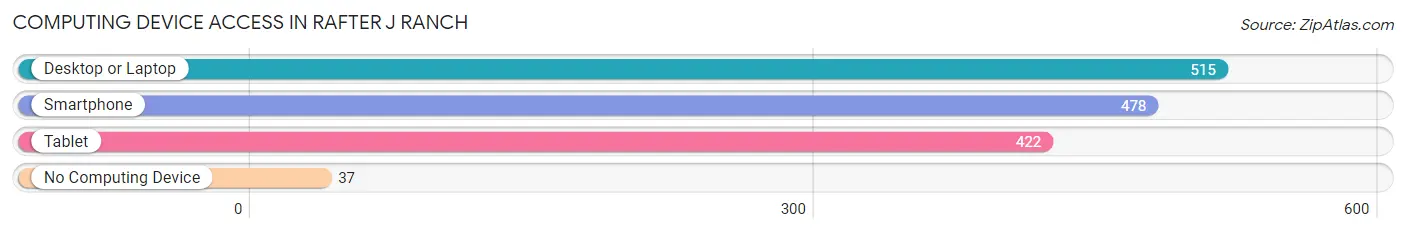
| Device Type | # Households | % Households |
| Desktop or Laptop | 515 | 87.1% |
| Smartphone | 478 | 80.9% |
| Tablet | 422 | 71.4% |
| No Computing Device | 37 | 6.3% |
| Total | 591 | 100.0% |
Internet Access in Rafter J Ranch
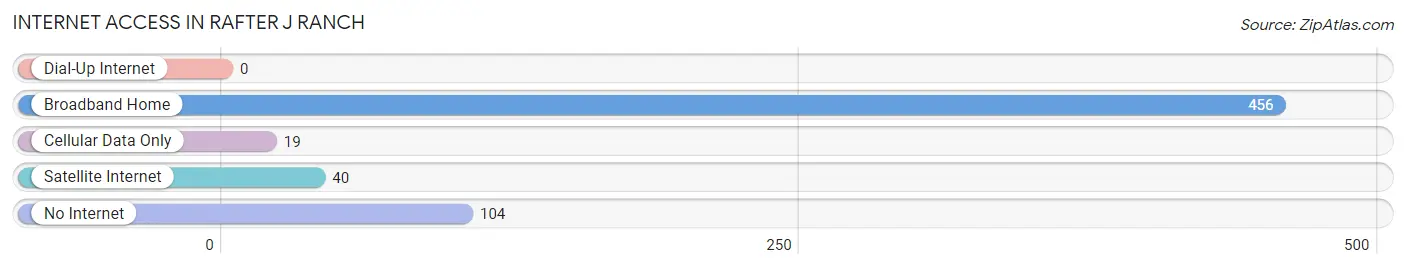
| Internet Type | # Households | % Households |
| Dial-Up Internet | 0 | 0.0% |
| Broadband Home | 456 | 77.2% |
| Cellular Data Only | 19 | 3.2% |
| Satellite Internet | 40 | 6.8% |
| No Internet | 104 | 17.6% |
| Total | 591 | 100.0% |
Rafter J Ranch Summary
Rafter J Ranch is located in the southeastern corner of Wyoming, just north of the Colorado border. It is situated in the Laramie Mountains, a subrange of the Rocky Mountains. The ranch is approximately 25 miles from the nearest town, Laramie, and is surrounded by the Medicine Bow National Forest.
History
Rafter J Ranch was established in 1876 by John and Mary Johnson, who were among the first settlers in the area. The Johnsons were originally from Iowa and had traveled west in search of a new life. They purchased the land from the federal government and began to build their ranch. The ranch was named after their son, Rafter J Johnson.
The Johnsons raised cattle and horses on the ranch and also grew crops such as wheat, oats, and hay. They also ran a small store on the property, which served the local community.
In the early 1900s, the ranch was passed down to Rafter J Johnson, who continued to run the ranch and expand it. He added more land to the ranch and increased the number of cattle and horses. He also built a large barn and a bunkhouse for the ranch hands.
In the 1950s, the ranch was sold to a family from Texas. They continued to run the ranch and added more land to it. They also built a new house and a large barn.
In the late 1990s, the ranch was sold to its current owners, who have continued to run it as a working cattle ranch.
Geography
Rafter J Ranch is located in the southeastern corner of Wyoming, just north of the Colorado border. It is situated in the Laramie Mountains, a subrange of the Rocky Mountains. The ranch is approximately 25 miles from the nearest town, Laramie, and is surrounded by the Medicine Bow National Forest.
The ranch is situated at an elevation of 6,500 feet and covers an area of approximately 5,000 acres. The terrain is mostly rolling hills and grasslands, with some areas of dense forest. The ranch is home to a variety of wildlife, including deer, elk, antelope, and coyotes.
Economy
Rafter J Ranch is a working cattle ranch. The ranch raises and sells beef cattle for meat and hides. The ranch also produces hay and other crops for sale.
The ranch also offers a variety of recreational activities, such as horseback riding, hunting, and fishing. The ranch also offers lodging and camping facilities for visitors.
Demographics
Rafter J Ranch is home to a small population of approximately 20 people. Most of the residents are employed by the ranch, either as ranch hands or in other roles. The ranch also employs a number of seasonal workers during the summer months.
The ranch is located in a rural area and is not served by any public transportation. The nearest town, Laramie, is approximately 25 miles away.
Common Questions
What is Per Capita Income in Rafter J Ranch?
Per Capita income in Rafter J Ranch is $71,531.
What is the Median Family Income in Rafter J Ranch?
Median Family Income in Rafter J Ranch is $157,159.
What is the Median Household income in Rafter J Ranch?
Median Household Income in Rafter J Ranch is $144,844.
What is Income or Wage Gap in Rafter J Ranch?
Income or Wage Gap in Rafter J Ranch is 46.3%.
Women in Rafter J Ranch earn 53.7 cents for every dollar earned by a man.
What is Inequality or Gini Index in Rafter J Ranch?
Inequality or Gini Index in Rafter J Ranch is 0.43.
What is the Total Population of Rafter J Ranch?
Total Population of Rafter J Ranch is 1,233.
What is the Total Male Population of Rafter J Ranch?
Total Male Population of Rafter J Ranch is 553.
What is the Total Female Population of Rafter J Ranch?
Total Female Population of Rafter J Ranch is 680.
What is the Ratio of Males per 100 Females in Rafter J Ranch?
There are 81.32 Males per 100 Females in Rafter J Ranch.
What is the Ratio of Females per 100 Males in Rafter J Ranch?
There are 122.97 Females per 100 Males in Rafter J Ranch.
What is the Median Population Age in Rafter J Ranch?
Median Population Age in Rafter J Ranch is 52.3 Years.
What is the Average Family Size in Rafter J Ranch
Average Family Size in Rafter J Ranch is 2.6 People.
What is the Average Household Size in Rafter J Ranch
Average Household Size in Rafter J Ranch is 2.1 People.
How Large is the Labor Force in Rafter J Ranch?
There are 769 People in the Labor Forcein in Rafter J Ranch.
What is the Percentage of People in the Labor Force in Rafter J Ranch?
68.7% of People are in the Labor Force in Rafter J Ranch.