Frannie, WY Map & Demographics
Frannie Map
Frannie Overview
$31,986
PER CAPITA INCOME
$52,344
AVG HOUSEHOLD INCOME
0.54
INEQUALITY / GINI INDEX
213
TOTAL POPULATION
113
MALE POPULATION
100
FEMALE POPULATION
113.00
MALES / 100 FEMALES
88.50
FEMALES / 100 MALES
38.0
MEDIAN AGE
2.7
AVG FAMILY SIZE
2.8
AVG HOUSEHOLD SIZE
83
LABOR FORCE [ PEOPLE ]
50.3%
PERCENT IN LABOR FORCE
6.0%
UNEMPLOYMENT RATE
Frannie Zip Codes
Frannie Area Codes
Income in Frannie
Income Overview in Frannie
| Characteristic | Number | Measure |
| Per Capita Income | 213 | $31,986 |
| Median Family Income | 57 | $0 |
| Mean Family Income | 57 | $90,596 |
| Median Household Income | 75 | $52,344 |
| Mean Household Income | 75 | $83,921 |
| Income Deficit | 57 | $0 |
| Wage / Income Gap (%) | 213 | 0.00% |
| Wage / Income Gap ($) | 213 | 100.00¢ per $1 |
| Gini / Inequality Index | 213 | 0.54 |
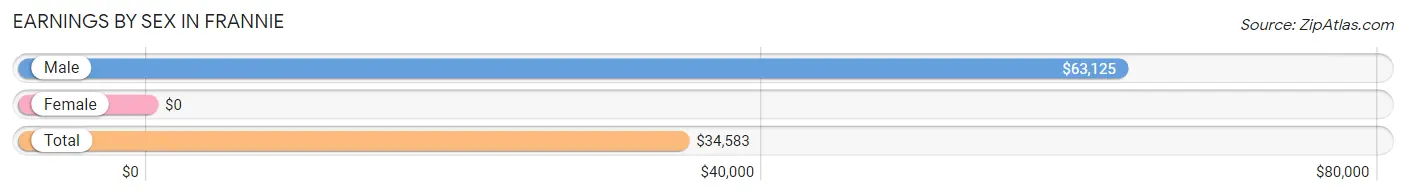
Earnings by Sex in Frannie
| Sex | Number | Average Earnings |
| Male | 43 (45.3%) | $63,125 |
| Female | 52 (54.7%) | $0 |
| Total | 95 (100.0%) | $34,583 |
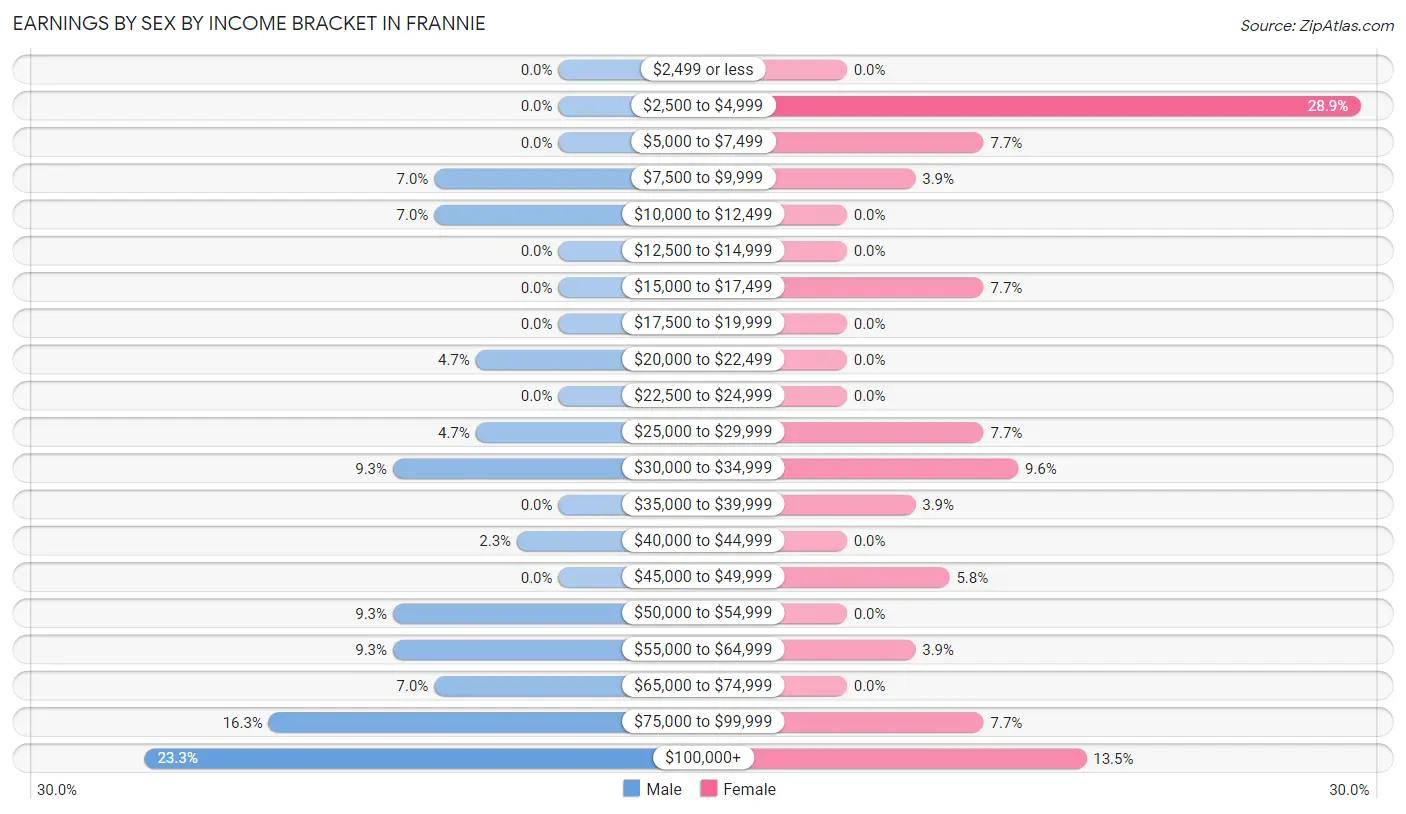
Earnings by Sex by Income Bracket in Frannie
The most common earnings brackets in Frannie are $100,000+ for men (10 | 23.3%) and $2,500 to $4,999 for women (15 | 28.8%).
| Income | Male | Female |
| $2,499 or less | 0 (0.0%) | 0 (0.0%) |
| $2,500 to $4,999 | 0 (0.0%) | 15 (28.8%) |
| $5,000 to $7,499 | 0 (0.0%) | 4 (7.7%) |
| $7,500 to $9,999 | 3 (7.0%) | 2 (3.8%) |
| $10,000 to $12,499 | 3 (7.0%) | 0 (0.0%) |
| $12,500 to $14,999 | 0 (0.0%) | 0 (0.0%) |
| $15,000 to $17,499 | 0 (0.0%) | 4 (7.7%) |
| $17,500 to $19,999 | 0 (0.0%) | 0 (0.0%) |
| $20,000 to $22,499 | 2 (4.6%) | 0 (0.0%) |
| $22,500 to $24,999 | 0 (0.0%) | 0 (0.0%) |
| $25,000 to $29,999 | 2 (4.6%) | 4 (7.7%) |
| $30,000 to $34,999 | 4 (9.3%) | 5 (9.6%) |
| $35,000 to $39,999 | 0 (0.0%) | 2 (3.8%) |
| $40,000 to $44,999 | 1 (2.3%) | 0 (0.0%) |
| $45,000 to $49,999 | 0 (0.0%) | 3 (5.8%) |
| $50,000 to $54,999 | 4 (9.3%) | 0 (0.0%) |
| $55,000 to $64,999 | 4 (9.3%) | 2 (3.8%) |
| $65,000 to $74,999 | 3 (7.0%) | 0 (0.0%) |
| $75,000 to $99,999 | 7 (16.3%) | 4 (7.7%) |
| $100,000+ | 10 (23.3%) | 7 (13.5%) |
| Total | 43 (100.0%) | 52 (100.0%) |
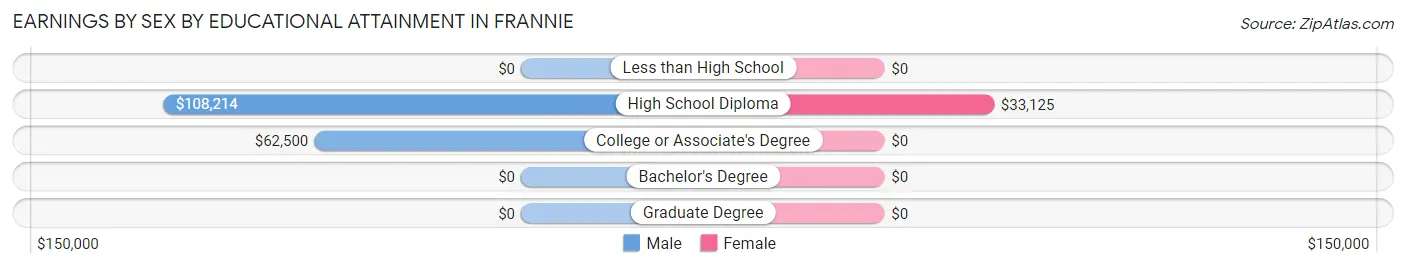
Earnings by Sex by Educational Attainment in Frannie
Average earnings in Frannie are $74,583 for men and $35,625 for women, a difference of 52.2%. Men with an educational attainment of high school diploma enjoy the highest average annual earnings of $108,214, while those with college or associate's degree education earn the least with $62,500. Women with an educational attainment of high school diploma earn the most with the average annual earnings of $33,125, while those with high school diploma education have the smallest earnings of $33,125.
| Educational Attainment | Male Income | Female Income |
| Less than High School | - | - |
| High School Diploma | $108,214 | $33,125 |
| College or Associate's Degree | $62,500 | $0 |
| Bachelor's Degree | - | - |
| Graduate Degree | - | - |
| Total | $74,583 | $35,625 |
Family Income in Frannie
Family Income Brackets in Frannie
According to the Frannie family income data, there are 13 families falling into the less than $10,000 income range, which is the most common income bracket and makes up 22.8% of all families. Conversely, the $10,000 to $14,999 income bracket is the least frequent group with only 2 families (3.5%) belonging to this category.
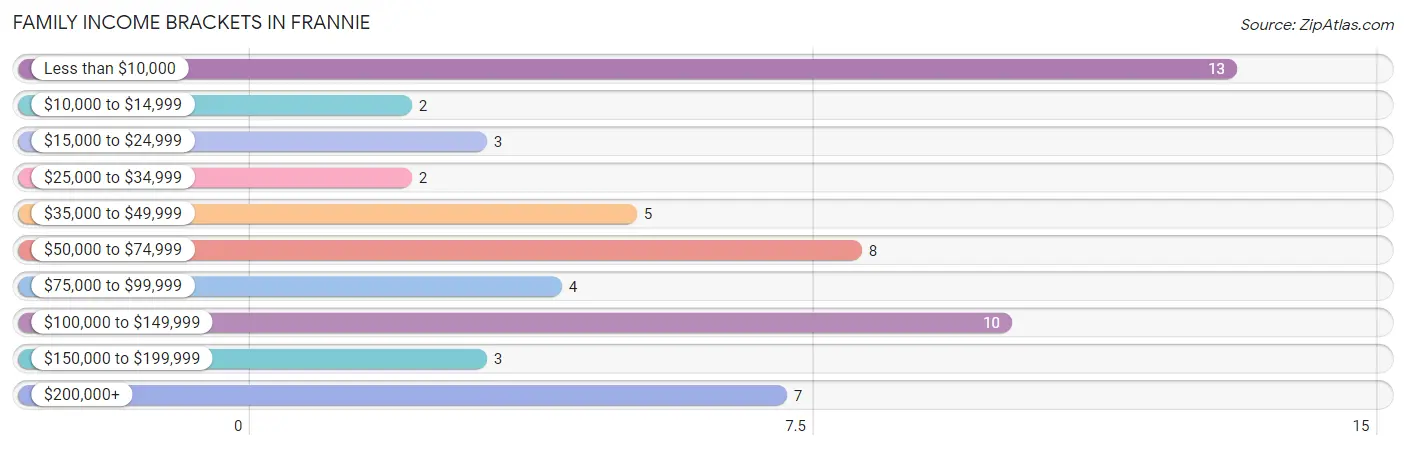
| Income Bracket | # Families | % Families |
| Less than $10,000 | 13 | 22.8% |
| $10,000 to $14,999 | 2 | 3.5% |
| $15,000 to $24,999 | 3 | 5.3% |
| $25,000 to $34,999 | 2 | 3.5% |
| $35,000 to $49,999 | 5 | 8.8% |
| $50,000 to $74,999 | 8 | 14.0% |
| $75,000 to $99,999 | 4 | 7.0% |
| $100,000 to $149,999 | 10 | 17.5% |
| $150,000 to $199,999 | 3 | 5.3% |
| $200,000+ | 7 | 12.3% |
Family Income by Famaliy Size in Frannie
| Income Bracket | # Families | Median Income |
| 2-Person Families | 41 (71.9%) | $0 |
| 3-Person Families | 3 (5.3%) | $0 |
| 4-Person Families | 0 (0.0%) | $0 |
| 5-Person Families | 2 (3.5%) | $0 |
| 6-Person Families | 11 (19.3%) | $0 |
| 7+ Person Families | 0 (0.0%) | $0 |
| Total | 57 (100.0%) | $0 |
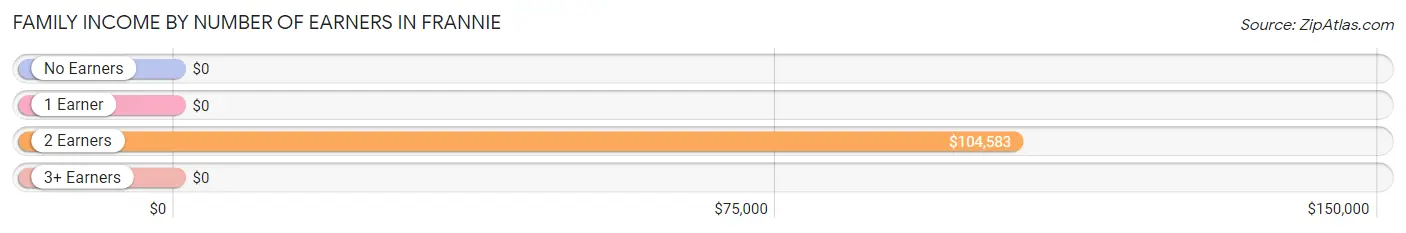
Family Income by Number of Earners in Frannie
| Number of Earners | # Families | Median Income |
| No Earners | 4 (7.0%) | $0 |
| 1 Earner | 30 (52.6%) | $0 |
| 2 Earners | 23 (40.4%) | $104,583 |
| 3+ Earners | 0 (0.0%) | $0 |
| Total | 57 (100.0%) | $0 |
Household Income in Frannie
Household Income Brackets in Frannie
With 16 households falling in the category, the $50,000 to $74,999 income range is the most frequent in Frannie, accounting for 21.3% of all households. In contrast, only 4 households (5.3%) fall into the $10,000 to $14,999 income bracket, making it the least populous group.
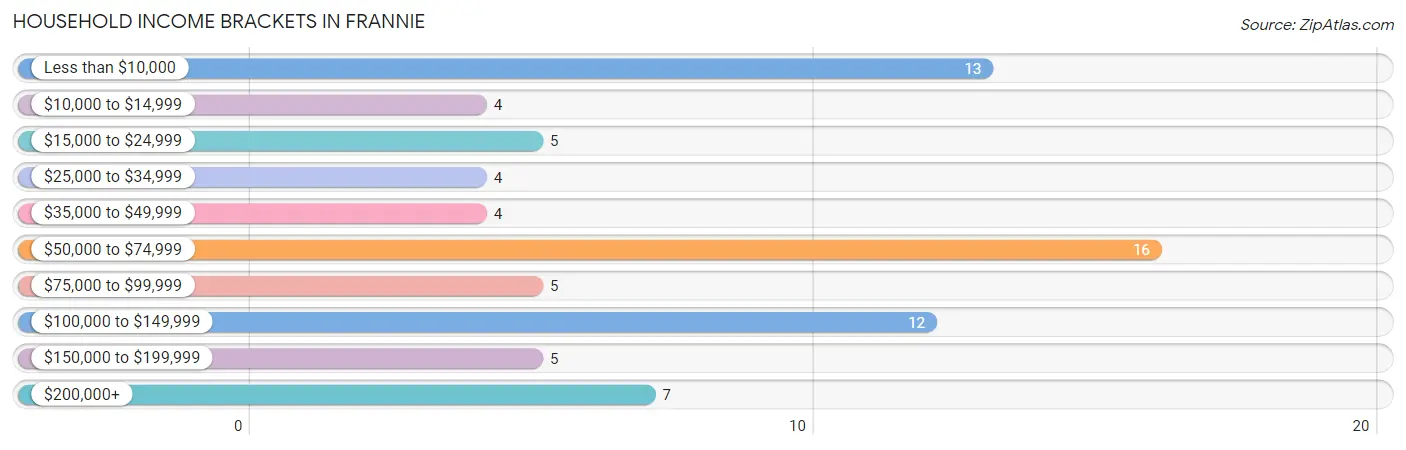
| Income Bracket | # Households | % Households |
| Less than $10,000 | 13 | 17.3% |
| $10,000 to $14,999 | 4 | 5.3% |
| $15,000 to $24,999 | 5 | 6.7% |
| $25,000 to $34,999 | 4 | 5.3% |
| $35,000 to $49,999 | 4 | 5.3% |
| $50,000 to $74,999 | 16 | 21.3% |
| $75,000 to $99,999 | 5 | 6.7% |
| $100,000 to $149,999 | 12 | 16.0% |
| $150,000 to $199,999 | 5 | 6.7% |
| $200,000+ | 7 | 9.3% |
Household Income by Householder Age in Frannie
The median household income in Frannie is $52,344, with the highest median household income of $96,250 found in the 45 to 64 years age bracket for the primary householder. A total of 16 households (21.3%) fall into this category. Meanwhile, the 15 to 24 years age bracket for the primary householder has the lowest median household income of $0, with 17 households (22.7%) in this group.
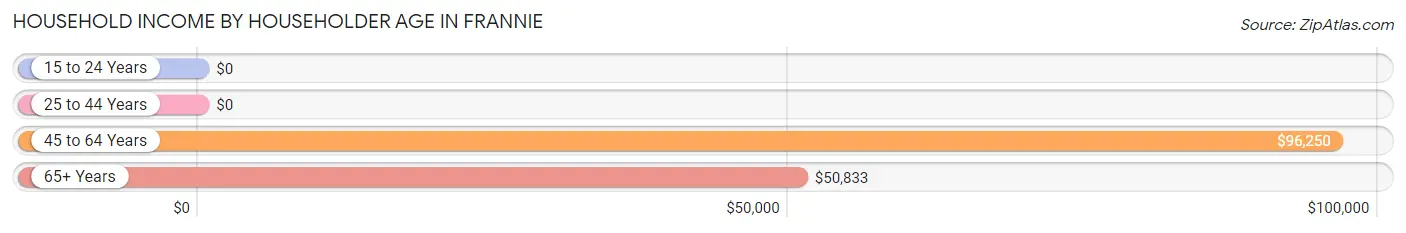
| Income Bracket | # Households | Median Income |
| 15 to 24 Years | 17 (22.7%) | $0 |
| 25 to 44 Years | 20 (26.7%) | $0 |
| 45 to 64 Years | 16 (21.3%) | $96,250 |
| 65+ Years | 22 (29.3%) | $50,833 |
| Total | 75 (100.0%) | $52,344 |
Poverty in Frannie
Income Below Poverty by Sex and Age in Frannie
With 27.4% poverty level for males and 22.0% for females among the residents of Frannie, 25 to 34 year old males and 16 and 17 year old females are the most vulnerable to poverty, with 18 males (81.8%) and 2 females (100.0%) in their respective age groups living below the poverty level.
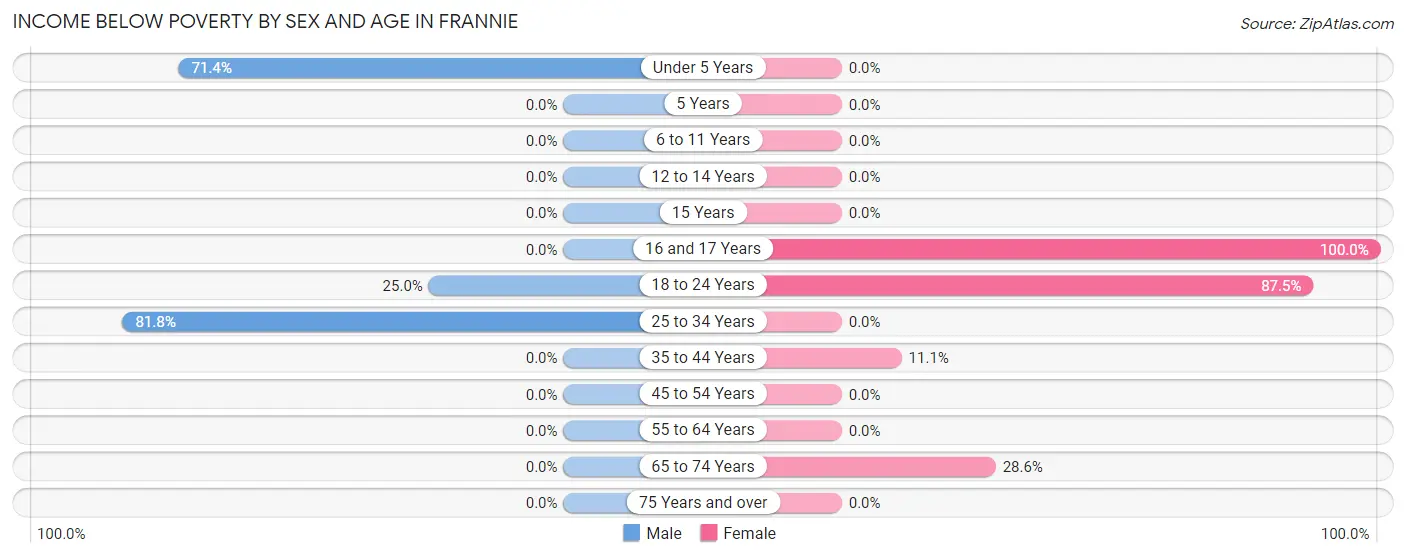
| Age Bracket | Male | Female |
| Under 5 Years | 10 (71.4%) | 0 (0.0%) |
| 5 Years | 0 (0.0%) | 0 (0.0%) |
| 6 to 11 Years | 0 (0.0%) | 0 (0.0%) |
| 12 to 14 Years | 0 (0.0%) | 0 (0.0%) |
| 15 Years | 0 (0.0%) | 0 (0.0%) |
| 16 and 17 Years | 0 (0.0%) | 2 (100.0%) |
| 18 to 24 Years | 3 (25.0%) | 14 (87.5%) |
| 25 to 34 Years | 18 (81.8%) | 0 (0.0%) |
| 35 to 44 Years | 0 (0.0%) | 2 (11.1%) |
| 45 to 54 Years | 0 (0.0%) | 0 (0.0%) |
| 55 to 64 Years | 0 (0.0%) | 0 (0.0%) |
| 65 to 74 Years | 0 (0.0%) | 4 (28.6%) |
| 75 Years and over | 0 (0.0%) | 0 (0.0%) |
| Total | 31 (27.4%) | 22 (22.0%) |
Income Above Poverty by Sex and Age in Frannie
According to the poverty statistics in Frannie, males aged 6 to 11 years and females aged under 5 years are the age groups that are most secure financially, with 100.0% of males and 100.0% of females in these age groups living above the poverty line.
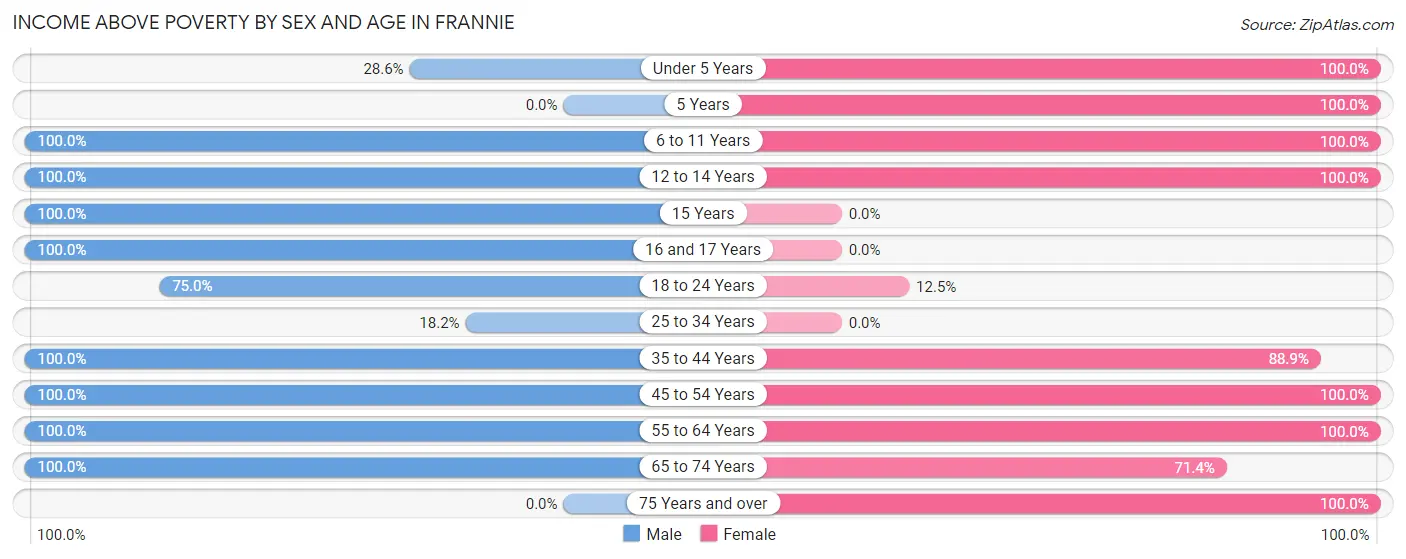
| Age Bracket | Male | Female |
| Under 5 Years | 4 (28.6%) | 7 (100.0%) |
| 5 Years | 0 (0.0%) | 4 (100.0%) |
| 6 to 11 Years | 8 (100.0%) | 9 (100.0%) |
| 12 to 14 Years | 1 (100.0%) | 3 (100.0%) |
| 15 Years | 2 (100.0%) | 0 (0.0%) |
| 16 and 17 Years | 2 (100.0%) | 0 (0.0%) |
| 18 to 24 Years | 9 (75.0%) | 2 (12.5%) |
| 25 to 34 Years | 4 (18.2%) | 0 (0.0%) |
| 35 to 44 Years | 13 (100.0%) | 16 (88.9%) |
| 45 to 54 Years | 9 (100.0%) | 11 (100.0%) |
| 55 to 64 Years | 14 (100.0%) | 8 (100.0%) |
| 65 to 74 Years | 16 (100.0%) | 10 (71.4%) |
| 75 Years and over | 0 (0.0%) | 8 (100.0%) |
| Total | 82 (72.6%) | 78 (78.0%) |
Income Below Poverty Among Married-Couple Families in Frannie
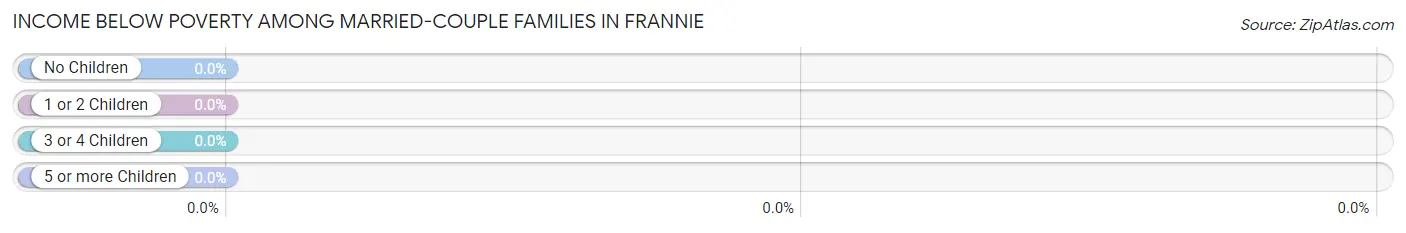
| Children | Above Poverty | Below Poverty |
| No Children | 24 (100.0%) | 0 (0.0%) |
| 1 or 2 Children | 0 (0.0%) | 0 (0.0%) |
| 3 or 4 Children | 13 (100.0%) | 0 (0.0%) |
| 5 or more Children | 0 (0.0%) | 0 (0.0%) |
| Total | 37 (100.0%) | 0 (0.0%) |
Income Below Poverty Among Single-Parent Households in Frannie
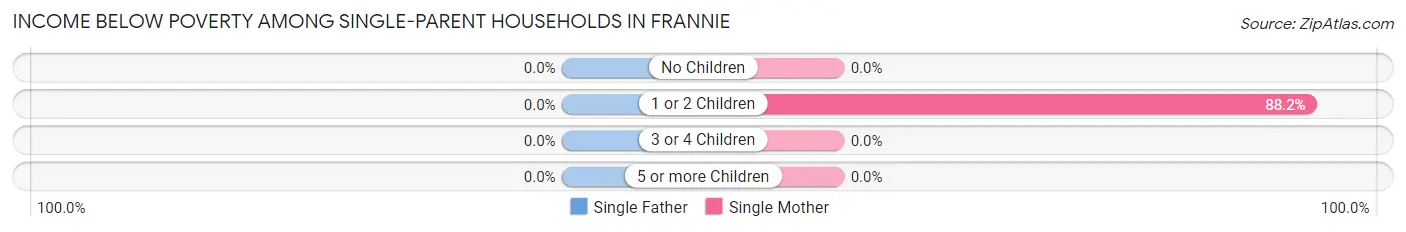
| Children | Single Father | Single Mother |
| No Children | 0 (0.0%) | 0 (0.0%) |
| 1 or 2 Children | 0 (0.0%) | 15 (88.2%) |
| 3 or 4 Children | 0 (0.0%) | 0 (0.0%) |
| 5 or more Children | 0 (0.0%) | 0 (0.0%) |
| Total | 0 (0.0%) | 15 (83.3%) |
Income Below Poverty Among Married-Couple vs Single-Parent Households in Frannie
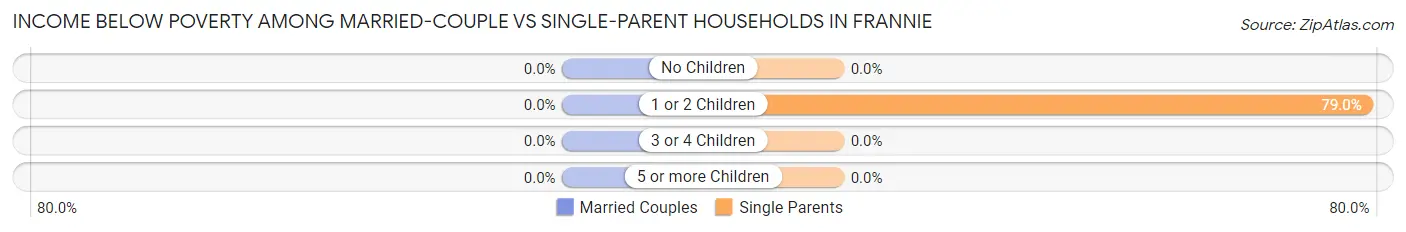
| Children | Married-Couple Families | Single-Parent Households |
| No Children | 0 (0.0%) | 0 (0.0%) |
| 1 or 2 Children | 0 (0.0%) | 15 (78.9%) |
| 3 or 4 Children | 0 (0.0%) | 0 (0.0%) |
| 5 or more Children | 0 (0.0%) | 0 (0.0%) |
| Total | 0 (0.0%) | 15 (75.0%) |
Race in Frannie
The most populous races in Frannie are White / Caucasian (201 | 94.4%), Hispanic or Latino (13 | 6.1%), and Two or more Races (10 | 4.7%).
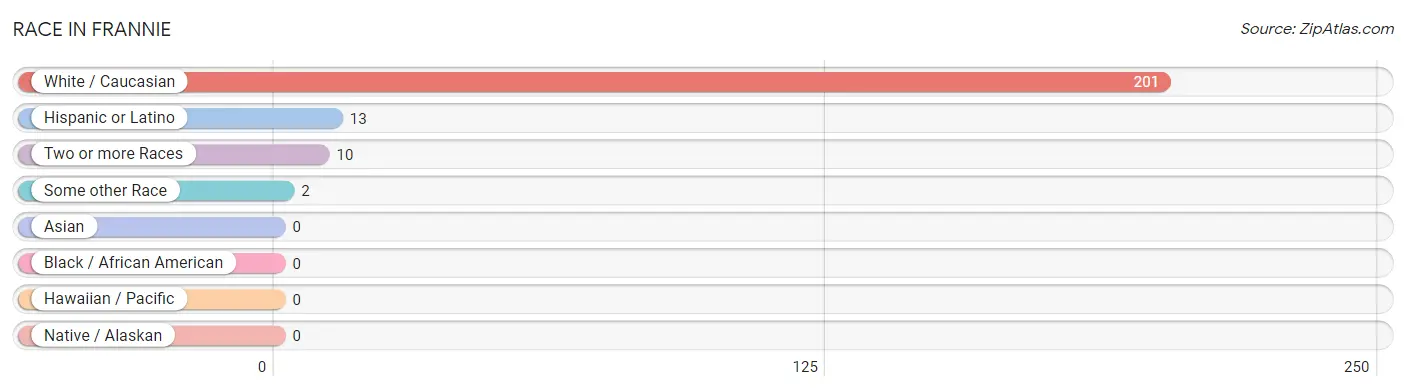
| Race | # Population | % Population |
| Asian | 0 | 0.0% |
| Black / African American | 0 | 0.0% |
| Hawaiian / Pacific | 0 | 0.0% |
| Hispanic or Latino | 13 | 6.1% |
| Native / Alaskan | 0 | 0.0% |
| White / Caucasian | 201 | 94.4% |
| Two or more Races | 10 | 4.7% |
| Some other Race | 2 | 0.9% |
| Total | 213 | 100.0% |
Ancestry in Frannie
The most populous ancestries reported in Frannie are German (61 | 28.6%), Norwegian (19 | 8.9%), Irish (17 | 8.0%), English (15 | 7.0%), and Russian (14 | 6.6%), together accounting for 59.1% of all Frannie residents.
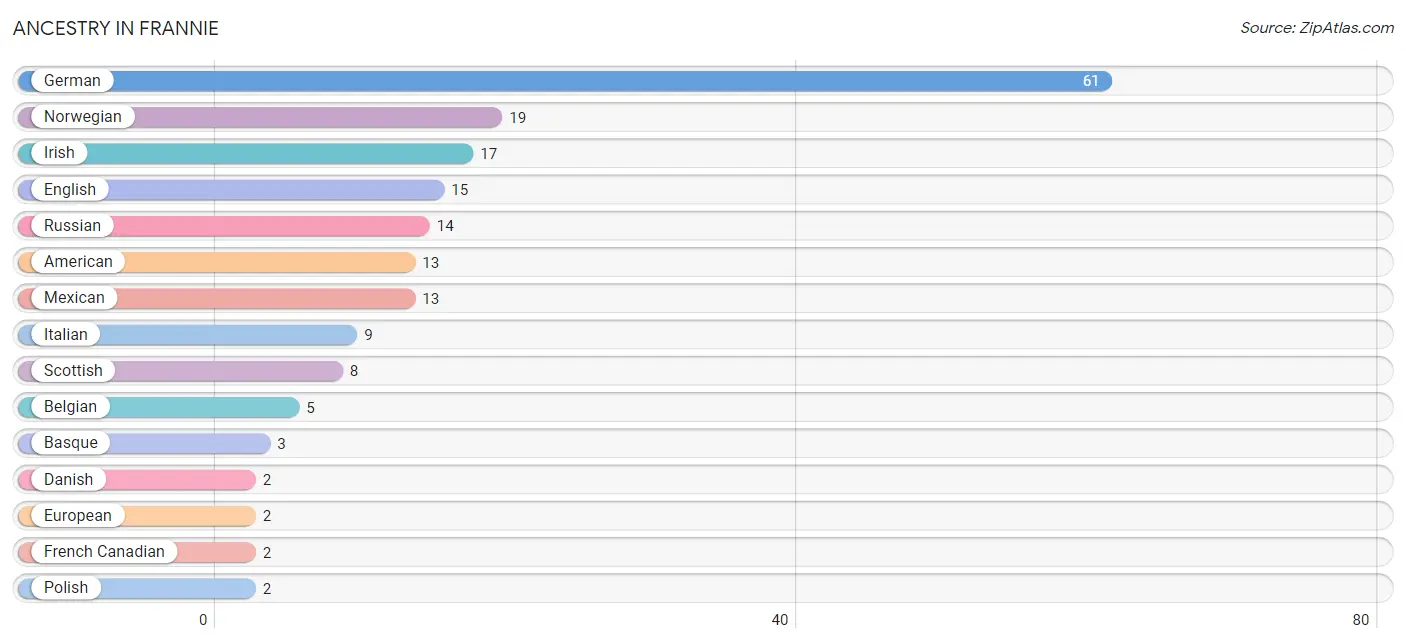
| Ancestry | # Population | % Population |
| American | 13 | 6.1% |
| Basque | 3 | 1.4% |
| Belgian | 5 | 2.4% |
| Danish | 2 | 0.9% |
| English | 15 | 7.0% |
| European | 2 | 0.9% |
| French | 1 | 0.5% |
| French Canadian | 2 | 0.9% |
| German | 61 | 28.6% |
| Irish | 17 | 8.0% |
| Italian | 9 | 4.2% |
| Mexican | 13 | 6.1% |
| Norwegian | 19 | 8.9% |
| Polish | 2 | 0.9% |
| Russian | 14 | 6.6% |
| Scottish | 8 | 3.8% |
| Swedish | 2 | 0.9% | View All 17 Rows |
Immigrants in Frannie
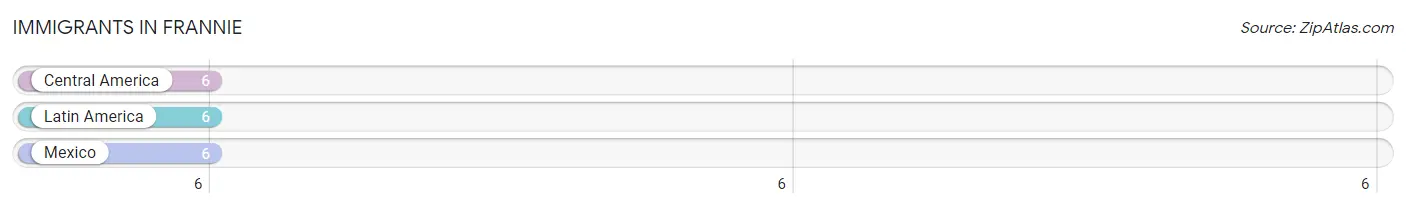
The most numerous immigrant groups reported in Frannie came from Central America (6 | 2.8%), Latin America (6 | 2.8%), and Mexico (6 | 2.8%), together accounting for 8.5% of all Frannie residents.
| Immigration Origin | # Population | % Population |
| Central America | 6 | 2.8% |
| Latin America | 6 | 2.8% |
| Mexico | 6 | 2.8% | View All 3 Rows |
Sex and Age in Frannie
Sex and Age in Frannie
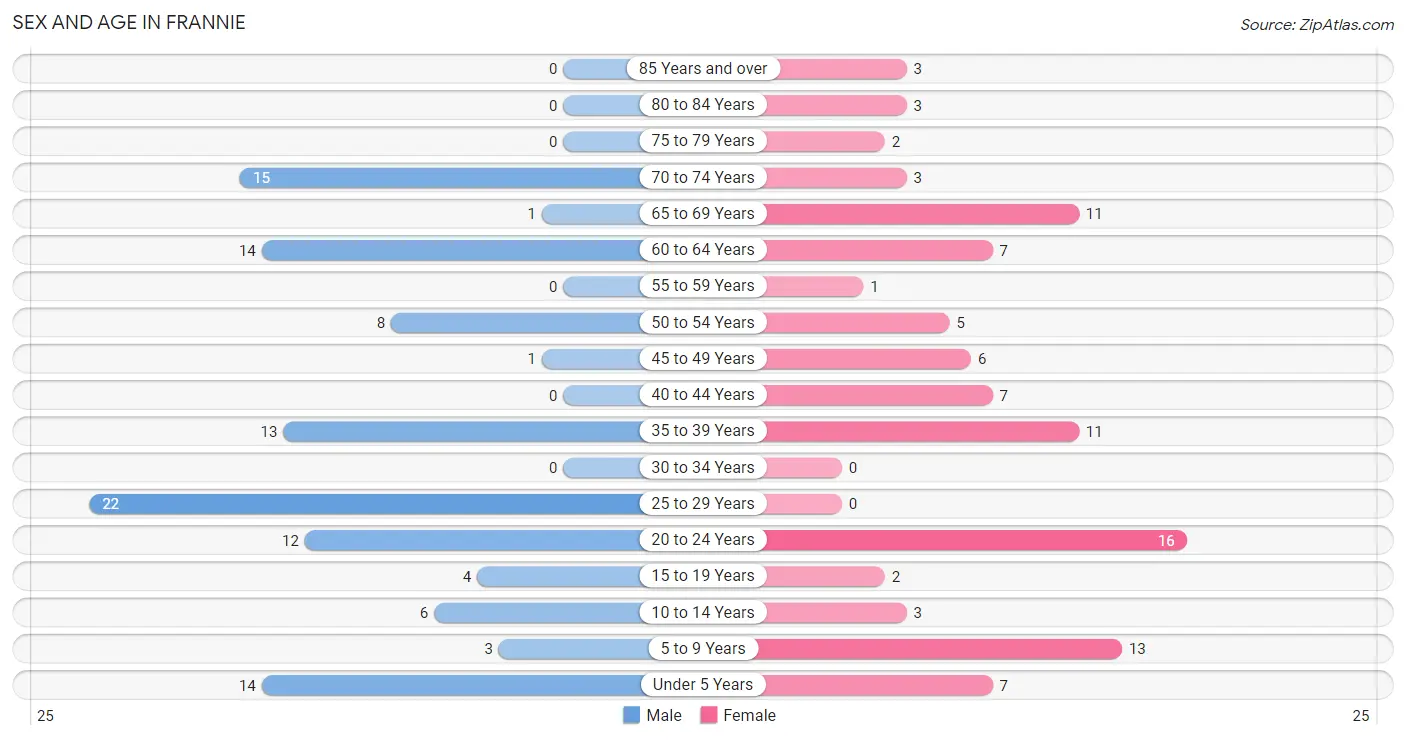
The most populous age groups in Frannie are 25 to 29 Years (22 | 19.5%) for men and 20 to 24 Years (16 | 16.0%) for women.
| Age Bracket | Male | Female |
| Under 5 Years | 14 (12.4%) | 7 (7.0%) |
| 5 to 9 Years | 3 (2.6%) | 13 (13.0%) |
| 10 to 14 Years | 6 (5.3%) | 3 (3.0%) |
| 15 to 19 Years | 4 (3.5%) | 2 (2.0%) |
| 20 to 24 Years | 12 (10.6%) | 16 (16.0%) |
| 25 to 29 Years | 22 (19.5%) | 0 (0.0%) |
| 30 to 34 Years | 0 (0.0%) | 0 (0.0%) |
| 35 to 39 Years | 13 (11.5%) | 11 (11.0%) |
| 40 to 44 Years | 0 (0.0%) | 7 (7.0%) |
| 45 to 49 Years | 1 (0.9%) | 6 (6.0%) |
| 50 to 54 Years | 8 (7.1%) | 5 (5.0%) |
| 55 to 59 Years | 0 (0.0%) | 1 (1.0%) |
| 60 to 64 Years | 14 (12.4%) | 7 (7.0%) |
| 65 to 69 Years | 1 (0.9%) | 11 (11.0%) |
| 70 to 74 Years | 15 (13.3%) | 3 (3.0%) |
| 75 to 79 Years | 0 (0.0%) | 2 (2.0%) |
| 80 to 84 Years | 0 (0.0%) | 3 (3.0%) |
| 85 Years and over | 0 (0.0%) | 3 (3.0%) |
| Total | 113 (100.0%) | 100 (100.0%) |
Families and Households in Frannie
Median Family Size in Frannie
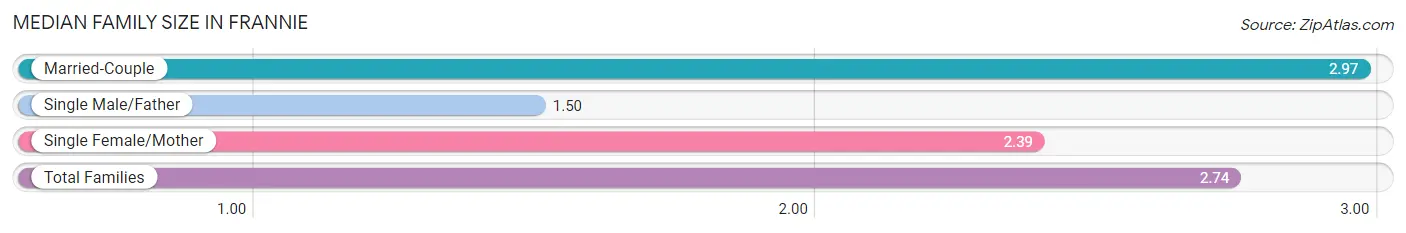
The median family size in Frannie is 2.74 persons per family, with married-couple families (37 | 64.9%) accounting for the largest median family size of 2.97 persons per family. On the other hand, single male/father families (2 | 3.5%) represent the smallest median family size with 1.50 persons per family.
| Family Type | # Families | Family Size |
| Married-Couple | 37 (64.9%) | 2.97 |
| Single Male/Father | 2 (3.5%) | 1.50 |
| Single Female/Mother | 18 (31.6%) | 2.39 |
| Total Families | 57 (100.0%) | 2.74 |
Median Household Size in Frannie
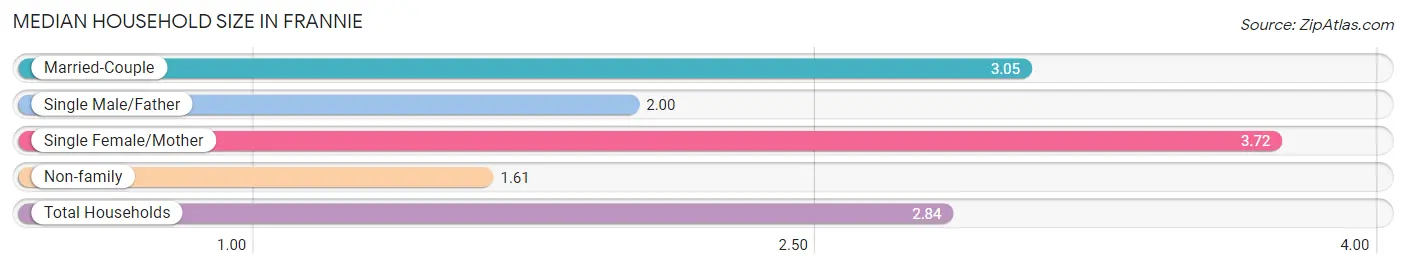
The median household size in Frannie is 2.84 persons per household, with single female/mother households (18 | 24.0%) accounting for the largest median household size of 3.72 persons per household. non-family households (18 | 24.0%) represent the smallest median household size with 1.61 persons per household.
| Household Type | # Households | Household Size |
| Married-Couple | 37 (49.3%) | 3.05 |
| Single Male/Father | 2 (2.7%) | 2.00 |
| Single Female/Mother | 18 (24.0%) | 3.72 |
| Non-family | 18 (24.0%) | 1.61 |
| Total Households | 75 (100.0%) | 2.84 |
Household Size by Marriage Status in Frannie
Out of a total of 75 households in Frannie, 57 (76.0%) are family households, while 18 (24.0%) are nonfamily households. The most numerous type of family households are 2-person households, comprising 23, and the most common type of nonfamily households are 1-person households, comprising 16.
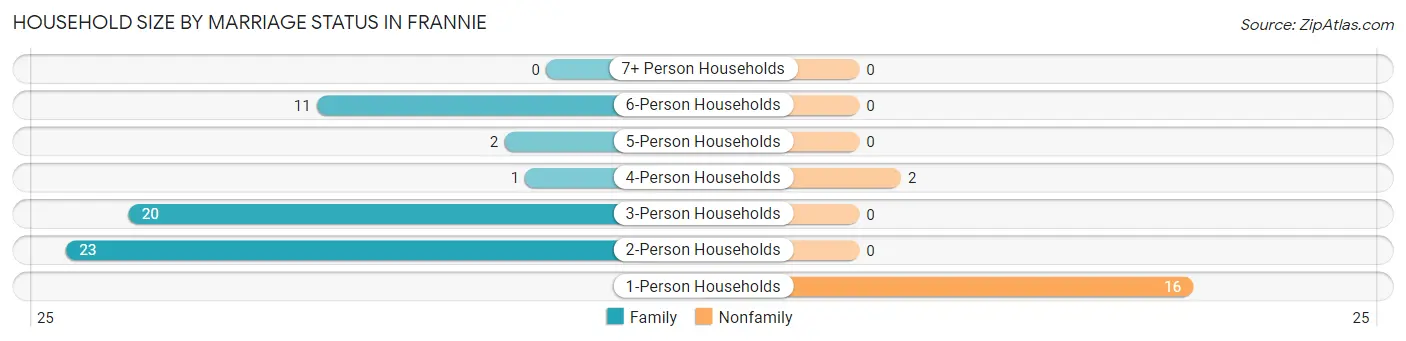
| Household Size | Family Households | Nonfamily Households |
| 1-Person Households | - | 16 (21.3%) |
| 2-Person Households | 23 (30.7%) | 0 (0.0%) |
| 3-Person Households | 20 (26.7%) | 0 (0.0%) |
| 4-Person Households | 1 (1.3%) | 2 (2.7%) |
| 5-Person Households | 2 (2.7%) | 0 (0.0%) |
| 6-Person Households | 11 (14.7%) | 0 (0.0%) |
| 7+ Person Households | 0 (0.0%) | 0 (0.0%) |
| Total | 57 (76.0%) | 18 (24.0%) |
Female Fertility in Frannie
Fertility by Age in Frannie
| Age Bracket | Women with Births | Births / 1,000 Women |
| 15 to 19 years | 0 (0.0%) | 0.0 |
| 20 to 34 years | 0 (0.0%) | 0.0 |
| 35 to 50 years | 0 (0.0%) | 0.0 |
| Total | 0 (0.0%) | 0.0 |
Fertility by Age by Marriage Status in Frannie
| Age Bracket | Married | Unmarried |
| 15 to 19 years | 0 (0.0%) | 0 (0.0%) |
| 20 to 34 years | 0 (0.0%) | 0 (0.0%) |
| 35 to 50 years | 0 (0.0%) | 0 (0.0%) |
| Total | 0 (0.0%) | 0 (0.0%) |
Fertility by Education in Frannie
| Educational Attainment | Women with Births | Births / 1,000 Women |
| Less than High School | 0 (0.0%) | 0.0 |
| High School Diploma | 0 (0.0%) | 0.0 |
| College or Associate's Degree | 0 (0.0%) | 0.0 |
| Bachelor's Degree | 0 (0.0%) | 0.0 |
| Graduate Degree | 0 (0.0%) | 0.0 |
| Total | 0 (0.0%) | 0.0 |
Fertility by Education by Marriage Status in Frannie
| Educational Attainment | Married | Unmarried |
| Less than High School | 0 (0.0%) | 0 (0.0%) |
| High School Diploma | 0 (0.0%) | 0 (0.0%) |
| College or Associate's Degree | 0 (0.0%) | 0 (0.0%) |
| Bachelor's Degree | 0 (0.0%) | 0 (0.0%) |
| Graduate Degree | 0 (0.0%) | 0 (0.0%) |
| Total | 0 (0.0%) | 0 (0.0%) |
Employment Characteristics in Frannie
Employment by Class of Employer in Frannie
Among the 76 employed individuals in Frannie, private company employees (57 | 75.0%), local government employees (8 | 10.5%), and self-employed (not incorporated) (5 | 6.6%) make up the most common classes of employment.
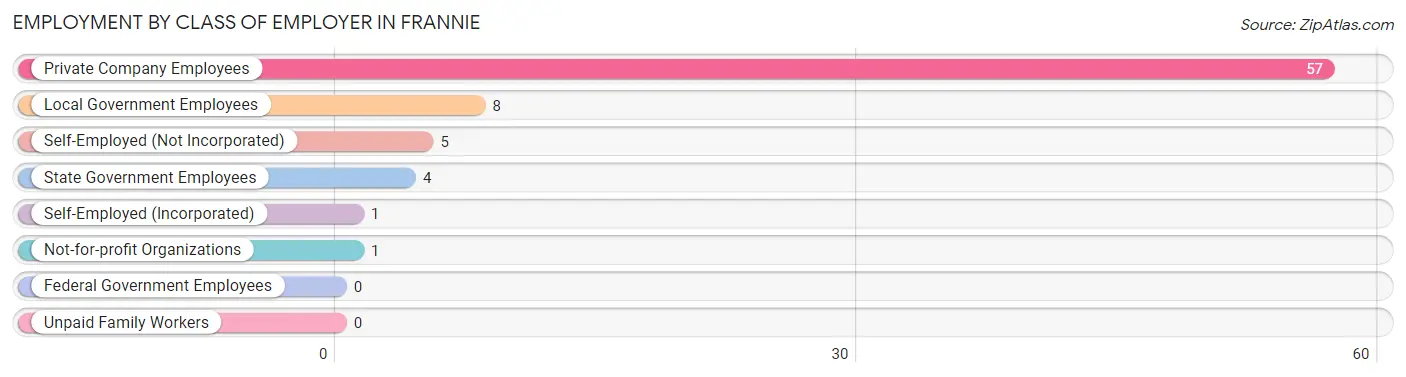
| Employer Class | # Employees | % Employees |
| Private Company Employees | 57 | 75.0% |
| Self-Employed (Incorporated) | 1 | 1.3% |
| Self-Employed (Not Incorporated) | 5 | 6.6% |
| Not-for-profit Organizations | 1 | 1.3% |
| Local Government Employees | 8 | 10.5% |
| State Government Employees | 4 | 5.3% |
| Federal Government Employees | 0 | 0.0% |
| Unpaid Family Workers | 0 | 0.0% |
| Total | 76 | 100.0% |
Employment Status by Age in Frannie
According to the labor force statistics for Frannie, out of the total population over 16 years of age (165), 50.3% or 83 individuals are in the labor force, with 6.0% or 5 of them unemployed. The age group with the highest labor force participation rate is 55 to 59 years, with 100.0% or 1 individuals in the labor force. Within the labor force, the 16 to 19 years age range has the highest percentage of unemployed individuals, with 100.0% or 2 of them being unemployed.
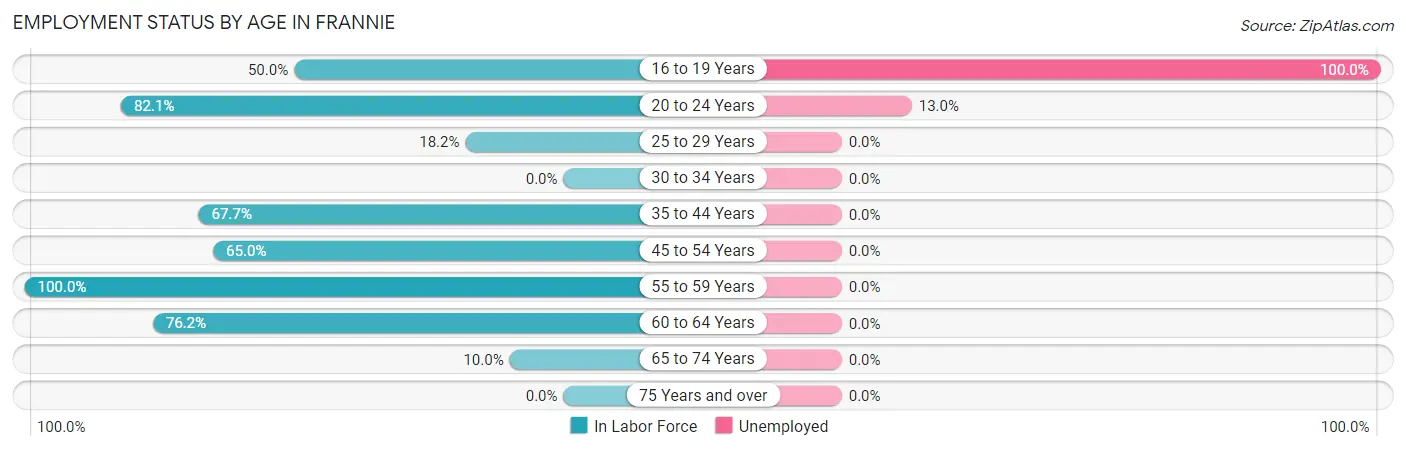
| Age Bracket | In Labor Force | Unemployed |
| 16 to 19 Years | 2 (50.0%) | 2 (100.0%) |
| 20 to 24 Years | 23 (82.1%) | 3 (13.0%) |
| 25 to 29 Years | 4 (18.2%) | 0 (0.0%) |
| 30 to 34 Years | 0 (0.0%) | 0 (0.0%) |
| 35 to 44 Years | 21 (67.7%) | 0 (0.0%) |
| 45 to 54 Years | 13 (65.0%) | 0 (0.0%) |
| 55 to 59 Years | 1 (100.0%) | 0 (0.0%) |
| 60 to 64 Years | 16 (76.2%) | 0 (0.0%) |
| 65 to 74 Years | 3 (10.0%) | 0 (0.0%) |
| 75 Years and over | 0 (0.0%) | 0 (0.0%) |
| Total | 83 (50.3%) | 5 (6.0%) |
Employment Status by Educational Attainment in Frannie
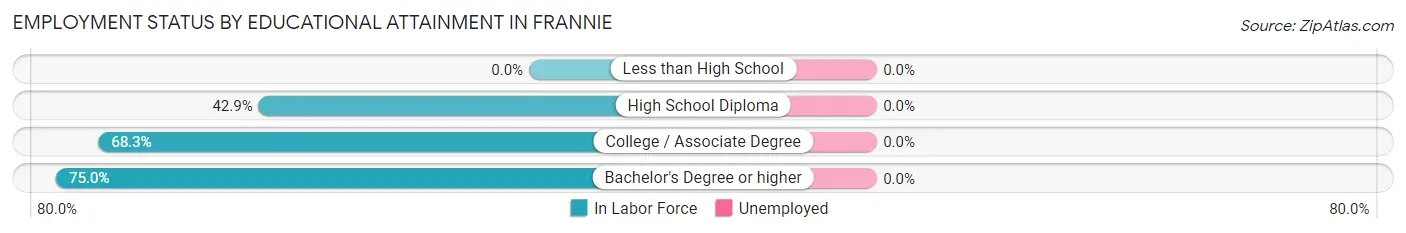
| Educational Attainment | In Labor Force | Unemployed |
| Less than High School | 0 (0.0%) | 0 (0.0%) |
| High School Diploma | 18 (42.9%) | 0 (0.0%) |
| College / Associate Degree | 28 (68.3%) | 0 (0.0%) |
| Bachelor's Degree or higher | 9 (75.0%) | 0 (0.0%) |
| Total | 55 (57.9%) | 0 (0.0%) |
Employment Occupations by Sex in Frannie
Management, Business, Science and Arts Occupations
The most common Management, Business, Science and Arts occupations in Frannie are Management (18 | 23.1%), Community & Social Service (6 | 7.7%), Education Instruction & Library (4 | 5.1%), Health Diagnosing & Treating (2 | 2.6%), and Health Technologists (2 | 2.6%).
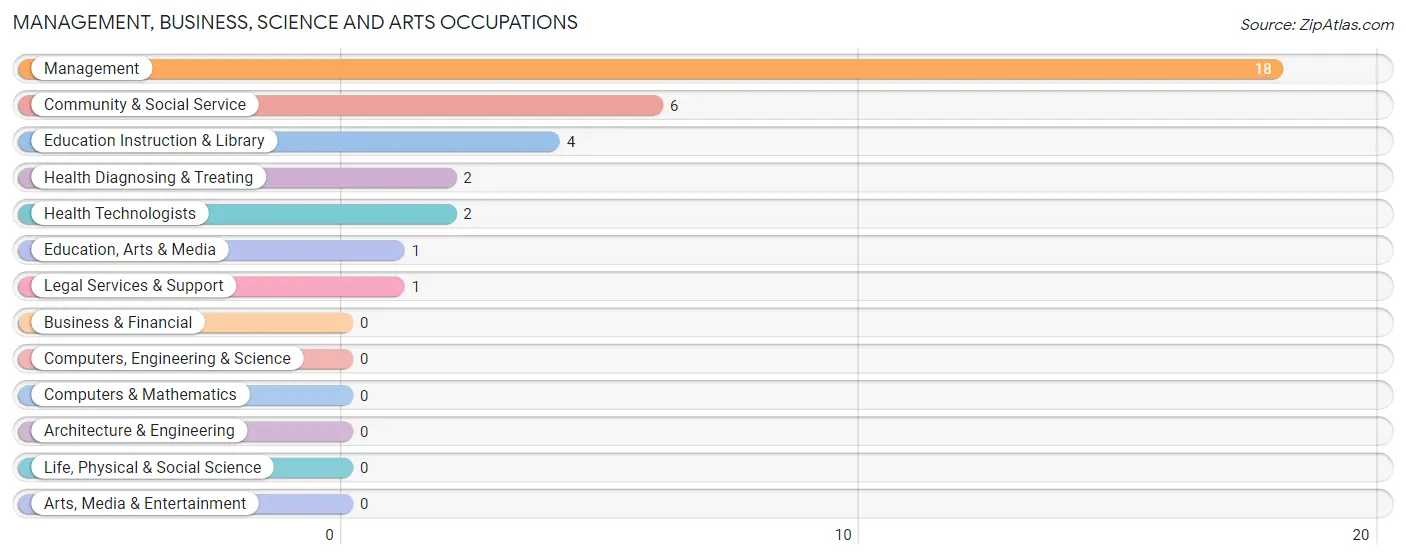
Management, Business, Science and Arts Occupations by Sex
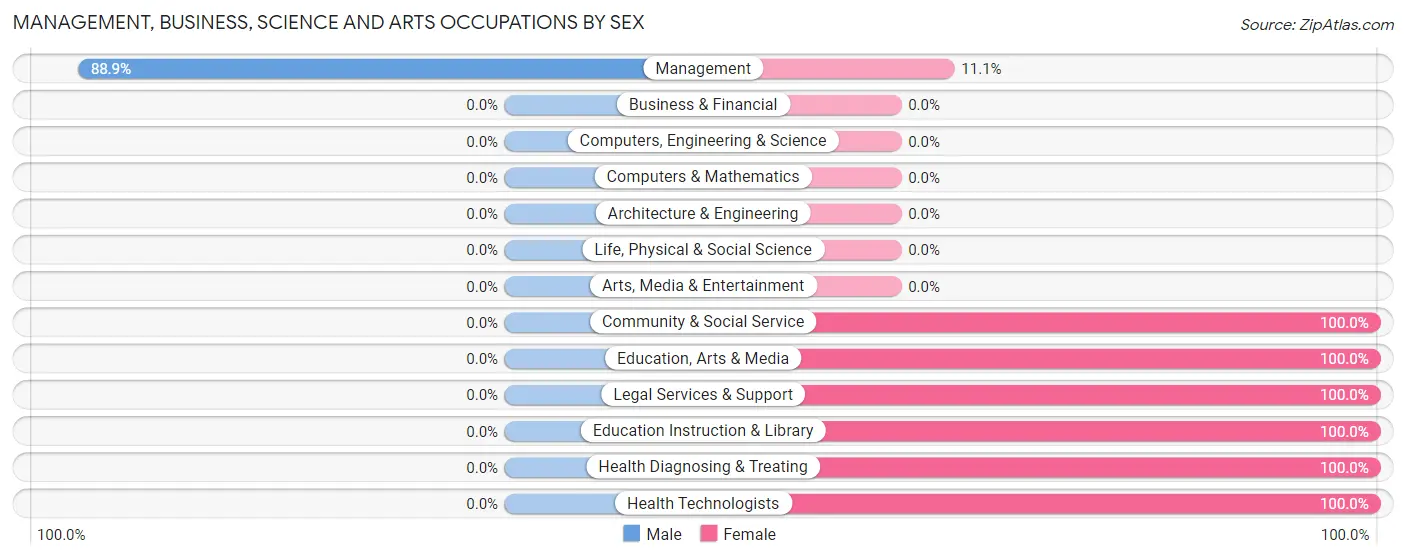
| Occupation | Male | Female |
| Management | 16 (88.9%) | 2 (11.1%) |
| Business & Financial | 0 (0.0%) | 0 (0.0%) |
| Computers, Engineering & Science | 0 (0.0%) | 0 (0.0%) |
| Computers & Mathematics | 0 (0.0%) | 0 (0.0%) |
| Architecture & Engineering | 0 (0.0%) | 0 (0.0%) |
| Life, Physical & Social Science | 0 (0.0%) | 0 (0.0%) |
| Community & Social Service | 0 (0.0%) | 6 (100.0%) |
| Education, Arts & Media | 0 (0.0%) | 1 (100.0%) |
| Legal Services & Support | 0 (0.0%) | 1 (100.0%) |
| Education Instruction & Library | 0 (0.0%) | 4 (100.0%) |
| Arts, Media & Entertainment | 0 (0.0%) | 0 (0.0%) |
| Health Diagnosing & Treating | 0 (0.0%) | 2 (100.0%) |
| Health Technologists | 0 (0.0%) | 2 (100.0%) |
| Total (Category) | 16 (61.5%) | 10 (38.5%) |
| Total (Overall) | 39 (50.0%) | 39 (50.0%) |
Services Occupations
The most common Services occupations in Frannie are Cleaning & Maintenance (5 | 6.4%), Food Preparation & Serving (4 | 5.1%), and Healthcare Support (2 | 2.6%).
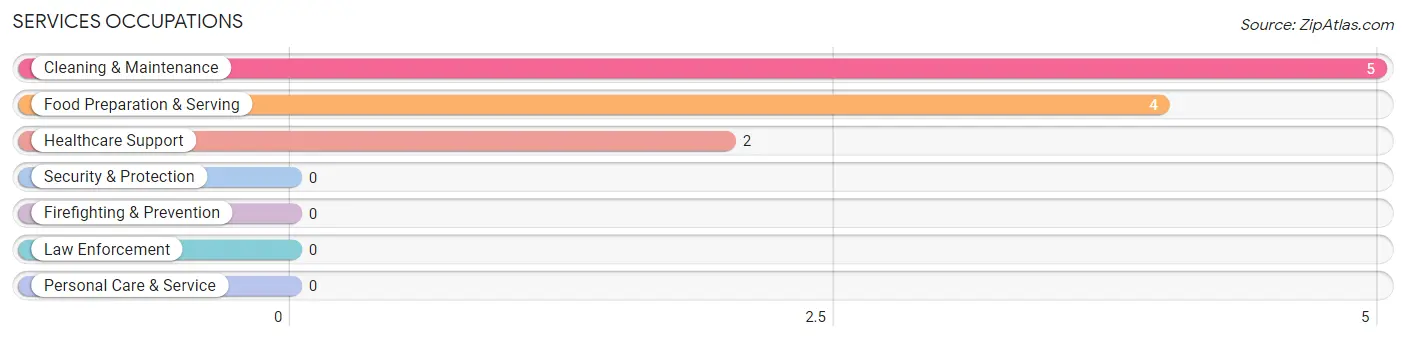
Services Occupations by Sex
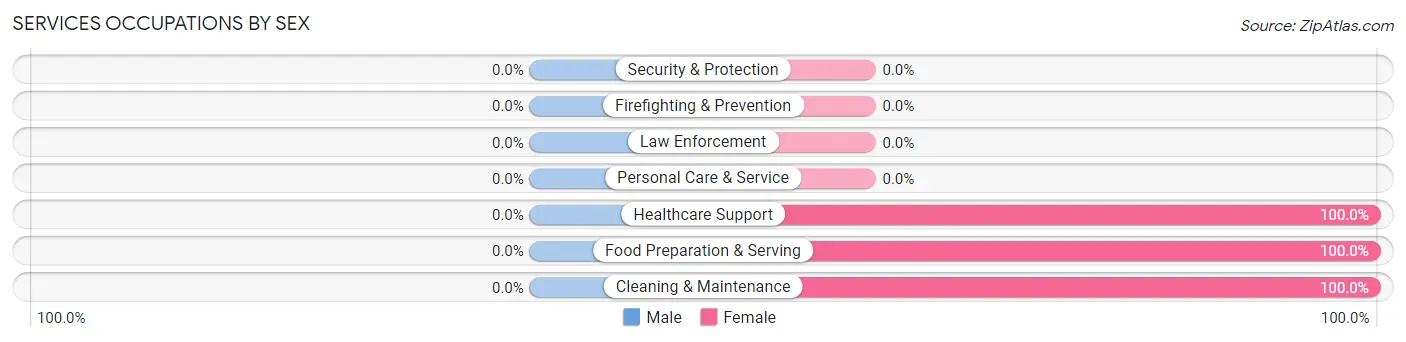
| Occupation | Male | Female |
| Healthcare Support | 0 (0.0%) | 2 (100.0%) |
| Security & Protection | 0 (0.0%) | 0 (0.0%) |
| Firefighting & Prevention | 0 (0.0%) | 0 (0.0%) |
| Law Enforcement | 0 (0.0%) | 0 (0.0%) |
| Food Preparation & Serving | 0 (0.0%) | 4 (100.0%) |
| Cleaning & Maintenance | 0 (0.0%) | 5 (100.0%) |
| Personal Care & Service | 0 (0.0%) | 0 (0.0%) |
| Total (Category) | 0 (0.0%) | 11 (100.0%) |
| Total (Overall) | 39 (50.0%) | 39 (50.0%) |
Sales and Office Occupations
The most common Sales and Office occupations in Frannie are Sales & Related (13 | 16.7%), and Office & Administration (2 | 2.6%).
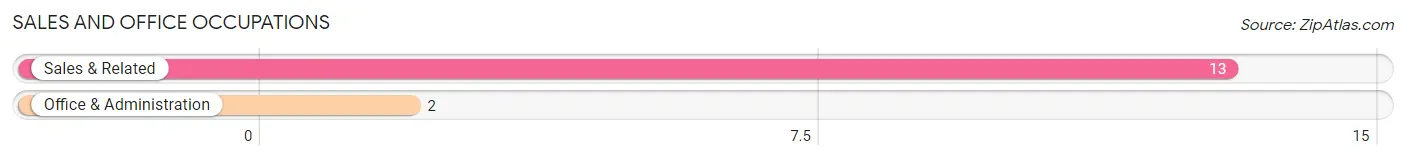
Sales and Office Occupations by Sex
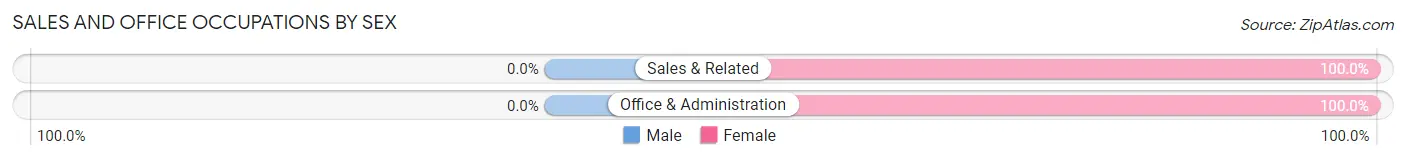
| Occupation | Male | Female |
| Sales & Related | 0 (0.0%) | 13 (100.0%) |
| Office & Administration | 0 (0.0%) | 2 (100.0%) |
| Total (Category) | 0 (0.0%) | 15 (100.0%) |
| Total (Overall) | 39 (50.0%) | 39 (50.0%) |
Natural Resources, Construction and Maintenance Occupations
The most common Natural Resources, Construction and Maintenance occupations in Frannie are Construction & Extraction (6 | 7.7%), and Installation, Maintenance & Repair (2 | 2.6%).
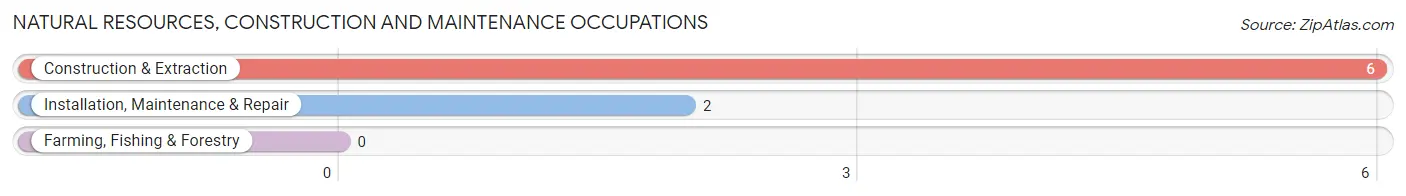
Natural Resources, Construction and Maintenance Occupations by Sex
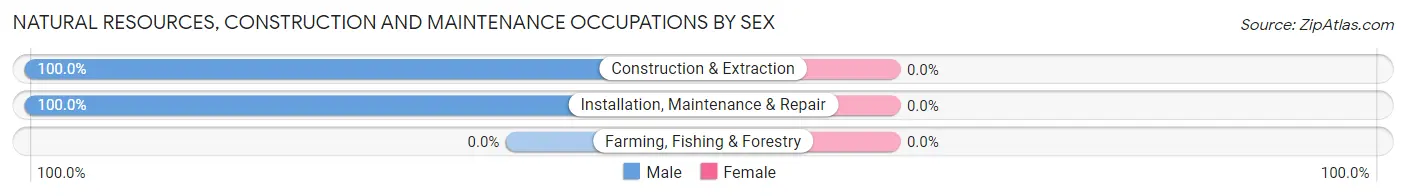
| Occupation | Male | Female |
| Farming, Fishing & Forestry | 0 (0.0%) | 0 (0.0%) |
| Construction & Extraction | 6 (100.0%) | 0 (0.0%) |
| Installation, Maintenance & Repair | 2 (100.0%) | 0 (0.0%) |
| Total (Category) | 8 (100.0%) | 0 (0.0%) |
| Total (Overall) | 39 (50.0%) | 39 (50.0%) |
Production, Transportation and Moving Occupations
The most common Production, Transportation and Moving occupations in Frannie are Material Moving (13 | 16.7%), Production (4 | 5.1%), and Transportation (1 | 1.3%).
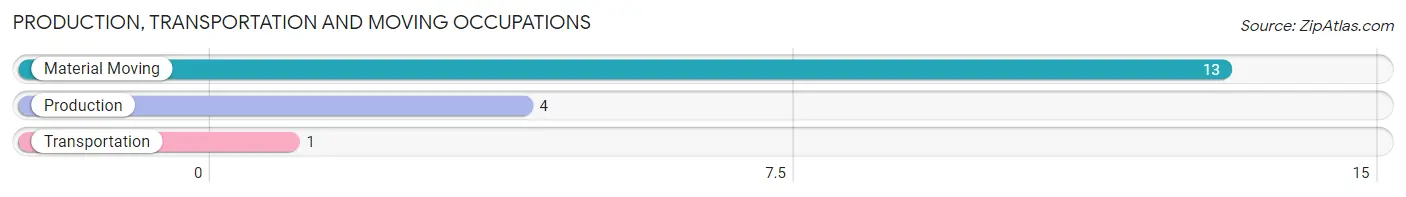
Production, Transportation and Moving Occupations by Sex
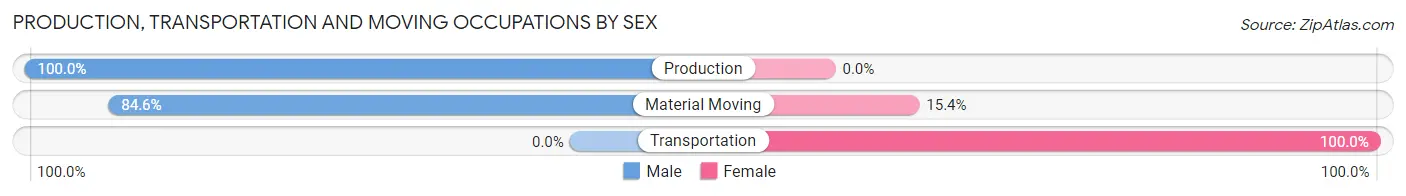
| Occupation | Male | Female |
| Production | 4 (100.0%) | 0 (0.0%) |
| Transportation | 0 (0.0%) | 1 (100.0%) |
| Material Moving | 11 (84.6%) | 2 (15.4%) |
| Total (Category) | 15 (83.3%) | 3 (16.7%) |
| Total (Overall) | 39 (50.0%) | 39 (50.0%) |
Employment Industries by Sex in Frannie
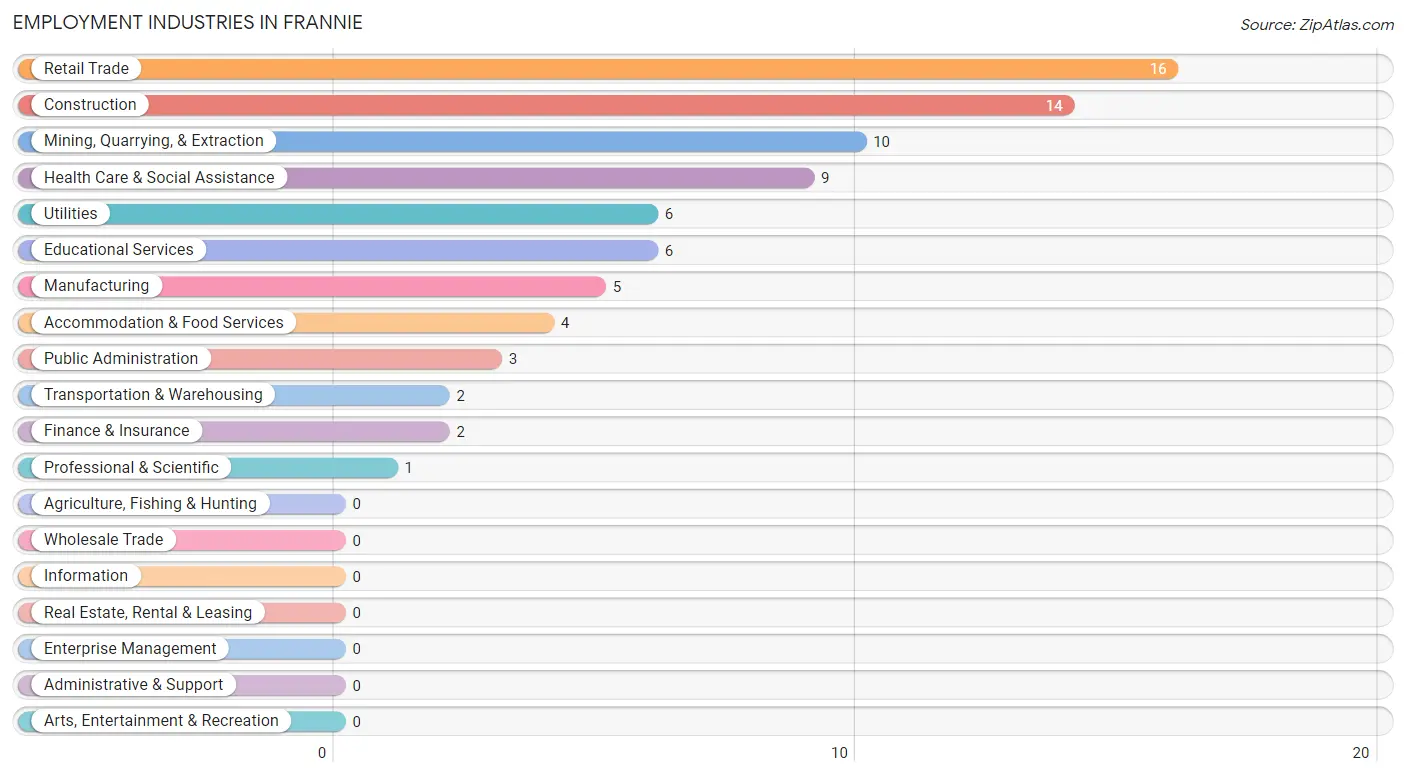
Employment Industries in Frannie
The major employment industries in Frannie include Retail Trade (16 | 20.5%), Construction (14 | 17.9%), Mining, Quarrying, & Extraction (10 | 12.8%), Health Care & Social Assistance (9 | 11.5%), and Utilities (6 | 7.7%).
Employment Industries by Sex in Frannie
The Frannie industries that see more men than women are Mining, Quarrying, & Extraction (100.0%), Construction (100.0%), and Manufacturing (100.0%), whereas the industries that tend to have a higher number of women are Transportation & Warehousing (100.0%), Finance & Insurance (100.0%), and Professional & Scientific (100.0%).
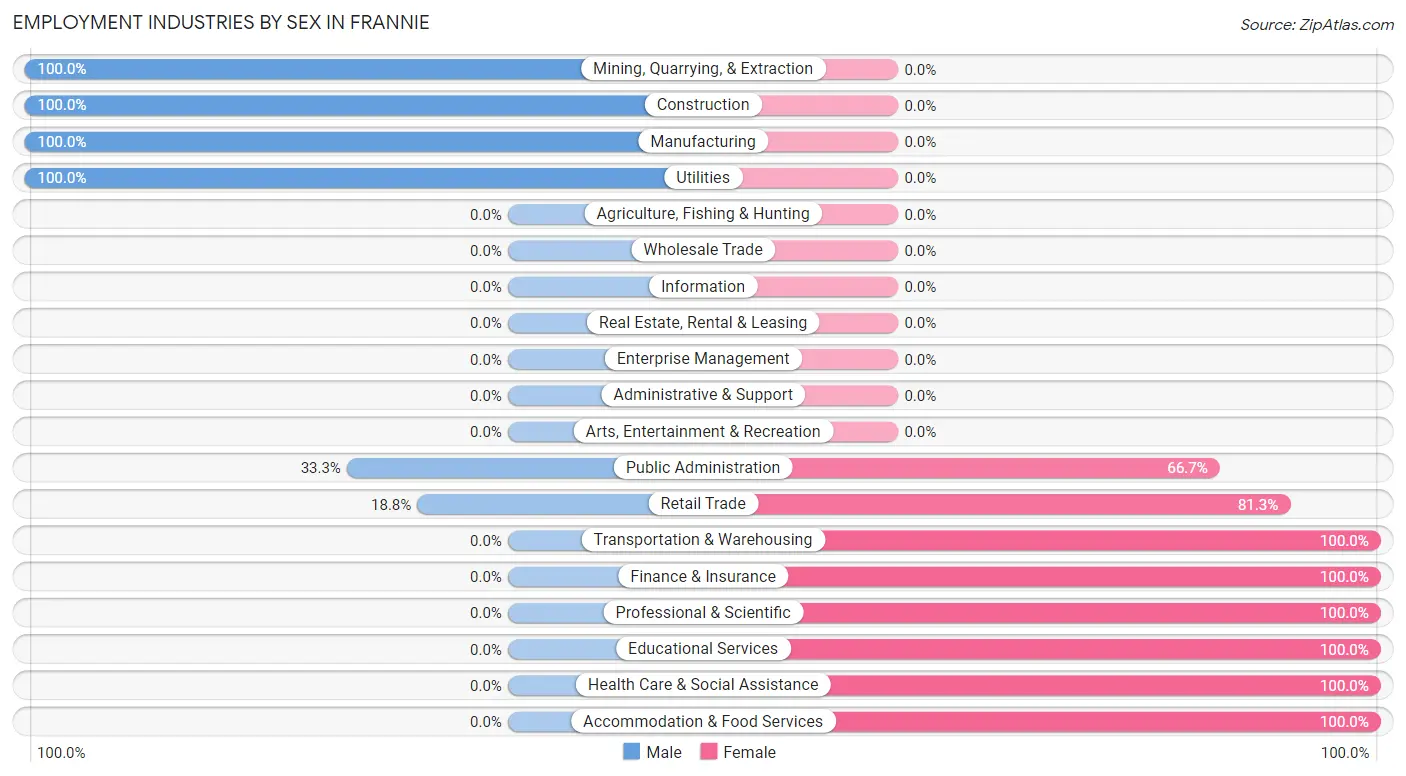
| Industry | Male | Female |
| Agriculture, Fishing & Hunting | 0 (0.0%) | 0 (0.0%) |
| Mining, Quarrying, & Extraction | 10 (100.0%) | 0 (0.0%) |
| Construction | 14 (100.0%) | 0 (0.0%) |
| Manufacturing | 5 (100.0%) | 0 (0.0%) |
| Wholesale Trade | 0 (0.0%) | 0 (0.0%) |
| Retail Trade | 3 (18.8%) | 13 (81.2%) |
| Transportation & Warehousing | 0 (0.0%) | 2 (100.0%) |
| Utilities | 6 (100.0%) | 0 (0.0%) |
| Information | 0 (0.0%) | 0 (0.0%) |
| Finance & Insurance | 0 (0.0%) | 2 (100.0%) |
| Real Estate, Rental & Leasing | 0 (0.0%) | 0 (0.0%) |
| Professional & Scientific | 0 (0.0%) | 1 (100.0%) |
| Enterprise Management | 0 (0.0%) | 0 (0.0%) |
| Administrative & Support | 0 (0.0%) | 0 (0.0%) |
| Educational Services | 0 (0.0%) | 6 (100.0%) |
| Health Care & Social Assistance | 0 (0.0%) | 9 (100.0%) |
| Arts, Entertainment & Recreation | 0 (0.0%) | 0 (0.0%) |
| Accommodation & Food Services | 0 (0.0%) | 4 (100.0%) |
| Public Administration | 1 (33.3%) | 2 (66.7%) |
| Total | 39 (50.0%) | 39 (50.0%) |
Education in Frannie
School Enrollment in Frannie
The most common levels of schooling among the 47 students in Frannie are college / undergraduate (14 | 29.8%), elementary school (12 | 25.5%), and high school (10 | 21.3%).
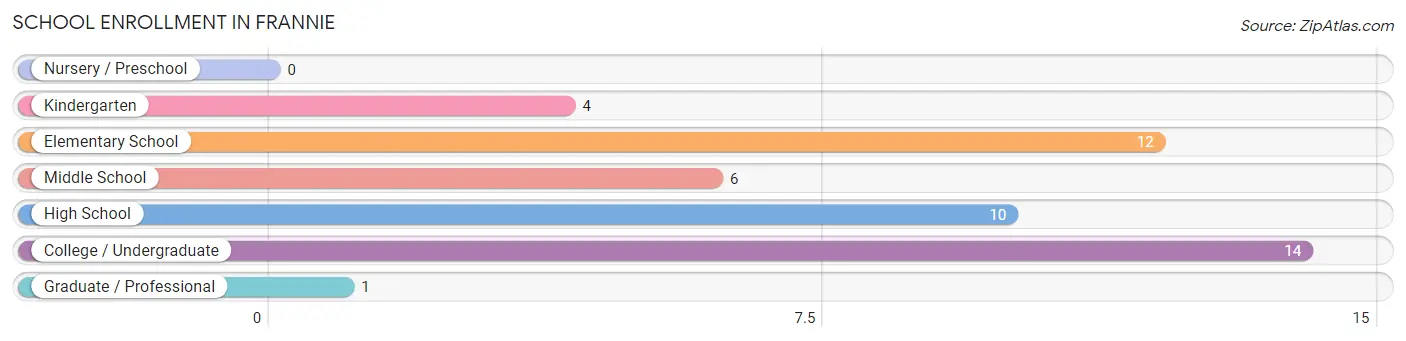
| School Level | # Students | % Students |
| Nursery / Preschool | 0 | 0.0% |
| Kindergarten | 4 | 8.5% |
| Elementary School | 12 | 25.5% |
| Middle School | 6 | 12.8% |
| High School | 10 | 21.3% |
| College / Undergraduate | 14 | 29.8% |
| Graduate / Professional | 1 | 2.1% |
| Total | 47 | 100.0% |
School Enrollment by Age by Funding Source in Frannie
Out of a total of 47 students who are enrolled in schools in Frannie, 7 (14.9%) attend a private institution, while the remaining 40 (85.1%) are enrolled in public schools. The age group of 5 to 9 year old has the highest likelihood of being enrolled in private schools, with 7 (43.8% in the age bracket) enrolled. Conversely, the age group of 10 to 14 year olds has the lowest likelihood of being enrolled in a private school, with 6 (100.0% in the age bracket) attending a public institution.
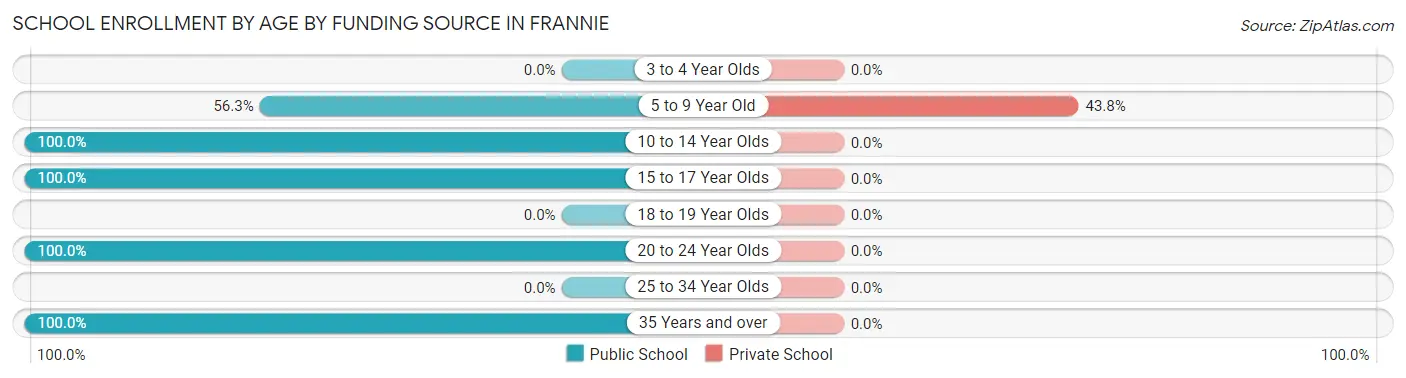
| Age Bracket | Public School | Private School |
| 3 to 4 Year Olds | 0 (0.0%) | 0 (0.0%) |
| 5 to 9 Year Old | 9 (56.2%) | 7 (43.8%) |
| 10 to 14 Year Olds | 6 (100.0%) | 0 (0.0%) |
| 15 to 17 Year Olds | 6 (100.0%) | 0 (0.0%) |
| 18 to 19 Year Olds | 0 (0.0%) | 0 (0.0%) |
| 20 to 24 Year Olds | 4 (100.0%) | 0 (0.0%) |
| 25 to 34 Year Olds | 0 (0.0%) | 0 (0.0%) |
| 35 Years and over | 15 (100.0%) | 0 (0.0%) |
| Total | 40 (85.1%) | 7 (14.9%) |
Educational Attainment by Field of Study in Frannie
Science & technology (6 | 31.6%), communications (4 | 21.0%), arts & humanities (4 | 21.0%), visual & performing arts (3 | 15.8%), and computers & mathematics (1 | 5.3%) are the most common fields of study among 19 individuals in Frannie who have obtained a bachelor's degree or higher.
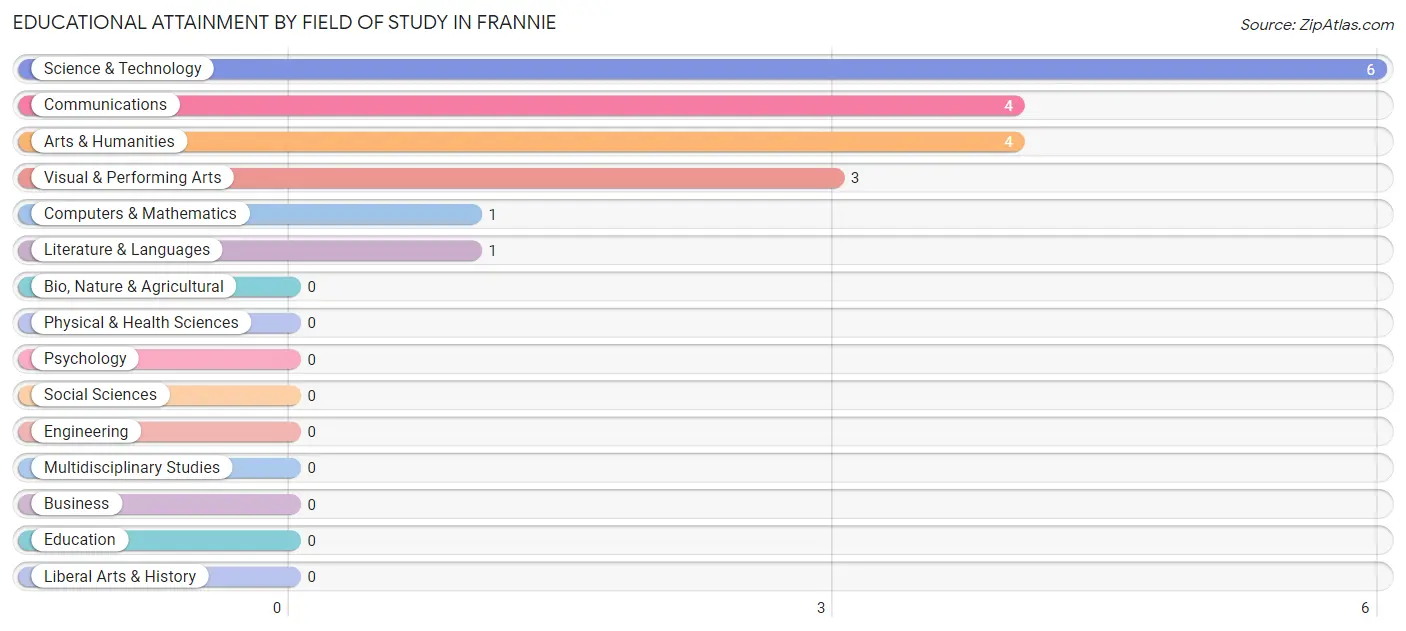
| Field of Study | # Graduates | % Graduates |
| Computers & Mathematics | 1 | 5.3% |
| Bio, Nature & Agricultural | 0 | 0.0% |
| Physical & Health Sciences | 0 | 0.0% |
| Psychology | 0 | 0.0% |
| Social Sciences | 0 | 0.0% |
| Engineering | 0 | 0.0% |
| Multidisciplinary Studies | 0 | 0.0% |
| Science & Technology | 6 | 31.6% |
| Business | 0 | 0.0% |
| Education | 0 | 0.0% |
| Literature & Languages | 1 | 5.3% |
| Liberal Arts & History | 0 | 0.0% |
| Visual & Performing Arts | 3 | 15.8% |
| Communications | 4 | 21.0% |
| Arts & Humanities | 4 | 21.0% |
| Total | 19 | 100.0% |
Transportation & Commute in Frannie
Vehicle Availability by Sex in Frannie
The most prevalent vehicle ownership categories in Frannie are males with 3 vehicles (14, accounting for 37.8%) and females with 3 vehicles (8, making up 35.9%).
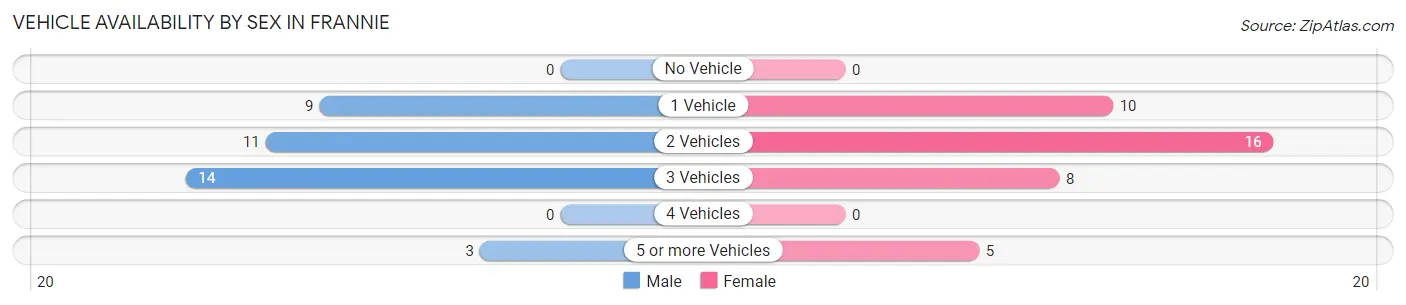
| Vehicles Available | Male | Female |
| No Vehicle | 0 (0.0%) | 0 (0.0%) |
| 1 Vehicle | 9 (24.3%) | 10 (25.6%) |
| 2 Vehicles | 11 (29.7%) | 16 (41.0%) |
| 3 Vehicles | 14 (37.8%) | 8 (20.5%) |
| 4 Vehicles | 0 (0.0%) | 0 (0.0%) |
| 5 or more Vehicles | 3 (8.1%) | 5 (12.8%) |
| Total | 37 (100.0%) | 39 (100.0%) |
Commute Time in Frannie
The most frequently occuring commute durations in Frannie are 60 to 89 minutes (13 commuters, 20.6%), 90 or more minutes (12 commuters, 19.1%), and 20 to 24 minutes (9 commuters, 14.3%).
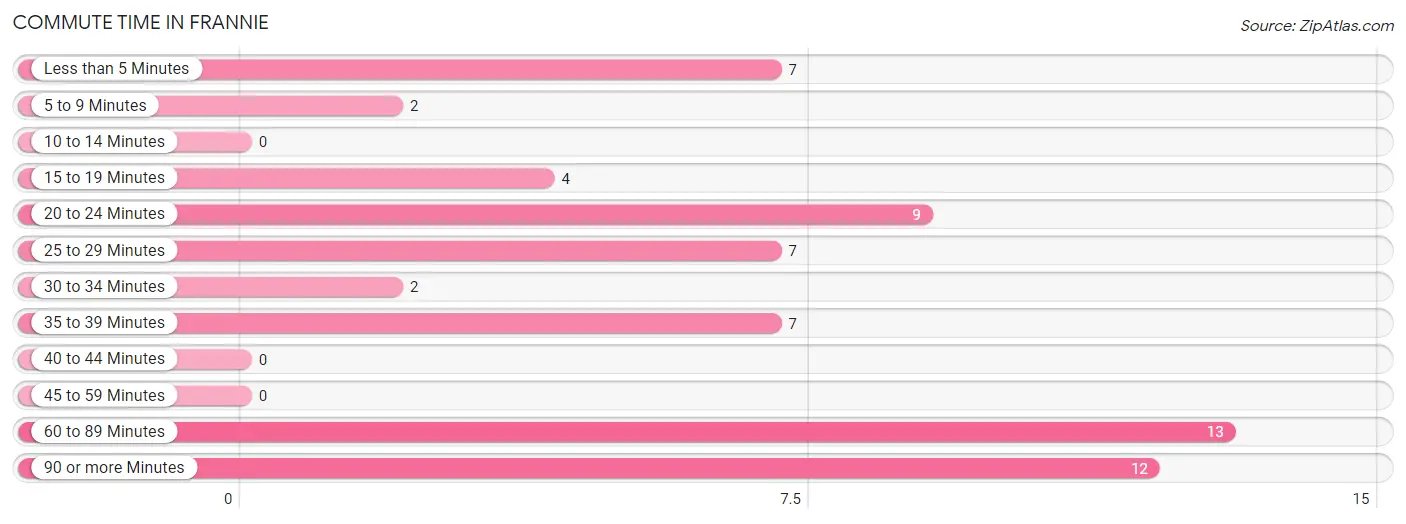
| Commute Time | # Commuters | % Commuters |
| Less than 5 Minutes | 7 | 11.1% |
| 5 to 9 Minutes | 2 | 3.2% |
| 10 to 14 Minutes | 0 | 0.0% |
| 15 to 19 Minutes | 4 | 6.4% |
| 20 to 24 Minutes | 9 | 14.3% |
| 25 to 29 Minutes | 7 | 11.1% |
| 30 to 34 Minutes | 2 | 3.2% |
| 35 to 39 Minutes | 7 | 11.1% |
| 40 to 44 Minutes | 0 | 0.0% |
| 45 to 59 Minutes | 0 | 0.0% |
| 60 to 89 Minutes | 13 | 20.6% |
| 90 or more Minutes | 12 | 19.1% |
Commute Time by Sex in Frannie
The most common commute times in Frannie are 90 or more minutes (12 commuters, 32.4%) for males and 60 to 89 minutes (13 commuters, 50.0%) for females.
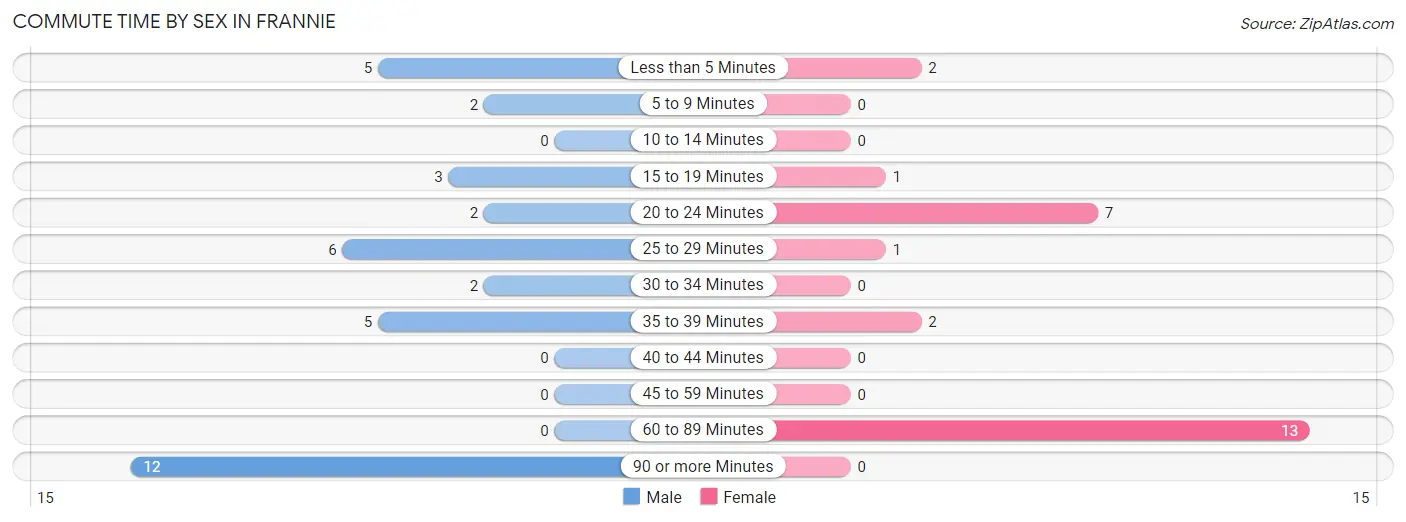
| Commute Time | Male | Female |
| Less than 5 Minutes | 5 (13.5%) | 2 (7.7%) |
| 5 to 9 Minutes | 2 (5.4%) | 0 (0.0%) |
| 10 to 14 Minutes | 0 (0.0%) | 0 (0.0%) |
| 15 to 19 Minutes | 3 (8.1%) | 1 (3.8%) |
| 20 to 24 Minutes | 2 (5.4%) | 7 (26.9%) |
| 25 to 29 Minutes | 6 (16.2%) | 1 (3.8%) |
| 30 to 34 Minutes | 2 (5.4%) | 0 (0.0%) |
| 35 to 39 Minutes | 5 (13.5%) | 2 (7.7%) |
| 40 to 44 Minutes | 0 (0.0%) | 0 (0.0%) |
| 45 to 59 Minutes | 0 (0.0%) | 0 (0.0%) |
| 60 to 89 Minutes | 0 (0.0%) | 13 (50.0%) |
| 90 or more Minutes | 12 (32.4%) | 0 (0.0%) |
Time of Departure to Work by Sex in Frannie
The most frequent times of departure to work in Frannie are 5:30 AM to 5:59 AM (9, 24.3%) for males and 6:00 AM to 6:29 AM (6, 23.1%) for females.
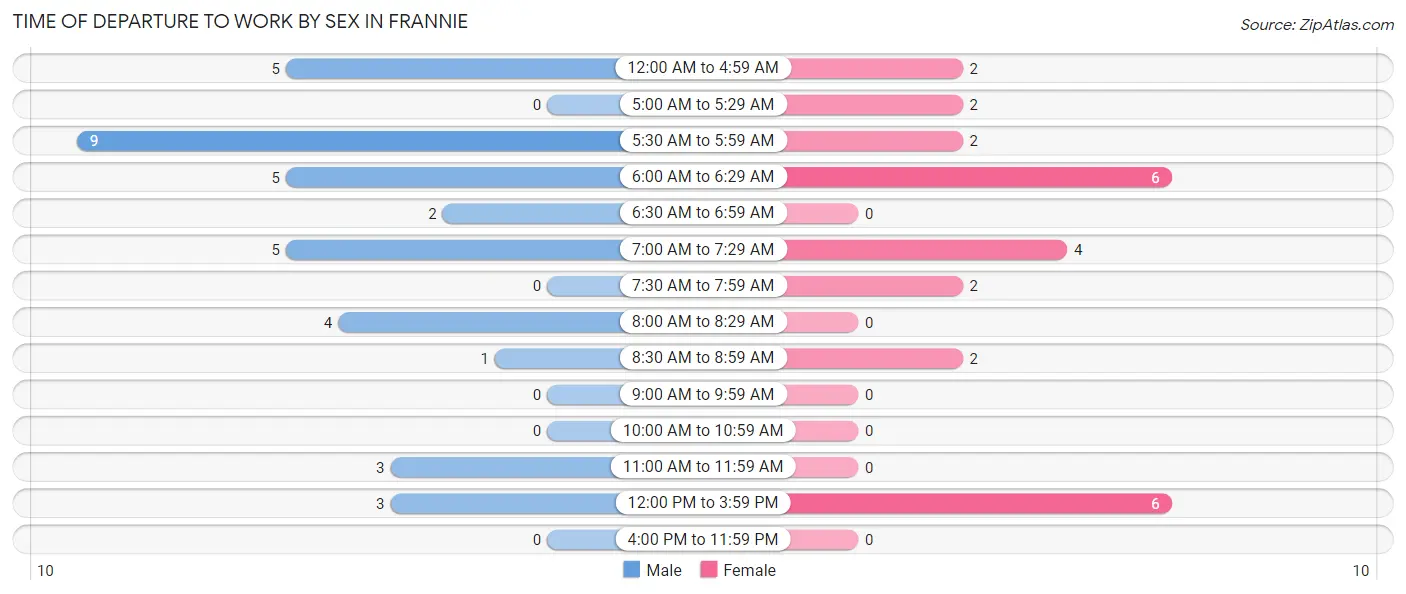
| Time of Departure | Male | Female |
| 12:00 AM to 4:59 AM | 5 (13.5%) | 2 (7.7%) |
| 5:00 AM to 5:29 AM | 0 (0.0%) | 2 (7.7%) |
| 5:30 AM to 5:59 AM | 9 (24.3%) | 2 (7.7%) |
| 6:00 AM to 6:29 AM | 5 (13.5%) | 6 (23.1%) |
| 6:30 AM to 6:59 AM | 2 (5.4%) | 0 (0.0%) |
| 7:00 AM to 7:29 AM | 5 (13.5%) | 4 (15.4%) |
| 7:30 AM to 7:59 AM | 0 (0.0%) | 2 (7.7%) |
| 8:00 AM to 8:29 AM | 4 (10.8%) | 0 (0.0%) |
| 8:30 AM to 8:59 AM | 1 (2.7%) | 2 (7.7%) |
| 9:00 AM to 9:59 AM | 0 (0.0%) | 0 (0.0%) |
| 10:00 AM to 10:59 AM | 0 (0.0%) | 0 (0.0%) |
| 11:00 AM to 11:59 AM | 3 (8.1%) | 0 (0.0%) |
| 12:00 PM to 3:59 PM | 3 (8.1%) | 6 (23.1%) |
| 4:00 PM to 11:59 PM | 0 (0.0%) | 0 (0.0%) |
| Total | 37 (100.0%) | 26 (100.0%) |
Housing Occupancy in Frannie
Occupancy by Ownership in Frannie
Of the total 75 dwellings in Frannie, owner-occupied units account for 44 (58.7%), while renter-occupied units make up 31 (41.3%).
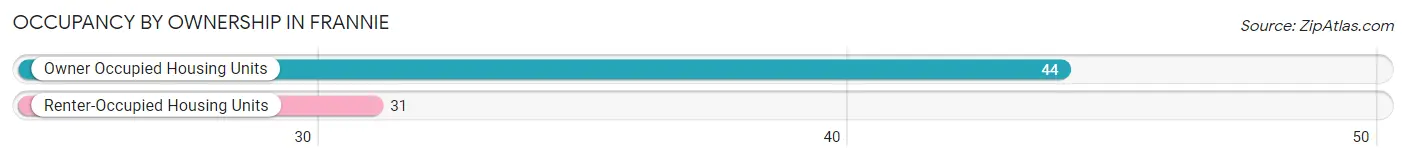
| Occupancy | # Housing Units | % Housing Units |
| Owner Occupied Housing Units | 44 | 58.7% |
| Renter-Occupied Housing Units | 31 | 41.3% |
| Total Occupied Housing Units | 75 | 100.0% |
Occupancy by Household Size in Frannie
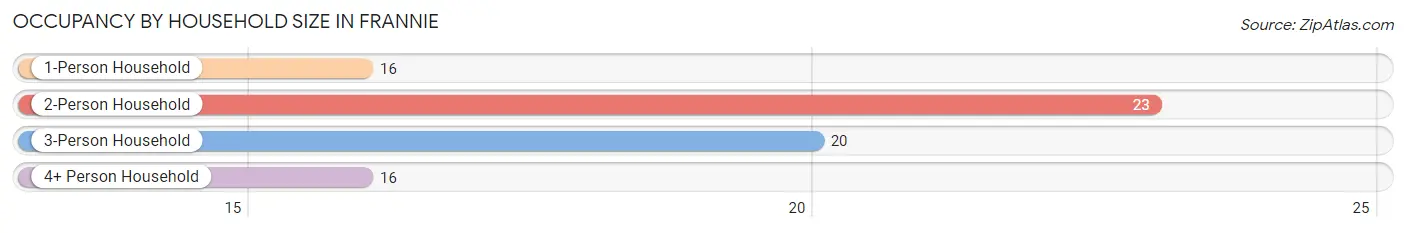
| Household Size | # Housing Units | % Housing Units |
| 1-Person Household | 16 | 21.3% |
| 2-Person Household | 23 | 30.7% |
| 3-Person Household | 20 | 26.7% |
| 4+ Person Household | 16 | 21.3% |
| Total Housing Units | 75 | 100.0% |
Occupancy by Ownership by Household Size in Frannie
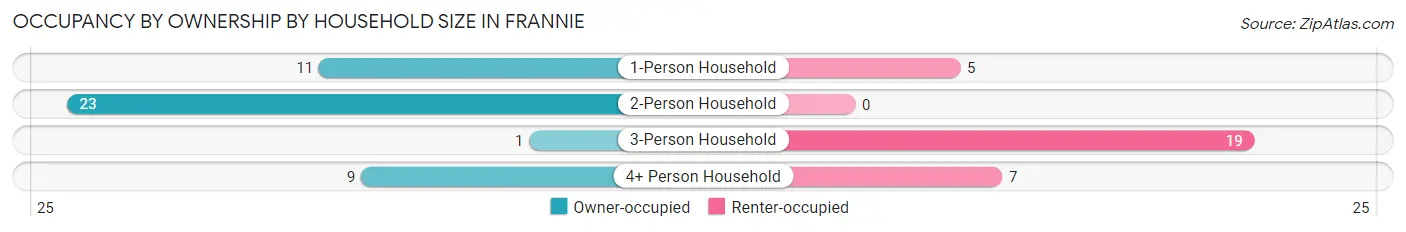
| Household Size | Owner-occupied | Renter-occupied |
| 1-Person Household | 11 (68.8%) | 5 (31.2%) |
| 2-Person Household | 23 (100.0%) | 0 (0.0%) |
| 3-Person Household | 1 (5.0%) | 19 (95.0%) |
| 4+ Person Household | 9 (56.2%) | 7 (43.8%) |
| Total Housing Units | 44 (58.7%) | 31 (41.3%) |
Occupancy by Educational Attainment in Frannie
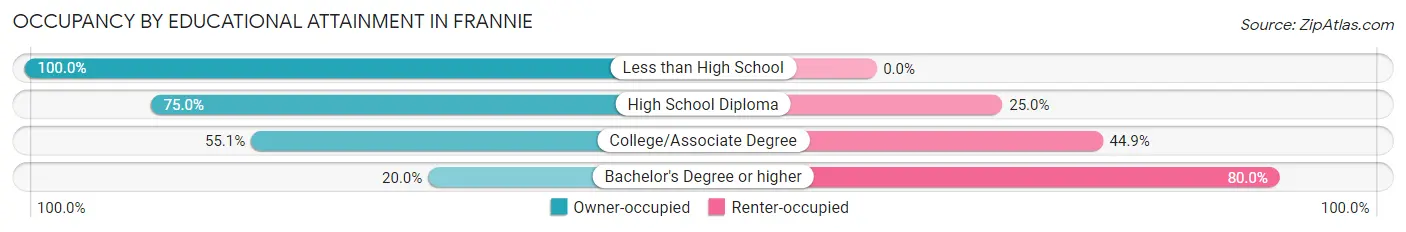
| Household Size | Owner-occupied | Renter-occupied |
| Less than High School | 1 (100.0%) | 0 (0.0%) |
| High School Diploma | 15 (75.0%) | 5 (25.0%) |
| College/Associate Degree | 27 (55.1%) | 22 (44.9%) |
| Bachelor's Degree or higher | 1 (20.0%) | 4 (80.0%) |
Occupancy by Age of Householder in Frannie
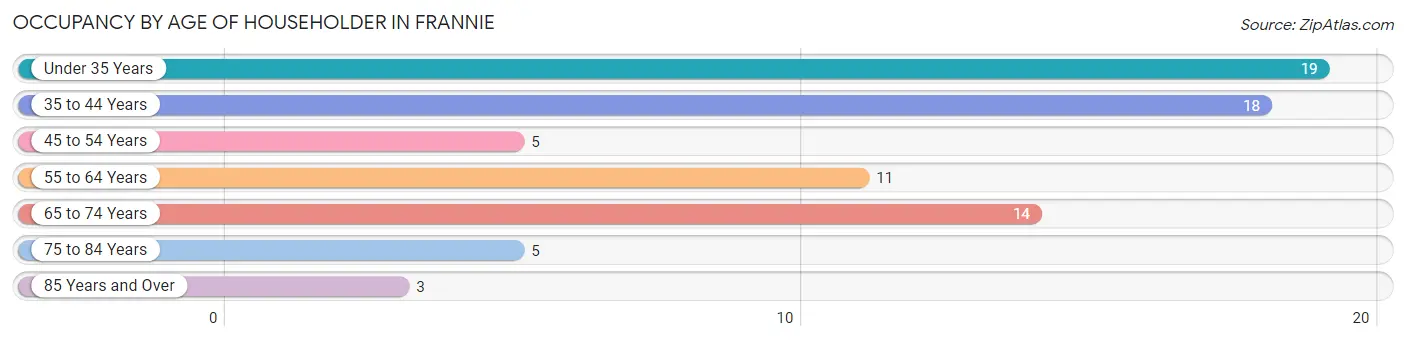
| Age Bracket | # Households | % Households |
| Under 35 Years | 19 | 25.3% |
| 35 to 44 Years | 18 | 24.0% |
| 45 to 54 Years | 5 | 6.7% |
| 55 to 64 Years | 11 | 14.7% |
| 65 to 74 Years | 14 | 18.7% |
| 75 to 84 Years | 5 | 6.7% |
| 85 Years and Over | 3 | 4.0% |
| Total | 75 | 100.0% |
Housing Finances in Frannie
Median Income by Occupancy in Frannie
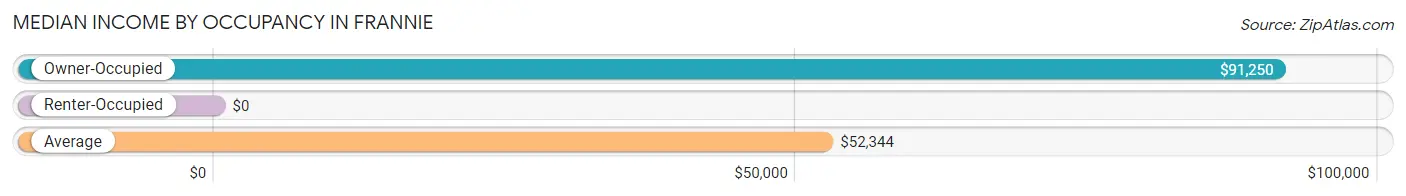
| Occupancy Type | # Households | Median Income |
| Owner-Occupied | 44 (58.7%) | $91,250 |
| Renter-Occupied | 31 (41.3%) | $0 |
| Average | 75 (100.0%) | $52,344 |
Occupancy by Householder Income Bracket in Frannie
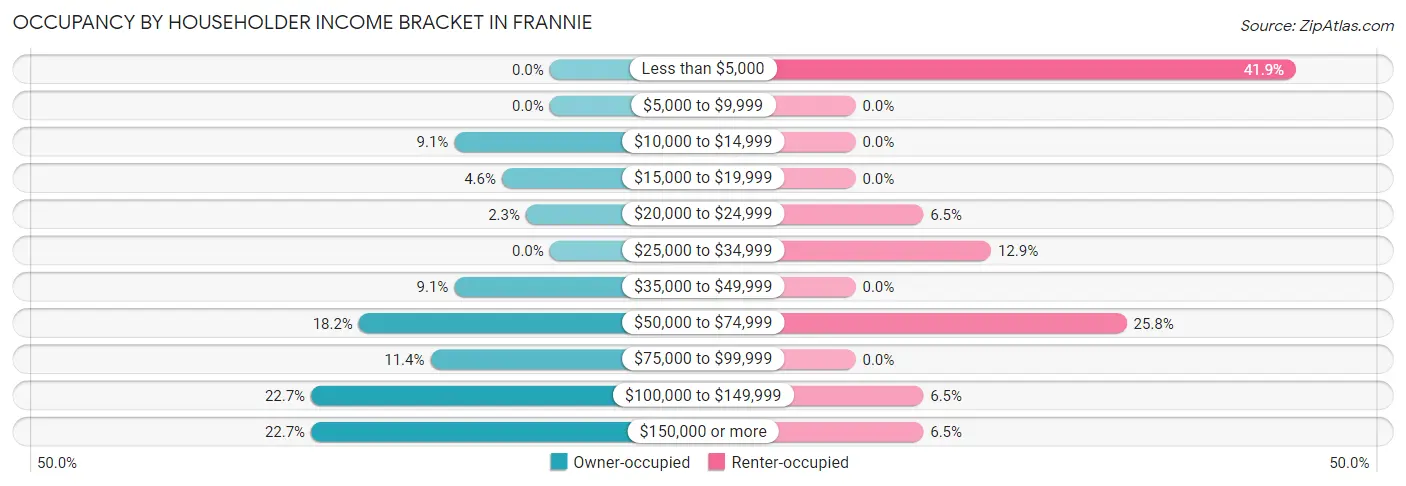
| Income Bracket | Owner-occupied | Renter-occupied |
| Less than $5,000 | 0 (0.0%) | 13 (41.9%) |
| $5,000 to $9,999 | 0 (0.0%) | 0 (0.0%) |
| $10,000 to $14,999 | 4 (9.1%) | 0 (0.0%) |
| $15,000 to $19,999 | 2 (4.5%) | 0 (0.0%) |
| $20,000 to $24,999 | 1 (2.3%) | 2 (6.5%) |
| $25,000 to $34,999 | 0 (0.0%) | 4 (12.9%) |
| $35,000 to $49,999 | 4 (9.1%) | 0 (0.0%) |
| $50,000 to $74,999 | 8 (18.2%) | 8 (25.8%) |
| $75,000 to $99,999 | 5 (11.4%) | 0 (0.0%) |
| $100,000 to $149,999 | 10 (22.7%) | 2 (6.5%) |
| $150,000 or more | 10 (22.7%) | 2 (6.5%) |
| Total | 44 (100.0%) | 31 (100.0%) |
Monthly Housing Cost Tiers in Frannie
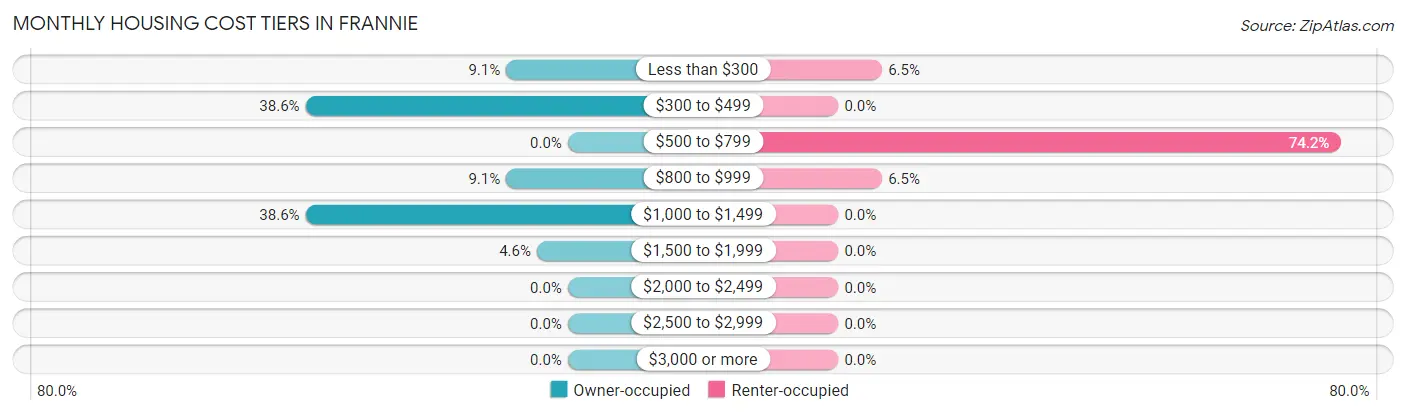
| Monthly Cost | Owner-occupied | Renter-occupied |
| Less than $300 | 4 (9.1%) | 2 (6.5%) |
| $300 to $499 | 17 (38.6%) | 0 (0.0%) |
| $500 to $799 | 0 (0.0%) | 23 (74.2%) |
| $800 to $999 | 4 (9.1%) | 2 (6.5%) |
| $1,000 to $1,499 | 17 (38.6%) | 0 (0.0%) |
| $1,500 to $1,999 | 2 (4.5%) | 0 (0.0%) |
| $2,000 to $2,499 | 0 (0.0%) | 0 (0.0%) |
| $2,500 to $2,999 | 0 (0.0%) | 0 (0.0%) |
| $3,000 or more | 0 (0.0%) | 0 (0.0%) |
| Total | 44 (100.0%) | 31 (100.0%) |
Physical Housing Characteristics in Frannie
Housing Structures in Frannie
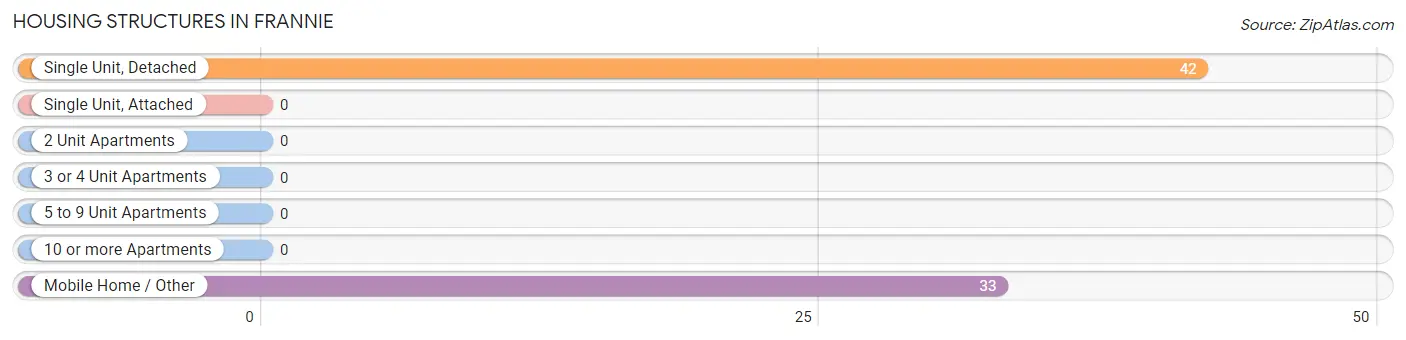
| Structure Type | # Housing Units | % Housing Units |
| Single Unit, Detached | 42 | 56.0% |
| Single Unit, Attached | 0 | 0.0% |
| 2 Unit Apartments | 0 | 0.0% |
| 3 or 4 Unit Apartments | 0 | 0.0% |
| 5 to 9 Unit Apartments | 0 | 0.0% |
| 10 or more Apartments | 0 | 0.0% |
| Mobile Home / Other | 33 | 44.0% |
| Total | 75 | 100.0% |
Housing Structures by Occupancy in Frannie
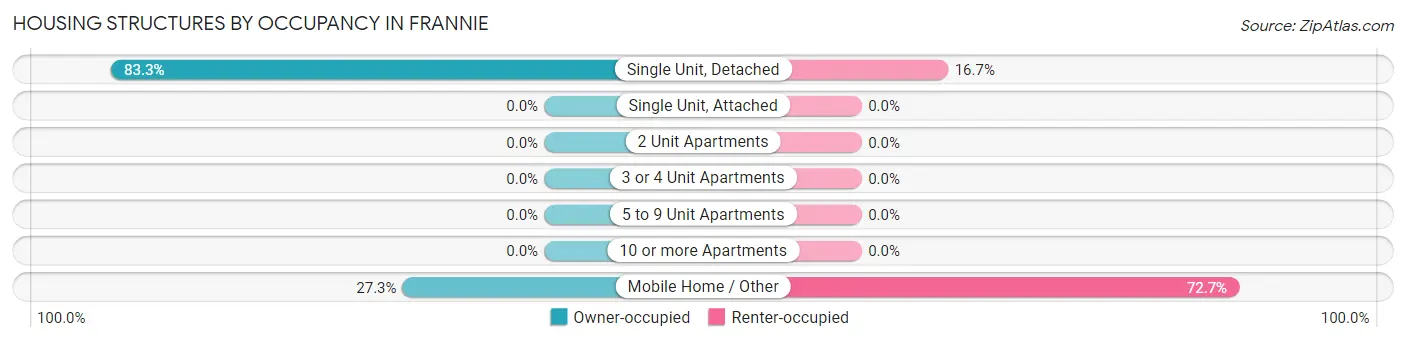
| Structure Type | Owner-occupied | Renter-occupied |
| Single Unit, Detached | 35 (83.3%) | 7 (16.7%) |
| Single Unit, Attached | 0 (0.0%) | 0 (0.0%) |
| 2 Unit Apartments | 0 (0.0%) | 0 (0.0%) |
| 3 or 4 Unit Apartments | 0 (0.0%) | 0 (0.0%) |
| 5 to 9 Unit Apartments | 0 (0.0%) | 0 (0.0%) |
| 10 or more Apartments | 0 (0.0%) | 0 (0.0%) |
| Mobile Home / Other | 9 (27.3%) | 24 (72.7%) |
| Total | 44 (58.7%) | 31 (41.3%) |
Housing Structures by Number of Rooms in Frannie
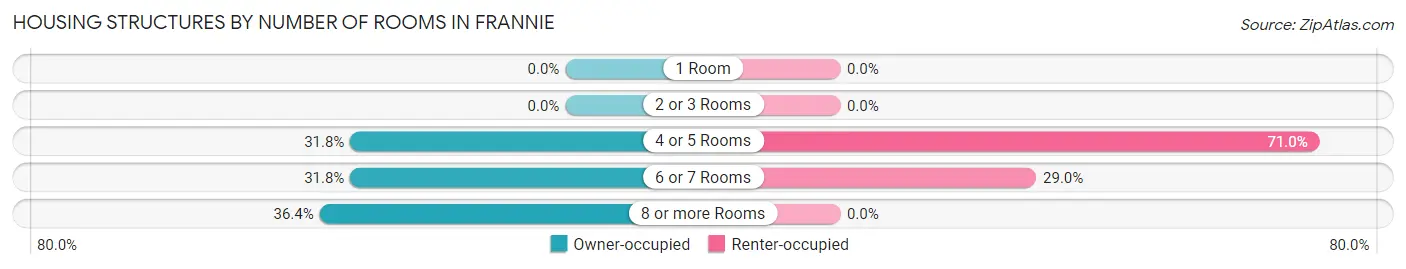
| Number of Rooms | Owner-occupied | Renter-occupied |
| 1 Room | 0 (0.0%) | 0 (0.0%) |
| 2 or 3 Rooms | 0 (0.0%) | 0 (0.0%) |
| 4 or 5 Rooms | 14 (31.8%) | 22 (71.0%) |
| 6 or 7 Rooms | 14 (31.8%) | 9 (29.0%) |
| 8 or more Rooms | 16 (36.4%) | 0 (0.0%) |
| Total | 44 (100.0%) | 31 (100.0%) |
Housing Structure by Heating Type in Frannie
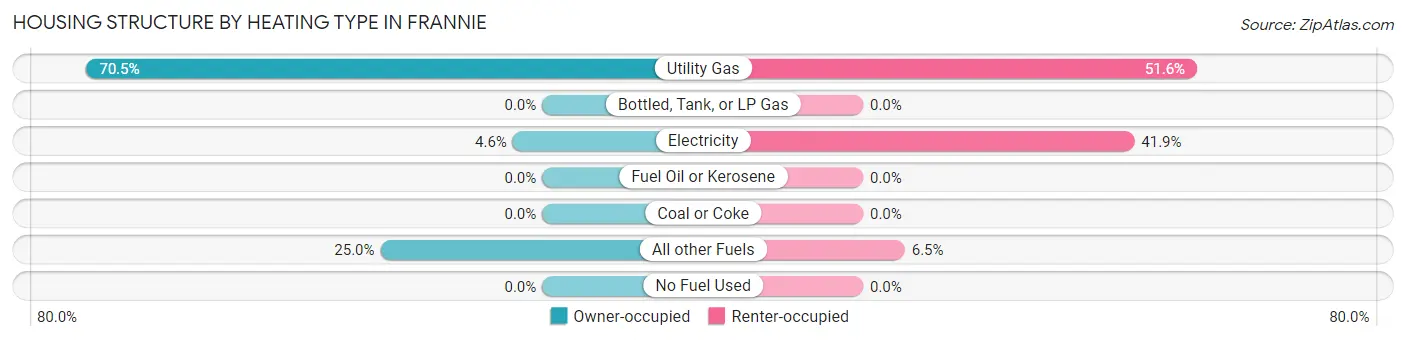
| Heating Type | Owner-occupied | Renter-occupied |
| Utility Gas | 31 (70.5%) | 16 (51.6%) |
| Bottled, Tank, or LP Gas | 0 (0.0%) | 0 (0.0%) |
| Electricity | 2 (4.5%) | 13 (41.9%) |
| Fuel Oil or Kerosene | 0 (0.0%) | 0 (0.0%) |
| Coal or Coke | 0 (0.0%) | 0 (0.0%) |
| All other Fuels | 11 (25.0%) | 2 (6.5%) |
| No Fuel Used | 0 (0.0%) | 0 (0.0%) |
| Total | 44 (100.0%) | 31 (100.0%) |
Household Vehicle Usage in Frannie
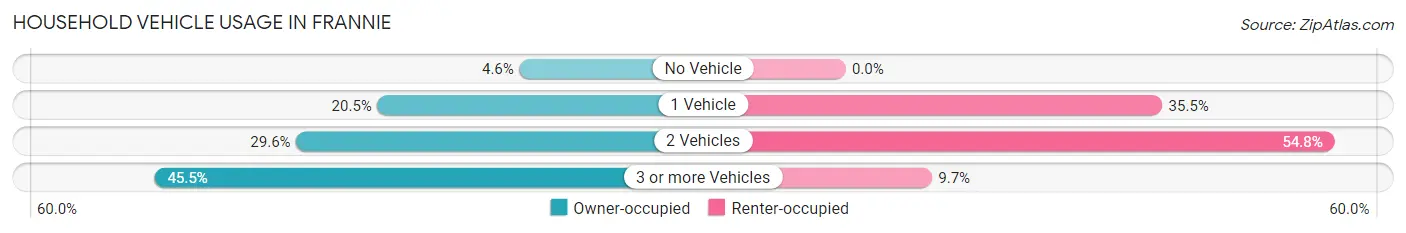
| Vehicles per Household | Owner-occupied | Renter-occupied |
| No Vehicle | 2 (4.5%) | 0 (0.0%) |
| 1 Vehicle | 9 (20.4%) | 11 (35.5%) |
| 2 Vehicles | 13 (29.5%) | 17 (54.8%) |
| 3 or more Vehicles | 20 (45.5%) | 3 (9.7%) |
| Total | 44 (100.0%) | 31 (100.0%) |
Real Estate & Mortgages in Frannie
Real Estate and Mortgage Overview in Frannie
| Characteristic | Without Mortgage | With Mortgage |
| Housing Units | 21 | 23 |
| Median Property Value | - | - |
| Median Household Income | - | - |
| Monthly Housing Costs | $363 | $0 |
| Real Estate Taxes | $580 | $0 |
Property Value by Mortgage Status in Frannie
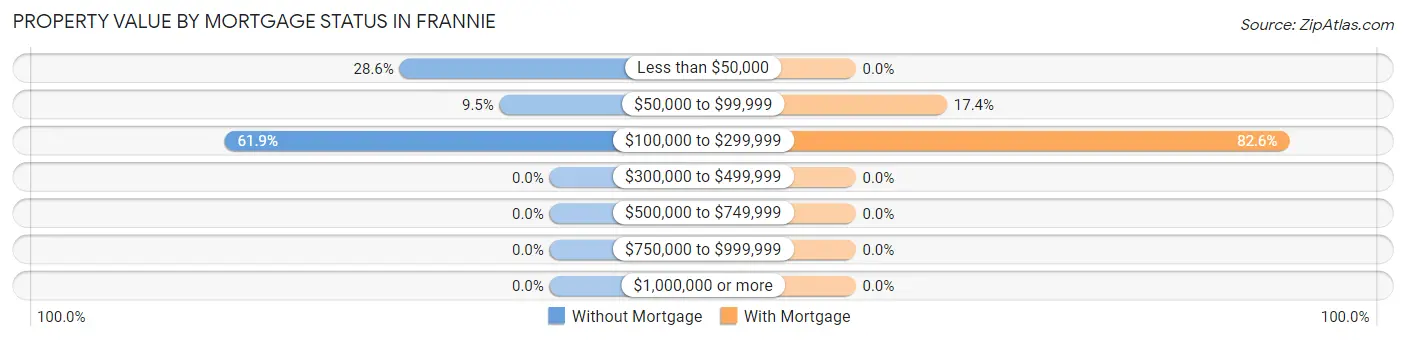
| Property Value | Without Mortgage | With Mortgage |
| Less than $50,000 | 6 (28.6%) | 0 (0.0%) |
| $50,000 to $99,999 | 2 (9.5%) | 4 (17.4%) |
| $100,000 to $299,999 | 13 (61.9%) | 19 (82.6%) |
| $300,000 to $499,999 | 0 (0.0%) | 0 (0.0%) |
| $500,000 to $749,999 | 0 (0.0%) | 0 (0.0%) |
| $750,000 to $999,999 | 0 (0.0%) | 0 (0.0%) |
| $1,000,000 or more | 0 (0.0%) | 0 (0.0%) |
| Total | 21 (100.0%) | 23 (100.0%) |
Household Income by Mortgage Status in Frannie
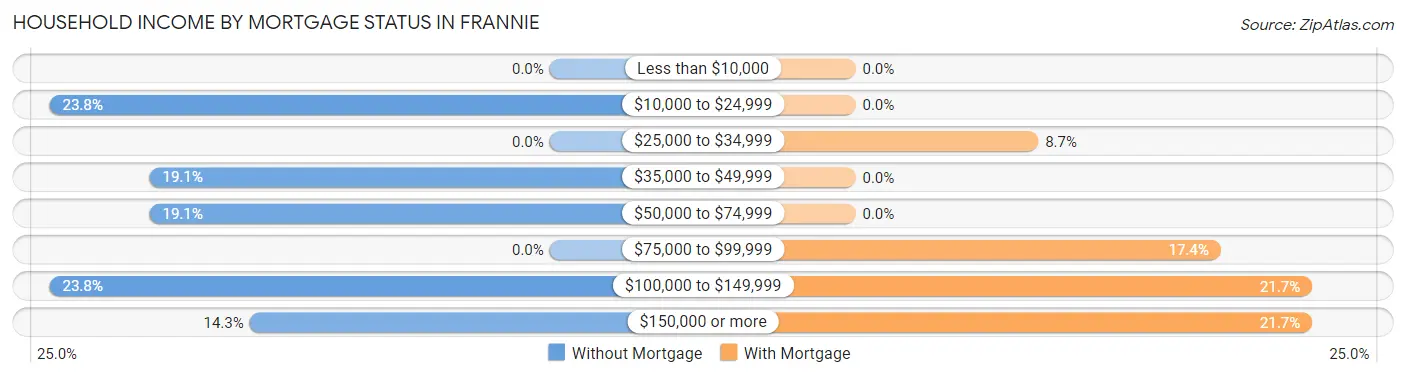
| Household Income | Without Mortgage | With Mortgage |
| Less than $10,000 | 0 (0.0%) | 0 (0.0%) |
| $10,000 to $24,999 | 5 (23.8%) | 0 (0.0%) |
| $25,000 to $34,999 | 0 (0.0%) | 2 (8.7%) |
| $35,000 to $49,999 | 4 (19.1%) | 0 (0.0%) |
| $50,000 to $74,999 | 4 (19.1%) | 0 (0.0%) |
| $75,000 to $99,999 | 0 (0.0%) | 4 (17.4%) |
| $100,000 to $149,999 | 5 (23.8%) | 5 (21.7%) |
| $150,000 or more | 3 (14.3%) | 5 (21.7%) |
| Total | 21 (100.0%) | 23 (100.0%) |
Property Value to Household Income Ratio in Frannie
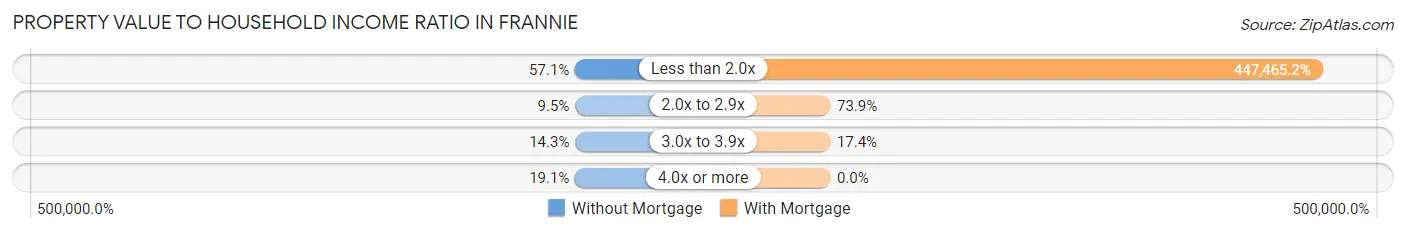
| Value-to-Income Ratio | Without Mortgage | With Mortgage |
| Less than 2.0x | 12 (57.1%) | 102,917 (447,465.2%) |
| 2.0x to 2.9x | 2 (9.5%) | 17 (73.9%) |
| 3.0x to 3.9x | 3 (14.3%) | 4 (17.4%) |
| 4.0x or more | 4 (19.1%) | 0 (0.0%) |
| Total | 21 (100.0%) | 23 (100.0%) |
Real Estate Taxes by Mortgage Status in Frannie
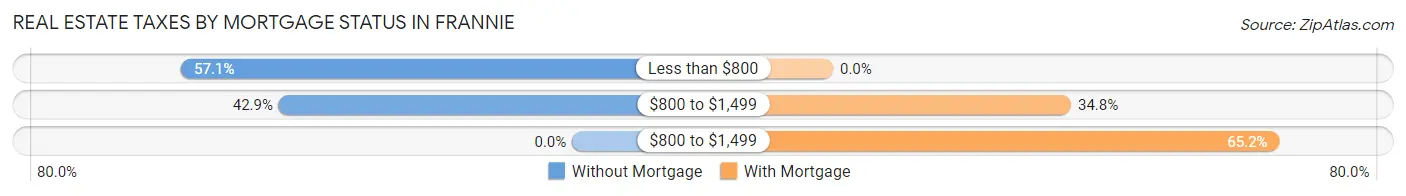
| Property Taxes | Without Mortgage | With Mortgage |
| Less than $800 | 12 (57.1%) | 0 (0.0%) |
| $800 to $1,499 | 9 (42.9%) | 8 (34.8%) |
| $800 to $1,499 | 0 (0.0%) | 15 (65.2%) |
| Total | 21 (100.0%) | 23 (100.0%) |
Health & Disability in Frannie
Health Insurance Coverage by Age in Frannie
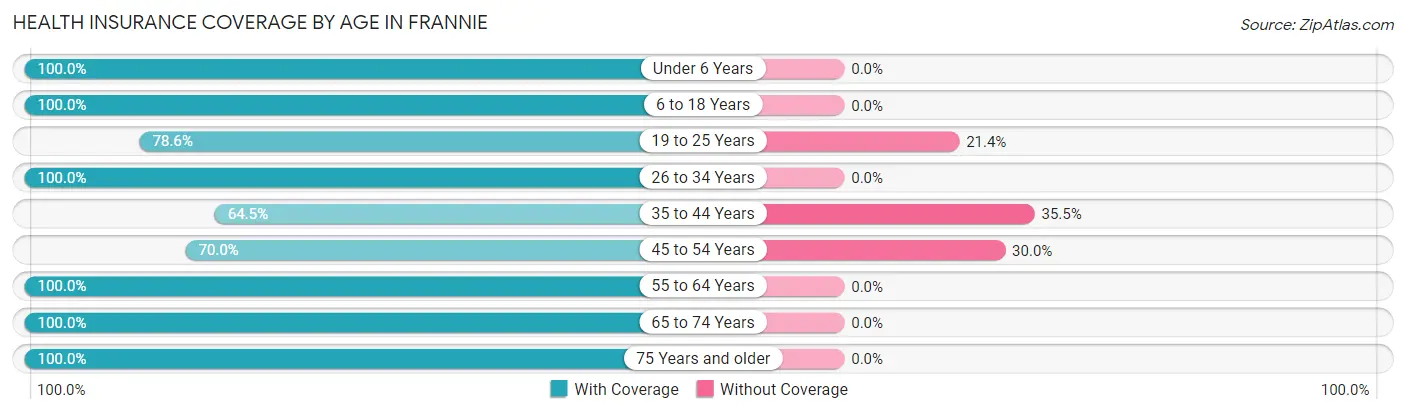
| Age Bracket | With Coverage | Without Coverage |
| Under 6 Years | 25 (100.0%) | 0 (0.0%) |
| 6 to 18 Years | 27 (100.0%) | 0 (0.0%) |
| 19 to 25 Years | 22 (78.6%) | 6 (21.4%) |
| 26 to 34 Years | 22 (100.0%) | 0 (0.0%) |
| 35 to 44 Years | 20 (64.5%) | 11 (35.5%) |
| 45 to 54 Years | 14 (70.0%) | 6 (30.0%) |
| 55 to 64 Years | 22 (100.0%) | 0 (0.0%) |
| 65 to 74 Years | 30 (100.0%) | 0 (0.0%) |
| 75 Years and older | 8 (100.0%) | 0 (0.0%) |
| Total | 190 (89.2%) | 23 (10.8%) |
Health Insurance Coverage by Citizenship Status in Frannie
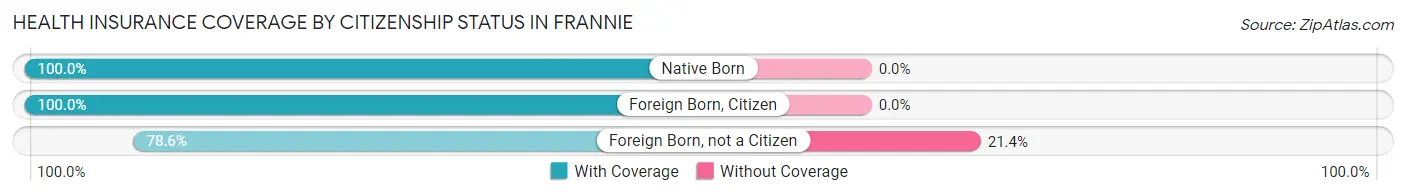
| Citizenship Status | With Coverage | Without Coverage |
| Native Born | 25 (100.0%) | 0 (0.0%) |
| Foreign Born, Citizen | 27 (100.0%) | 0 (0.0%) |
| Foreign Born, not a Citizen | 22 (78.6%) | 6 (21.4%) |
Health Insurance Coverage by Household Income in Frannie
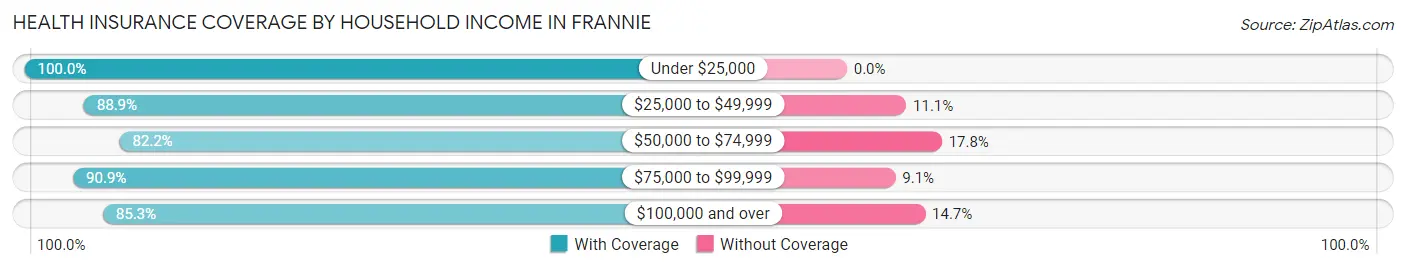
| Household Income | With Coverage | Without Coverage |
| Under $25,000 | 53 (100.0%) | 0 (0.0%) |
| $25,000 to $49,999 | 16 (88.9%) | 2 (11.1%) |
| $50,000 to $74,999 | 37 (82.2%) | 8 (17.8%) |
| $75,000 to $99,999 | 20 (90.9%) | 2 (9.1%) |
| $100,000 and over | 64 (85.3%) | 11 (14.7%) |
Public vs Private Health Insurance Coverage by Age in Frannie
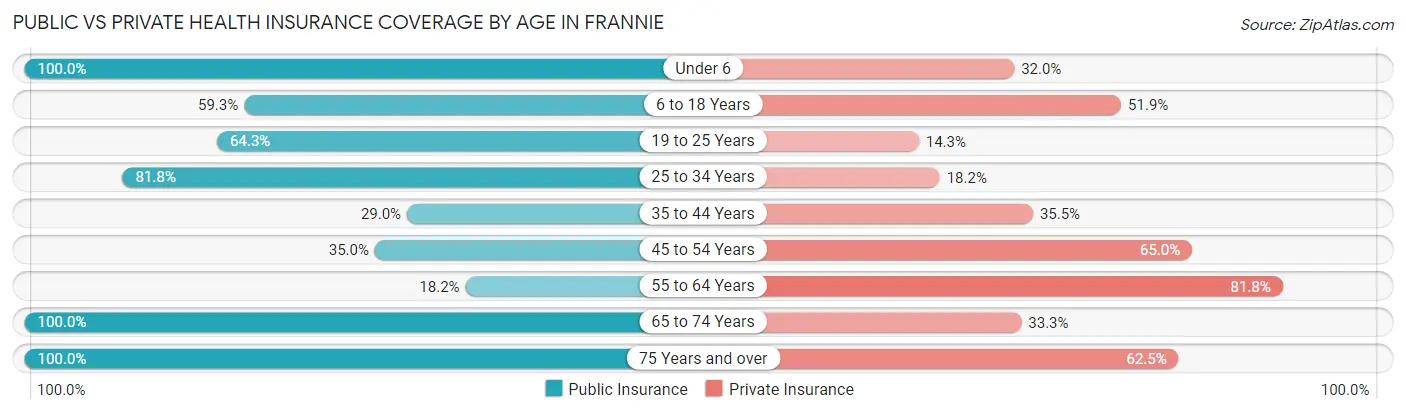
| Age Bracket | Public Insurance | Private Insurance |
| Under 6 | 25 (100.0%) | 8 (32.0%) |
| 6 to 18 Years | 16 (59.3%) | 14 (51.8%) |
| 19 to 25 Years | 18 (64.3%) | 4 (14.3%) |
| 25 to 34 Years | 18 (81.8%) | 4 (18.2%) |
| 35 to 44 Years | 9 (29.0%) | 11 (35.5%) |
| 45 to 54 Years | 7 (35.0%) | 13 (65.0%) |
| 55 to 64 Years | 4 (18.2%) | 18 (81.8%) |
| 65 to 74 Years | 30 (100.0%) | 10 (33.3%) |
| 75 Years and over | 8 (100.0%) | 5 (62.5%) |
| Total | 135 (63.4%) | 87 (40.8%) |
Disability Status by Sex by Age in Frannie
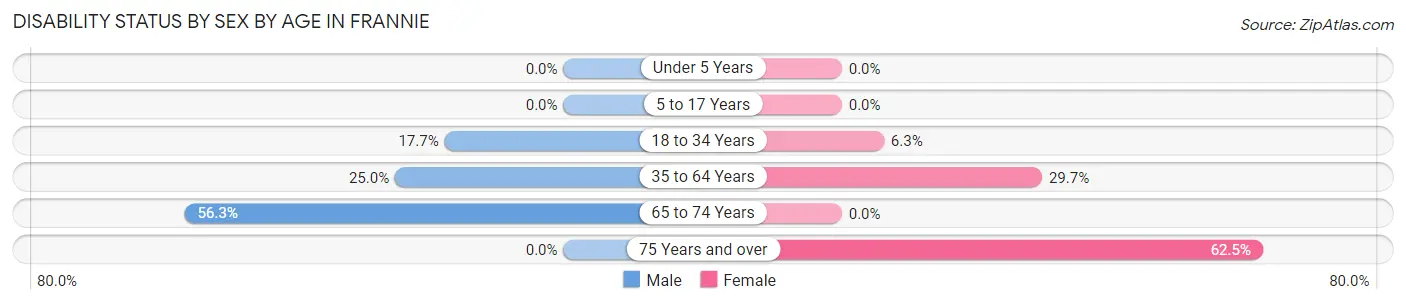
| Age Bracket | Male | Female |
| Under 5 Years | 0 (0.0%) | 0 (0.0%) |
| 5 to 17 Years | 0 (0.0%) | 0 (0.0%) |
| 18 to 34 Years | 6 (17.6%) | 1 (6.2%) |
| 35 to 64 Years | 9 (25.0%) | 11 (29.7%) |
| 65 to 74 Years | 9 (56.2%) | 0 (0.0%) |
| 75 Years and over | 0 (0.0%) | 5 (62.5%) |
Disability Class by Sex by Age in Frannie
Disability Class: Hearing Difficulty
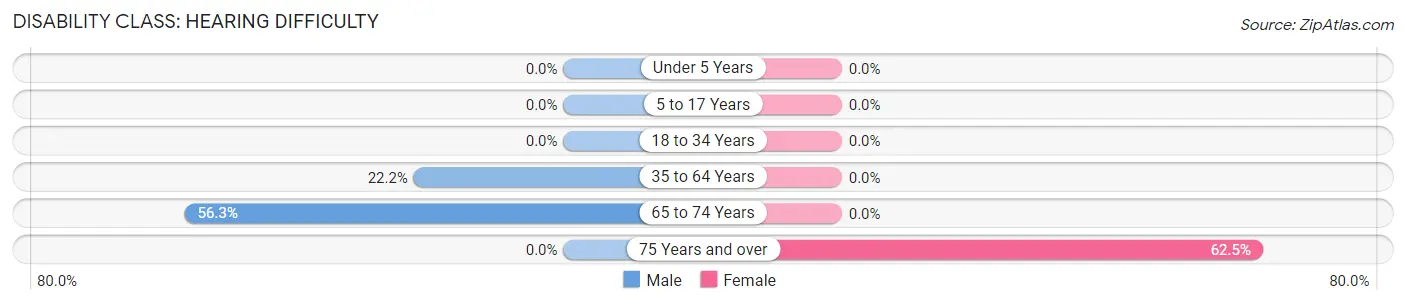
| Age Bracket | Male | Female |
| Under 5 Years | 0 (0.0%) | 0 (0.0%) |
| 5 to 17 Years | 0 (0.0%) | 0 (0.0%) |
| 18 to 34 Years | 0 (0.0%) | 0 (0.0%) |
| 35 to 64 Years | 8 (22.2%) | 0 (0.0%) |
| 65 to 74 Years | 9 (56.2%) | 0 (0.0%) |
| 75 Years and over | 0 (0.0%) | 5 (62.5%) |
Disability Class: Vision Difficulty
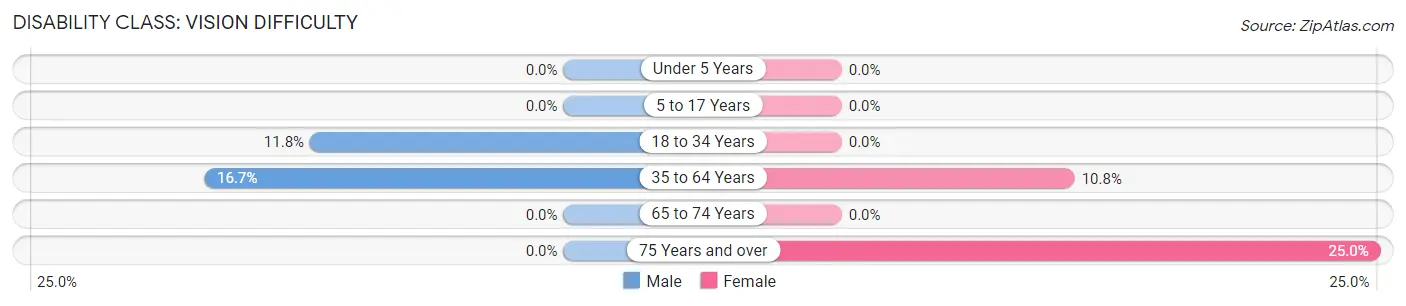
| Age Bracket | Male | Female |
| Under 5 Years | 0 (0.0%) | 0 (0.0%) |
| 5 to 17 Years | 0 (0.0%) | 0 (0.0%) |
| 18 to 34 Years | 4 (11.8%) | 0 (0.0%) |
| 35 to 64 Years | 6 (16.7%) | 4 (10.8%) |
| 65 to 74 Years | 0 (0.0%) | 0 (0.0%) |
| 75 Years and over | 0 (0.0%) | 2 (25.0%) |
Disability Class: Cognitive Difficulty
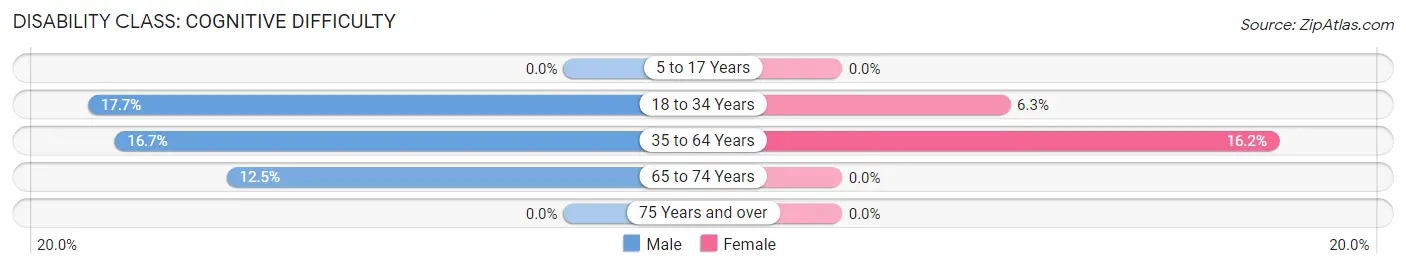
| Age Bracket | Male | Female |
| 5 to 17 Years | 0 (0.0%) | 0 (0.0%) |
| 18 to 34 Years | 6 (17.6%) | 1 (6.2%) |
| 35 to 64 Years | 6 (16.7%) | 6 (16.2%) |
| 65 to 74 Years | 2 (12.5%) | 0 (0.0%) |
| 75 Years and over | 0 (0.0%) | 0 (0.0%) |
Disability Class: Ambulatory Difficulty
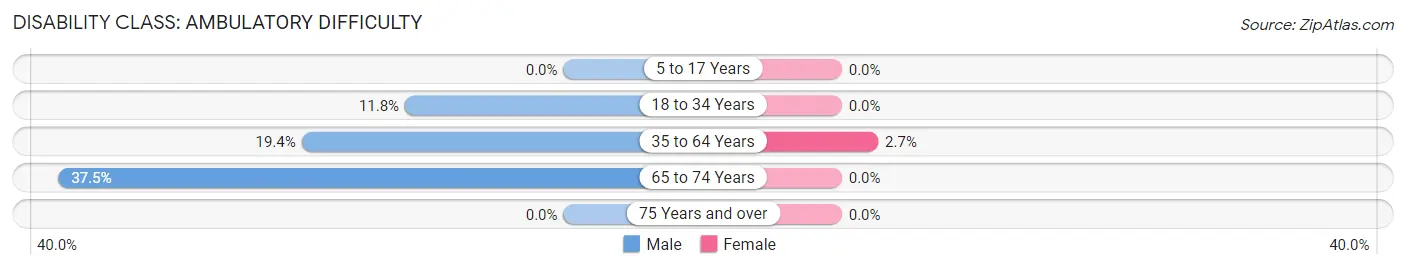
| Age Bracket | Male | Female |
| 5 to 17 Years | 0 (0.0%) | 0 (0.0%) |
| 18 to 34 Years | 4 (11.8%) | 0 (0.0%) |
| 35 to 64 Years | 7 (19.4%) | 1 (2.7%) |
| 65 to 74 Years | 6 (37.5%) | 0 (0.0%) |
| 75 Years and over | 0 (0.0%) | 0 (0.0%) |
Disability Class: Self-Care Difficulty
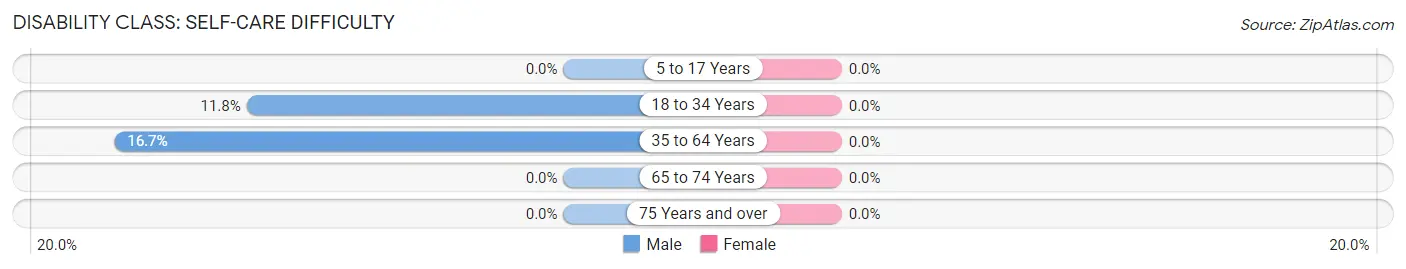
| Age Bracket | Male | Female |
| 5 to 17 Years | 0 (0.0%) | 0 (0.0%) |
| 18 to 34 Years | 4 (11.8%) | 0 (0.0%) |
| 35 to 64 Years | 6 (16.7%) | 0 (0.0%) |
| 65 to 74 Years | 0 (0.0%) | 0 (0.0%) |
| 75 Years and over | 0 (0.0%) | 0 (0.0%) |
Technology Access in Frannie
Computing Device Access in Frannie
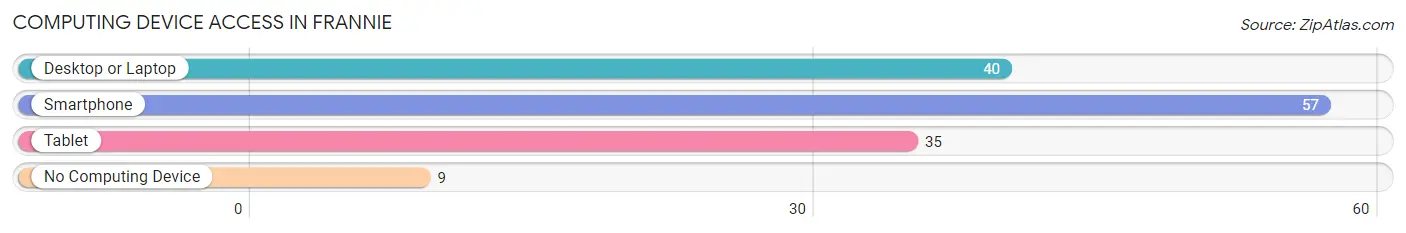
| Device Type | # Households | % Households |
| Desktop or Laptop | 40 | 53.3% |
| Smartphone | 57 | 76.0% |
| Tablet | 35 | 46.7% |
| No Computing Device | 9 | 12.0% |
| Total | 75 | 100.0% |
Internet Access in Frannie
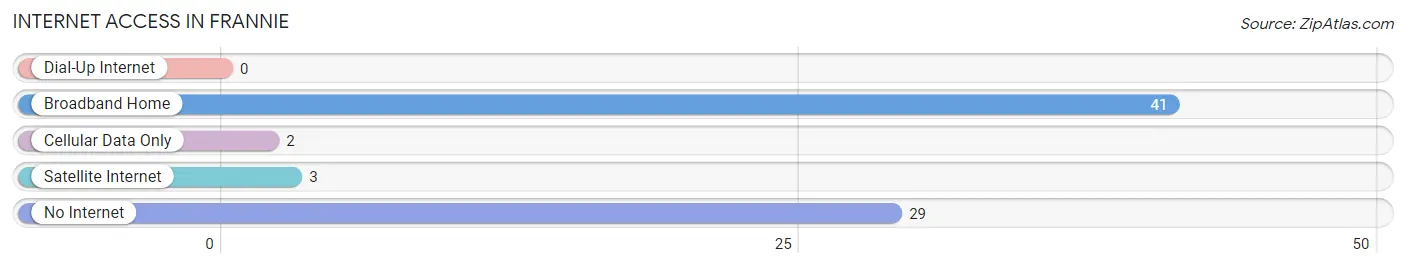
| Internet Type | # Households | % Households |
| Dial-Up Internet | 0 | 0.0% |
| Broadband Home | 41 | 54.7% |
| Cellular Data Only | 2 | 2.7% |
| Satellite Internet | 3 | 4.0% |
| No Internet | 29 | 38.7% |
| Total | 75 | 100.0% |
Frannie Summary
Frannie, Wyoming is a small town located in the northern part of the state, in the Big Horn Basin. It is situated at the intersection of US Highway 20 and Wyoming Highway 120, and is the county seat of Park County. The town was founded in 1887 and has a population of approximately 500 people.
Geography
Frannie is located in the northern part of Wyoming, in the Big Horn Basin. The town is situated at the intersection of US Highway 20 and Wyoming Highway 120. The town is surrounded by rolling hills and grasslands, and is located at an elevation of 4,890 feet. The climate in Frannie is semi-arid, with hot summers and cold winters. The average annual precipitation is 11.5 inches, and the average annual snowfall is 28.5 inches.
Economy
The economy of Frannie is largely based on agriculture and ranching. The town is home to several large ranches, and the surrounding area is used for grazing cattle and sheep. The town also has a small manufacturing sector, with several small businesses producing a variety of products. The town is also home to a number of small retail stores, restaurants, and other services.
Demographics
As of the 2010 census, the population of Frannie was 498 people. The racial makeup of the town was 97.2% White, 0.2% African American, 0.4% Native American, 0.2% Asian, 0.2% Pacific Islander, 0.4% from other races, and 1.6% from two or more races. Hispanic or Latino of any race were 1.2% of the population.
The median income for a household in Frannie was $37,500, and the median income for a family was $41,250. The per capita income for the town was $17,845. About 11.2% of families and 13.2% of the population were below the poverty line, including 16.7% of those under age 18 and 8.3% of those age 65 or over.
History
Frannie was founded in 1887, when the Union Pacific Railroad built a line through the area. The town was named after the daughter of a railroad official, and was incorporated in 1889. The town quickly grew, and by the early 1900s it had become a major shipping center for the surrounding area.
In the early 1900s, the town was home to several large ranches, and the surrounding area was used for grazing cattle and sheep. The town also had a number of small businesses, including a hotel, a bank, and a newspaper.
In the 1950s, the town began to decline, as the railroad line was abandoned and the local economy shifted away from agriculture. The town has since seen a resurgence, and today it is home to several small businesses, including a restaurant, a grocery store, and a gas station.
Common Questions
What is Per Capita Income in Frannie?
Per Capita income in Frannie is $31,986.
What is the Median Household income in Frannie?
Median Household Income in Frannie is $52,344.
What is Inequality or Gini Index in Frannie?
Inequality or Gini Index in Frannie is 0.54.
What is the Total Population of Frannie?
Total Population of Frannie is 213.
What is the Total Male Population of Frannie?
Total Male Population of Frannie is 113.
What is the Total Female Population of Frannie?
Total Female Population of Frannie is 100.
What is the Ratio of Males per 100 Females in Frannie?
There are 113.00 Males per 100 Females in Frannie.
What is the Ratio of Females per 100 Males in Frannie?
There are 88.50 Females per 100 Males in Frannie.
What is the Median Population Age in Frannie?
Median Population Age in Frannie is 38.0 Years.
What is the Average Family Size in Frannie
Average Family Size in Frannie is 2.7 People.
What is the Average Household Size in Frannie
Average Household Size in Frannie is 2.8 People.
How Large is the Labor Force in Frannie?
There are 83 People in the Labor Forcein in Frannie.
What is the Percentage of People in the Labor Force in Frannie?
50.3% of People are in the Labor Force in Frannie.
What is the Unemployment Rate in Frannie?
Unemployment Rate in Frannie is 6.0%.