East Thermopolis, WY Map & Demographics
East Thermopolis Map
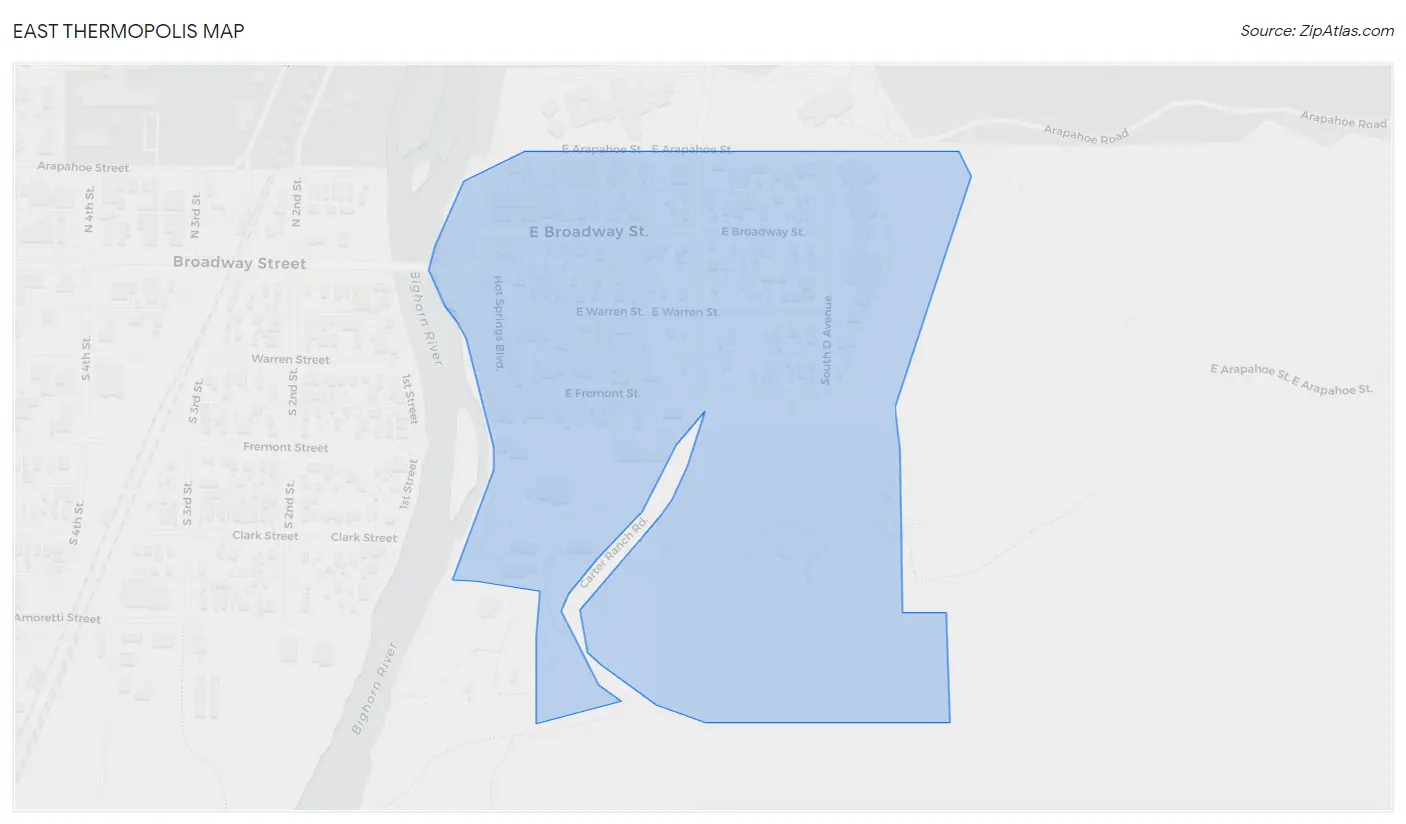
East Thermopolis Overview
$27,249
PER CAPITA INCOME
$66,250
AVG FAMILY INCOME
$25,625
AVG HOUSEHOLD INCOME
0.50
INEQUALITY / GINI INDEX
198
TOTAL POPULATION
93
MALE POPULATION
105
FEMALE POPULATION
88.57
MALES / 100 FEMALES
112.90
FEMALES / 100 MALES
58.3
MEDIAN AGE
2.9
AVG FAMILY SIZE
1.6
AVG HOUSEHOLD SIZE
75
LABOR FORCE [ PEOPLE ]
41.4%
PERCENT IN LABOR FORCE
Income in East Thermopolis
Income Overview in East Thermopolis
Per Capita Income in East Thermopolis is $27,249, while median incomes of families and households are $66,250 and $25,625 respectively.
| Characteristic | Number | Measure |
| Per Capita Income | 198 | $27,249 |
| Median Family Income | 34 | $66,250 |
| Mean Family Income | 34 | $71,618 |
| Median Household Income | 123 | $25,625 |
| Mean Household Income | 123 | $39,115 |
| Income Deficit | 34 | $0 |
| Wage / Income Gap (%) | 198 | 0.00% |
| Wage / Income Gap ($) | 198 | 100.00¢ per $1 |
| Gini / Inequality Index | 198 | 0.50 |
Earnings by Sex in East Thermopolis
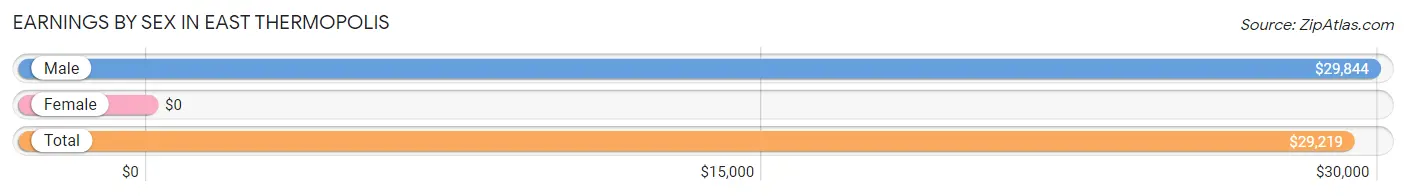
| Sex | Number | Average Earnings |
| Male | 31 (35.6%) | $29,844 |
| Female | 56 (64.4%) | $0 |
| Total | 87 (100.0%) | $29,219 |
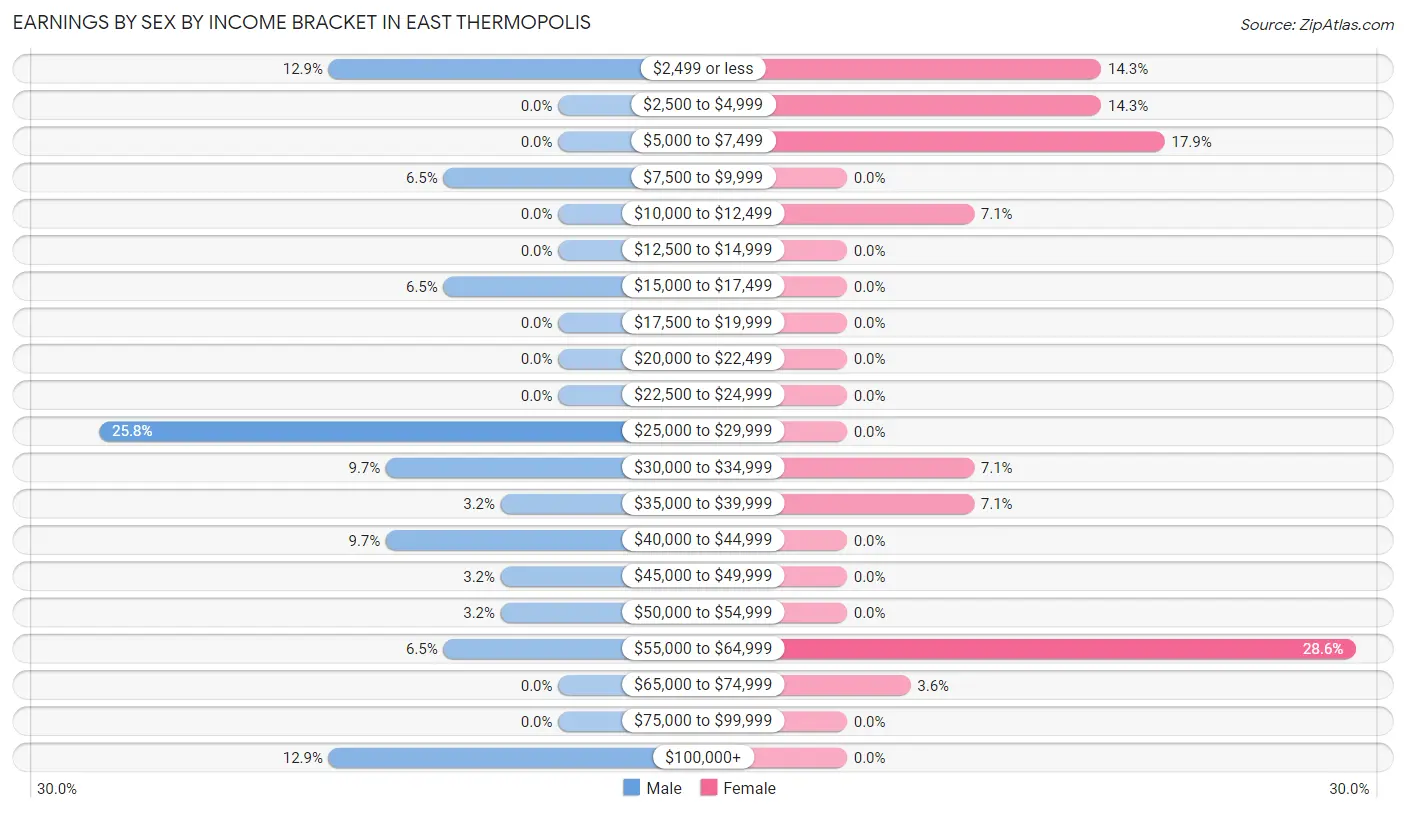
Earnings by Sex by Income Bracket in East Thermopolis
The most common earnings brackets in East Thermopolis are $25,000 to $29,999 for men (8 | 25.8%) and $55,000 to $64,999 for women (16 | 28.6%).
| Income | Male | Female |
| $2,499 or less | 4 (12.9%) | 8 (14.3%) |
| $2,500 to $4,999 | 0 (0.0%) | 8 (14.3%) |
| $5,000 to $7,499 | 0 (0.0%) | 10 (17.9%) |
| $7,500 to $9,999 | 2 (6.5%) | 0 (0.0%) |
| $10,000 to $12,499 | 0 (0.0%) | 4 (7.1%) |
| $12,500 to $14,999 | 0 (0.0%) | 0 (0.0%) |
| $15,000 to $17,499 | 2 (6.5%) | 0 (0.0%) |
| $17,500 to $19,999 | 0 (0.0%) | 0 (0.0%) |
| $20,000 to $22,499 | 0 (0.0%) | 0 (0.0%) |
| $22,500 to $24,999 | 0 (0.0%) | 0 (0.0%) |
| $25,000 to $29,999 | 8 (25.8%) | 0 (0.0%) |
| $30,000 to $34,999 | 3 (9.7%) | 4 (7.1%) |
| $35,000 to $39,999 | 1 (3.2%) | 4 (7.1%) |
| $40,000 to $44,999 | 3 (9.7%) | 0 (0.0%) |
| $45,000 to $49,999 | 1 (3.2%) | 0 (0.0%) |
| $50,000 to $54,999 | 1 (3.2%) | 0 (0.0%) |
| $55,000 to $64,999 | 2 (6.5%) | 16 (28.6%) |
| $65,000 to $74,999 | 0 (0.0%) | 2 (3.6%) |
| $75,000 to $99,999 | 0 (0.0%) | 0 (0.0%) |
| $100,000+ | 4 (12.9%) | 0 (0.0%) |
| Total | 31 (100.0%) | 56 (100.0%) |
Earnings by Sex by Educational Attainment in East Thermopolis
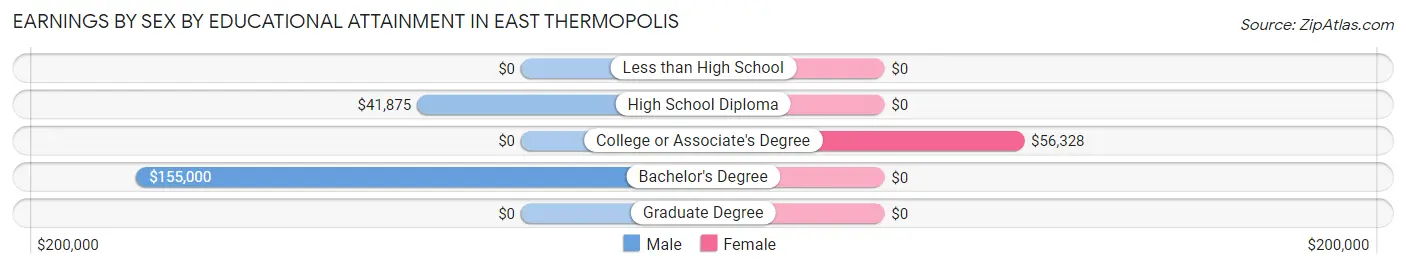
| Educational Attainment | Male Income | Female Income |
| Less than High School | - | - |
| High School Diploma | $41,875 | $0 |
| College or Associate's Degree | - | - |
| Bachelor's Degree | $155,000 | $0 |
| Graduate Degree | - | - |
| Total | $31,250 | $0 |
Family Income in East Thermopolis
Family Income Brackets in East Thermopolis
According to the East Thermopolis family income data, there are 11 families falling into the $75,000 to $99,999 income range, which is the most common income bracket and makes up 32.4% of all families.
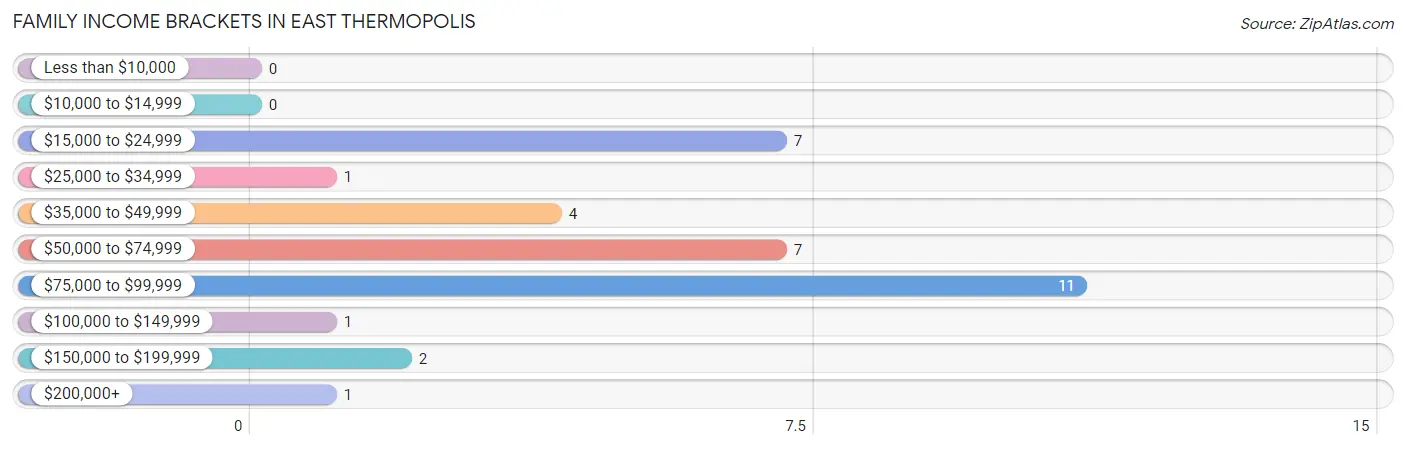
| Income Bracket | # Families | % Families |
| Less than $10,000 | 0 | 0.0% |
| $10,000 to $14,999 | 0 | 0.0% |
| $15,000 to $24,999 | 7 | 20.6% |
| $25,000 to $34,999 | 1 | 2.9% |
| $35,000 to $49,999 | 4 | 11.8% |
| $50,000 to $74,999 | 7 | 20.6% |
| $75,000 to $99,999 | 11 | 32.4% |
| $100,000 to $149,999 | 1 | 2.9% |
| $150,000 to $199,999 | 2 | 5.9% |
| $200,000+ | 1 | 2.9% |
Family Income by Famaliy Size in East Thermopolis
2-person families (29 | 85.3%) account for the highest median family income in East Thermopolis with $70,625 per family, while 2-person families (29 | 85.3%) have the highest median income of $35,312 per family member.
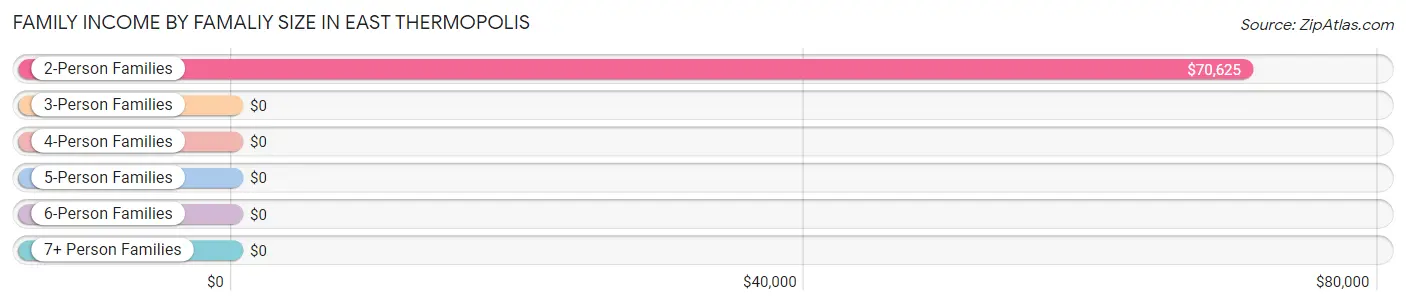
| Income Bracket | # Families | Median Income |
| 2-Person Families | 29 (85.3%) | $70,625 |
| 3-Person Families | 2 (5.9%) | $0 |
| 4-Person Families | 0 (0.0%) | $0 |
| 5-Person Families | 2 (5.9%) | $0 |
| 6-Person Families | 0 (0.0%) | $0 |
| 7+ Person Families | 1 (2.9%) | $0 |
| Total | 34 (100.0%) | $66,250 |
Family Income by Number of Earners in East Thermopolis
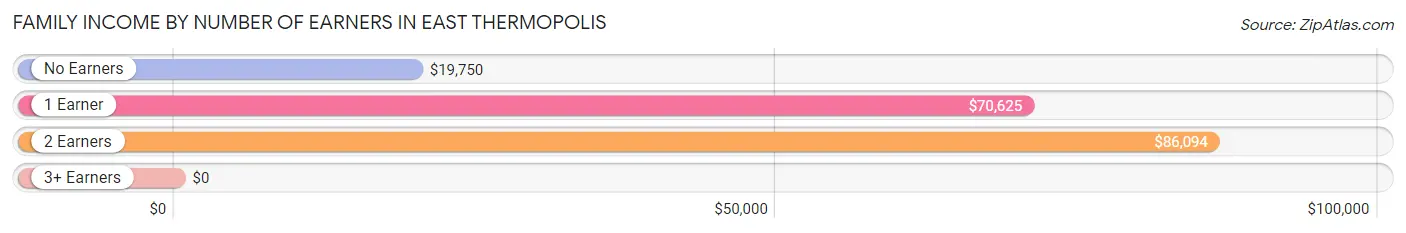
| Number of Earners | # Families | Median Income |
| No Earners | 11 (32.4%) | $19,750 |
| 1 Earner | 7 (20.6%) | $70,625 |
| 2 Earners | 13 (38.2%) | $86,094 |
| 3+ Earners | 3 (8.8%) | $0 |
| Total | 34 (100.0%) | $66,250 |
Household Income in East Thermopolis
Household Income Brackets in East Thermopolis
With 24 households falling in the category, the $15,000 to $24,999 income range is the most frequent in East Thermopolis, accounting for 19.5% of all households. In contrast, only 2 households (1.6%) fall into the $100,000 to $149,999 income bracket, making it the least populous group.
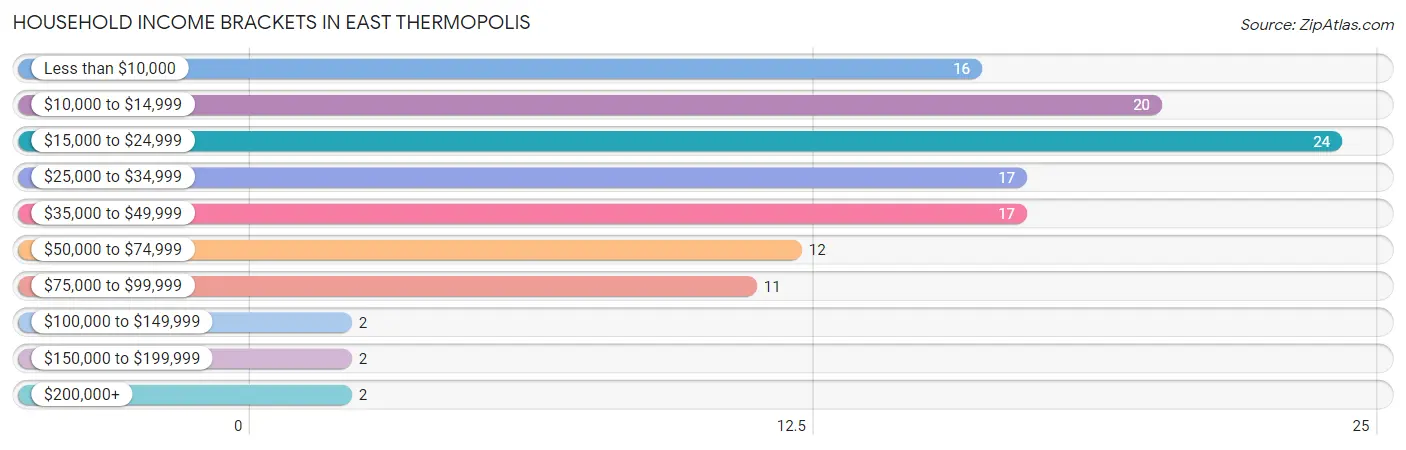
| Income Bracket | # Households | % Households |
| Less than $10,000 | 16 | 13.0% |
| $10,000 to $14,999 | 20 | 16.3% |
| $15,000 to $24,999 | 24 | 19.5% |
| $25,000 to $34,999 | 17 | 13.8% |
| $35,000 to $49,999 | 17 | 13.8% |
| $50,000 to $74,999 | 12 | 9.8% |
| $75,000 to $99,999 | 11 | 8.9% |
| $100,000 to $149,999 | 2 | 1.6% |
| $150,000 to $199,999 | 2 | 1.6% |
| $200,000+ | 2 | 1.6% |
Household Income by Householder Age in East Thermopolis
The median household income in East Thermopolis is $25,625, with the highest median household income of $25,417 found in the 65+ years age bracket for the primary householder. A total of 58 households (47.1%) fall into this category. Meanwhile, the 15 to 24 years age bracket for the primary householder has the lowest median household income of $0, with 7 households (5.7%) in this group.
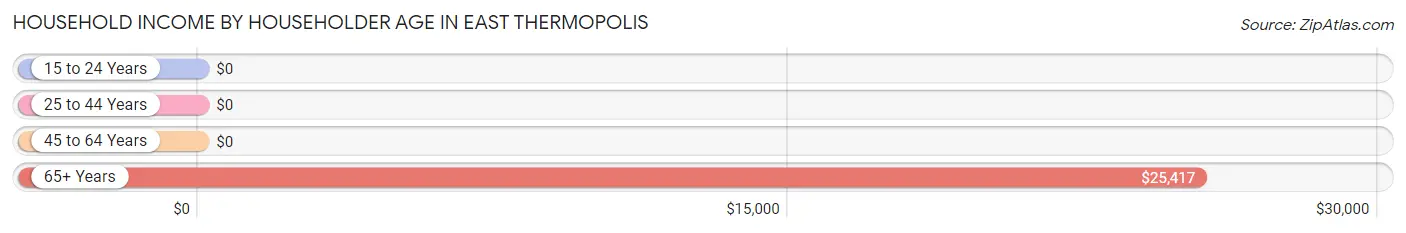
| Income Bracket | # Households | Median Income |
| 15 to 24 Years | 7 (5.7%) | $0 |
| 25 to 44 Years | 8 (6.5%) | $0 |
| 45 to 64 Years | 50 (40.6%) | $0 |
| 65+ Years | 58 (47.1%) | $25,417 |
| Total | 123 (100.0%) | $25,625 |
Poverty in East Thermopolis
Income Below Poverty by Sex and Age in East Thermopolis
With 18.6% poverty level for males and 24.8% for females among the residents of East Thermopolis, 35 to 44 year old males and 18 to 24 year old females are the most vulnerable to poverty, with 2 males (66.7%) and 7 females (87.5%) in their respective age groups living below the poverty level.
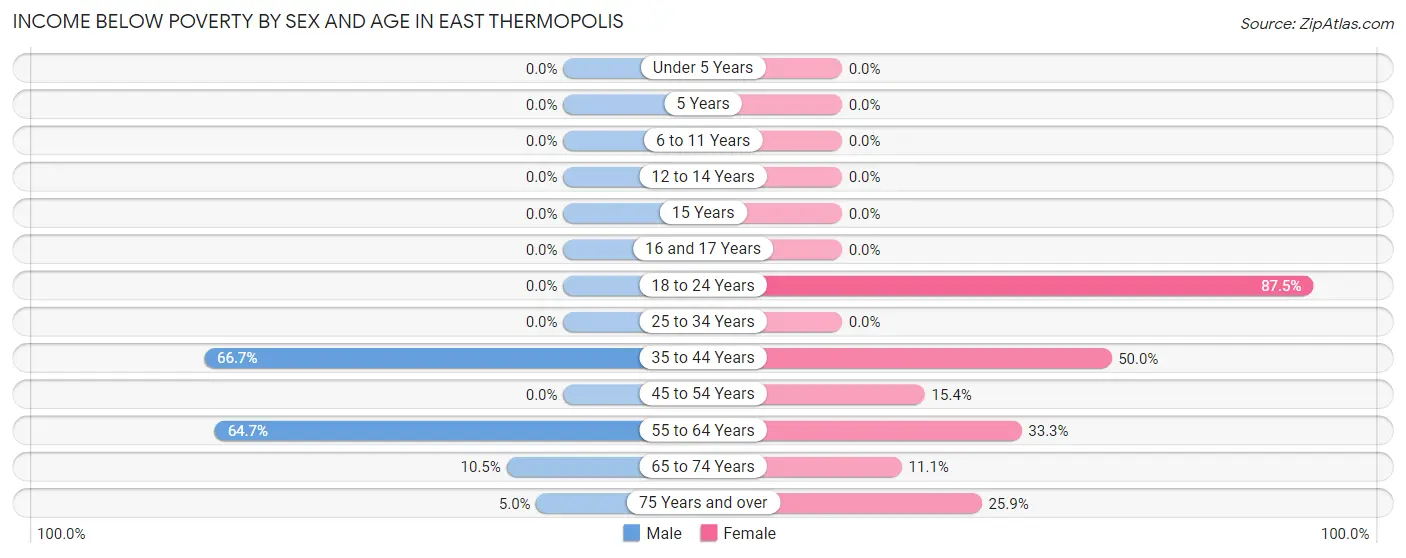
| Age Bracket | Male | Female |
| Under 5 Years | 0 (0.0%) | 0 (0.0%) |
| 5 Years | 0 (0.0%) | 0 (0.0%) |
| 6 to 11 Years | 0 (0.0%) | 0 (0.0%) |
| 12 to 14 Years | 0 (0.0%) | 0 (0.0%) |
| 15 Years | 0 (0.0%) | 0 (0.0%) |
| 16 and 17 Years | 0 (0.0%) | 0 (0.0%) |
| 18 to 24 Years | 0 (0.0%) | 7 (87.5%) |
| 25 to 34 Years | 0 (0.0%) | 0 (0.0%) |
| 35 to 44 Years | 2 (66.7%) | 1 (50.0%) |
| 45 to 54 Years | 0 (0.0%) | 6 (15.4%) |
| 55 to 64 Years | 11 (64.7%) | 4 (33.3%) |
| 65 to 74 Years | 2 (10.5%) | 1 (11.1%) |
| 75 Years and over | 1 (5.0%) | 7 (25.9%) |
| Total | 16 (18.6%) | 26 (24.8%) |
Income Above Poverty by Sex and Age in East Thermopolis
According to the poverty statistics in East Thermopolis, males aged 6 to 11 years and females aged 6 to 11 years are the age groups that are most secure financially, with 100.0% of males and 100.0% of females in these age groups living above the poverty line.
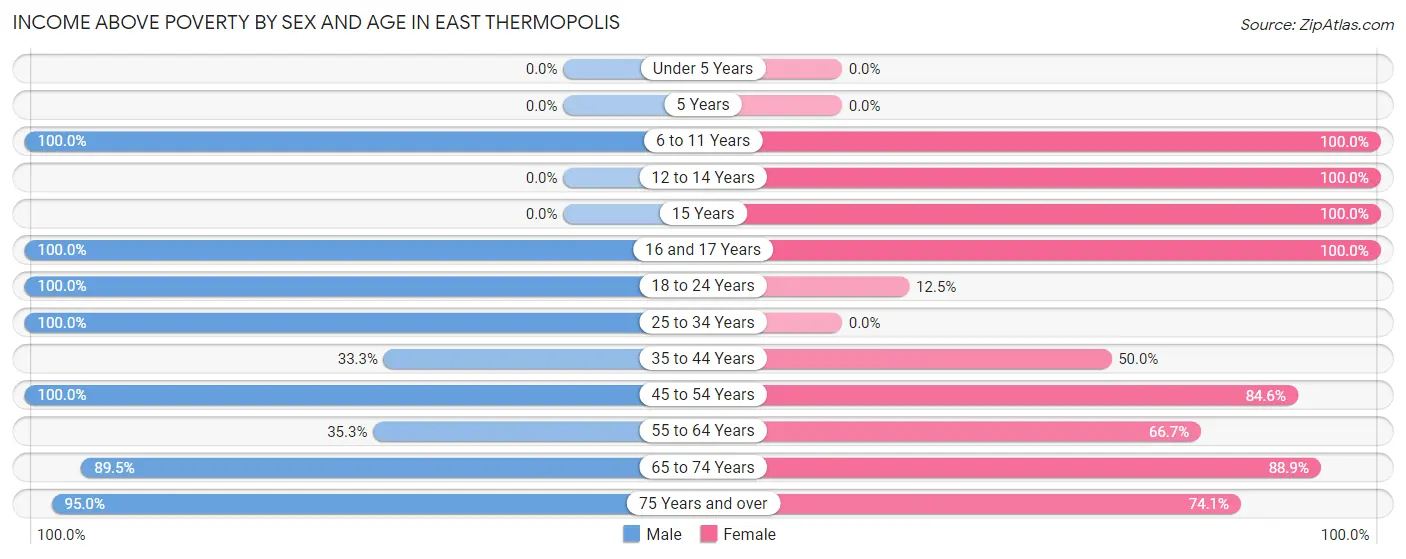
| Age Bracket | Male | Female |
| Under 5 Years | 0 (0.0%) | 0 (0.0%) |
| 5 Years | 0 (0.0%) | 0 (0.0%) |
| 6 to 11 Years | 5 (100.0%) | 1 (100.0%) |
| 12 to 14 Years | 0 (0.0%) | 1 (100.0%) |
| 15 Years | 0 (0.0%) | 3 (100.0%) |
| 16 and 17 Years | 2 (100.0%) | 3 (100.0%) |
| 18 to 24 Years | 3 (100.0%) | 1 (12.5%) |
| 25 to 34 Years | 4 (100.0%) | 0 (0.0%) |
| 35 to 44 Years | 1 (33.3%) | 1 (50.0%) |
| 45 to 54 Years | 13 (100.0%) | 33 (84.6%) |
| 55 to 64 Years | 6 (35.3%) | 8 (66.7%) |
| 65 to 74 Years | 17 (89.5%) | 8 (88.9%) |
| 75 Years and over | 19 (95.0%) | 20 (74.1%) |
| Total | 70 (81.4%) | 79 (75.2%) |
Income Below Poverty Among Married-Couple Families in East Thermopolis
The poverty statistics for married-couple families in East Thermopolis show that 3.2% or 1 of the total 31 families live below the poverty line. Families with no children have the highest poverty rate of 3.8%, comprising of 1 families. On the other hand, families with 1 or 2 children have the lowest poverty rate of 0.0%, which includes 0 families.
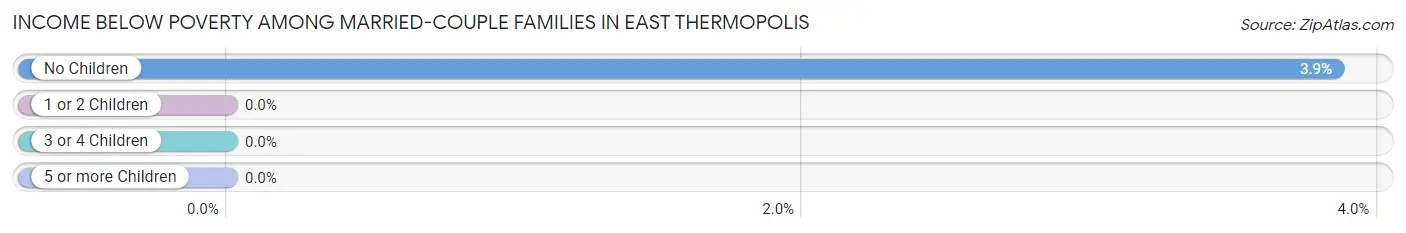
| Children | Above Poverty | Below Poverty |
| No Children | 25 (96.2%) | 1 (3.8%) |
| 1 or 2 Children | 4 (100.0%) | 0 (0.0%) |
| 3 or 4 Children | 1 (100.0%) | 0 (0.0%) |
| 5 or more Children | 0 (0.0%) | 0 (0.0%) |
| Total | 30 (96.8%) | 1 (3.2%) |
Income Below Poverty Among Single-Parent Households in East Thermopolis
| Children | Single Father | Single Mother |
| No Children | 0 (0.0%) | 0 (0.0%) |
| 1 or 2 Children | 0 (0.0%) | 0 (0.0%) |
| 3 or 4 Children | 0 (0.0%) | 0 (0.0%) |
| 5 or more Children | 0 (0.0%) | 0 (0.0%) |
| Total | 0 (0.0%) | 0 (0.0%) |
Income Below Poverty Among Married-Couple vs Single-Parent Households in East Thermopolis
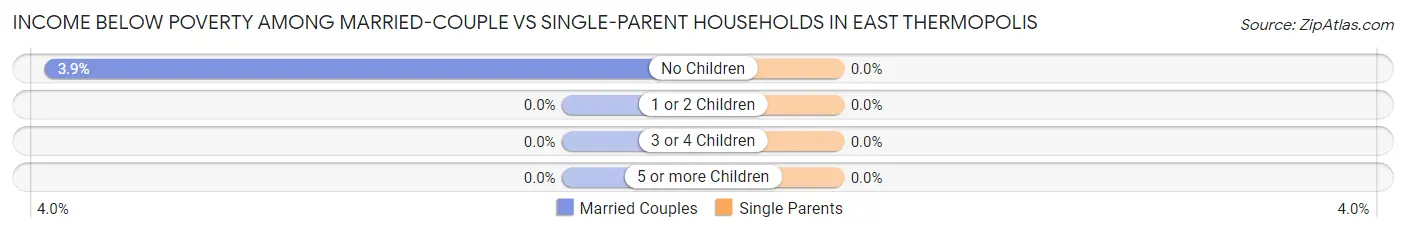
| Children | Married-Couple Families | Single-Parent Households |
| No Children | 1 (3.8%) | 0 (0.0%) |
| 1 or 2 Children | 0 (0.0%) | 0 (0.0%) |
| 3 or 4 Children | 0 (0.0%) | 0 (0.0%) |
| 5 or more Children | 0 (0.0%) | 0 (0.0%) |
| Total | 1 (3.2%) | 0 (0.0%) |
Race in East Thermopolis
The most populous races in East Thermopolis are White / Caucasian (191 | 96.5%), Native / Alaskan (5 | 2.5%), and Hispanic or Latino (2 | 1.0%).
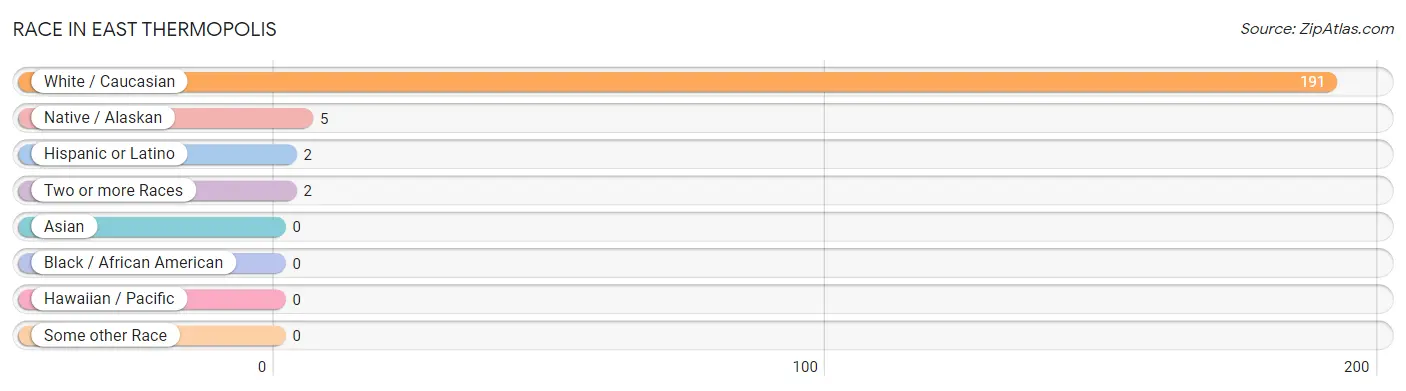
| Race | # Population | % Population |
| Asian | 0 | 0.0% |
| Black / African American | 0 | 0.0% |
| Hawaiian / Pacific | 0 | 0.0% |
| Hispanic or Latino | 2 | 1.0% |
| Native / Alaskan | 5 | 2.5% |
| White / Caucasian | 191 | 96.5% |
| Two or more Races | 2 | 1.0% |
| Some other Race | 0 | 0.0% |
| Total | 198 | 100.0% |
Ancestry in East Thermopolis
The most populous ancestries reported in East Thermopolis are German (60 | 30.3%), Irish (45 | 22.7%), English (28 | 14.1%), Norwegian (27 | 13.6%), and French (10 | 5.1%), together accounting for 85.9% of all East Thermopolis residents.
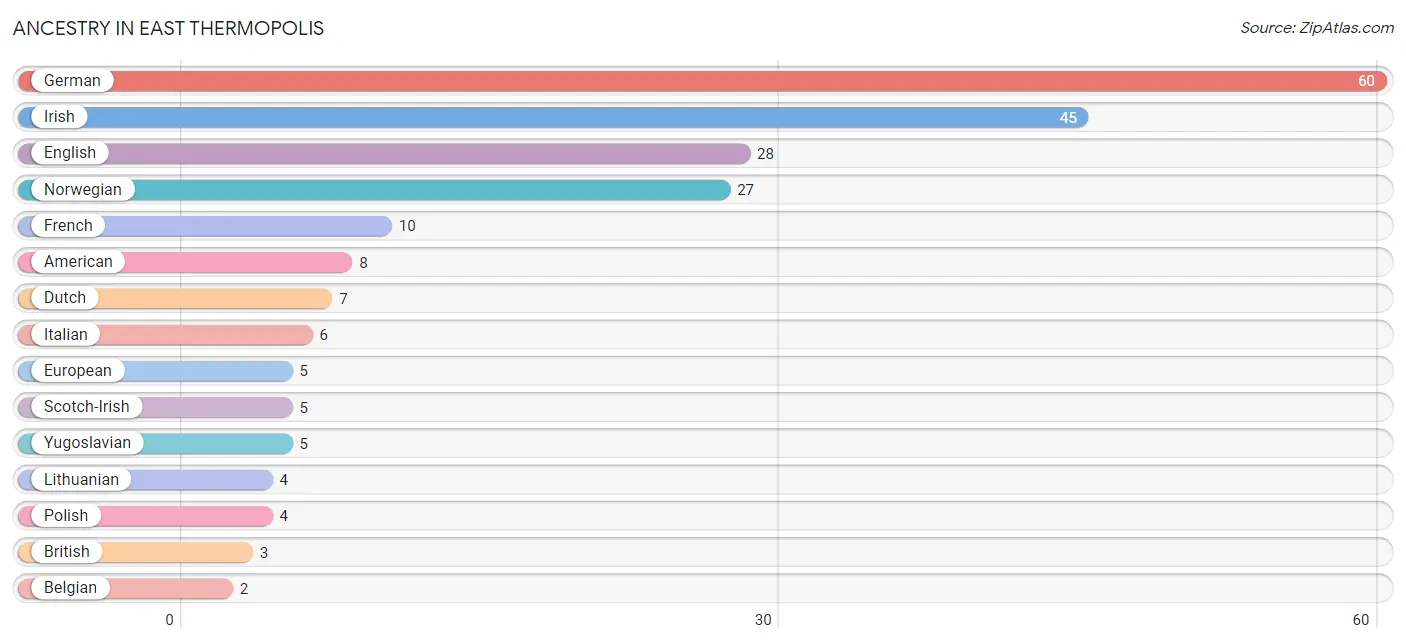
| Ancestry | # Population | % Population |
| Alaska Native | 1 | 0.5% |
| American | 8 | 4.0% |
| Austrian | 1 | 0.5% |
| Belgian | 2 | 1.0% |
| British | 3 | 1.5% |
| Cherokee | 1 | 0.5% |
| Dutch | 7 | 3.5% |
| English | 28 | 14.1% |
| European | 5 | 2.5% |
| French | 10 | 5.1% |
| German | 60 | 30.3% |
| Irish | 45 | 22.7% |
| Italian | 6 | 3.0% |
| Lithuanian | 4 | 2.0% |
| Mexican | 1 | 0.5% |
| Norwegian | 27 | 13.6% |
| Polish | 4 | 2.0% |
| Russian | 1 | 0.5% |
| Scotch-Irish | 5 | 2.5% |
| Scottish | 1 | 0.5% |
| Swedish | 2 | 1.0% |
| Swiss | 1 | 0.5% |
| Welsh | 2 | 1.0% |
| Yugoslavian | 5 | 2.5% | View All 24 Rows |
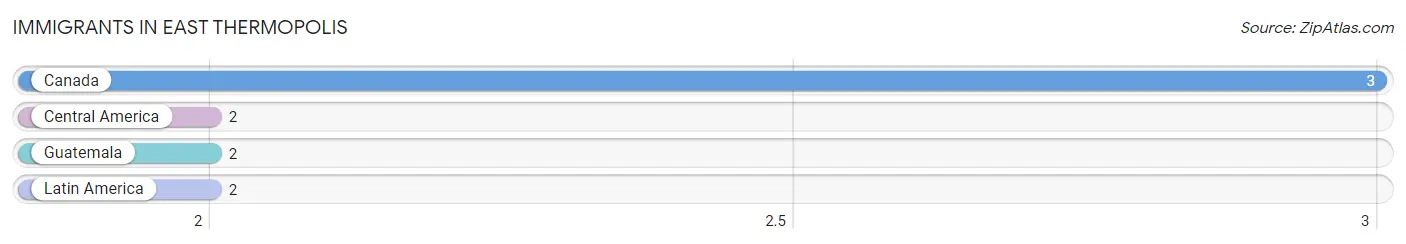
Immigrants in East Thermopolis
The most numerous immigrant groups reported in East Thermopolis came from Canada (3 | 1.5%), Central America (2 | 1.0%), Guatemala (2 | 1.0%), and Latin America (2 | 1.0%), together accounting for 4.5% of all East Thermopolis residents.
| Immigration Origin | # Population | % Population |
| Canada | 3 | 1.5% |
| Central America | 2 | 1.0% |
| Guatemala | 2 | 1.0% |
| Latin America | 2 | 1.0% | View All 4 Rows |
Sex and Age in East Thermopolis
Sex and Age in East Thermopolis
The most populous age groups in East Thermopolis are 65 to 69 Years (14 | 15.0%) for men and 50 to 54 Years (27 | 25.7%) for women.
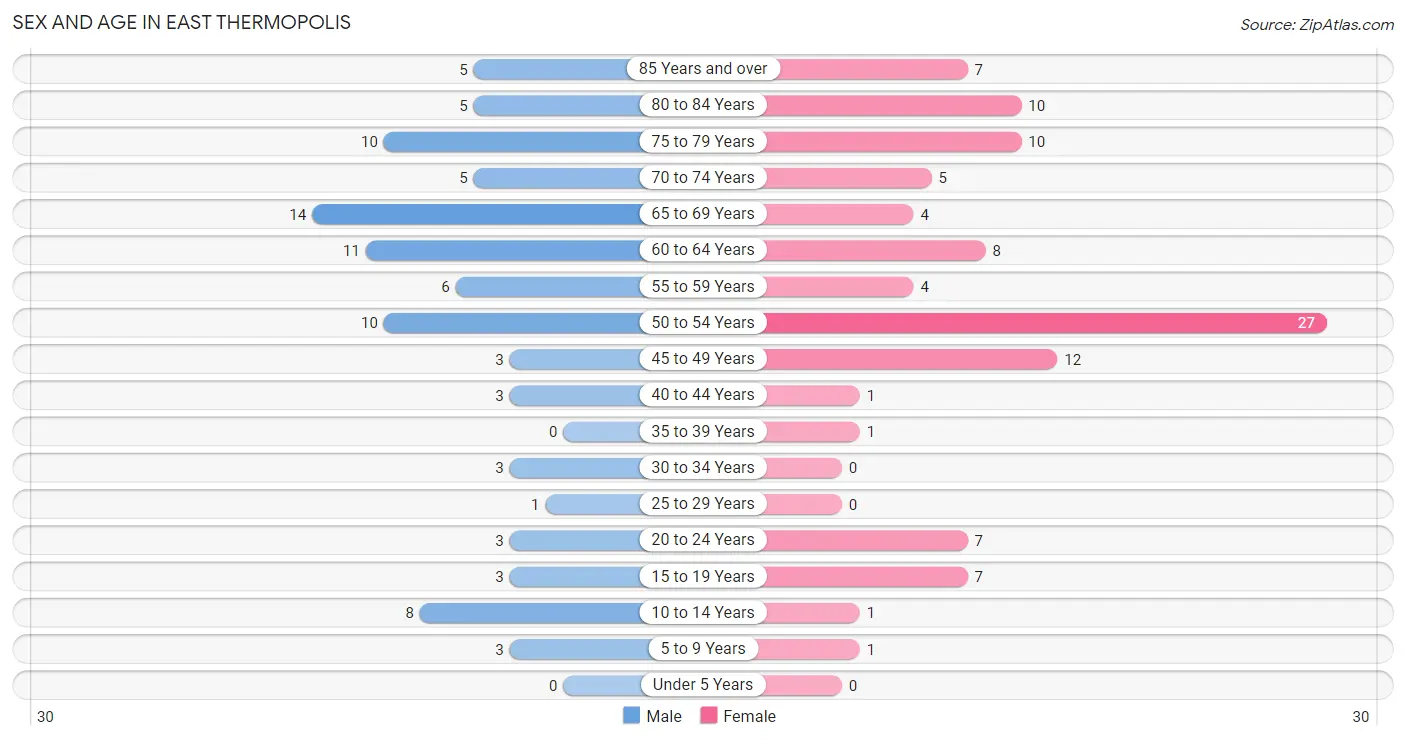
| Age Bracket | Male | Female |
| Under 5 Years | 0 (0.0%) | 0 (0.0%) |
| 5 to 9 Years | 3 (3.2%) | 1 (0.9%) |
| 10 to 14 Years | 8 (8.6%) | 1 (0.9%) |
| 15 to 19 Years | 3 (3.2%) | 7 (6.7%) |
| 20 to 24 Years | 3 (3.2%) | 7 (6.7%) |
| 25 to 29 Years | 1 (1.1%) | 0 (0.0%) |
| 30 to 34 Years | 3 (3.2%) | 0 (0.0%) |
| 35 to 39 Years | 0 (0.0%) | 1 (0.9%) |
| 40 to 44 Years | 3 (3.2%) | 1 (0.9%) |
| 45 to 49 Years | 3 (3.2%) | 12 (11.4%) |
| 50 to 54 Years | 10 (10.7%) | 27 (25.7%) |
| 55 to 59 Years | 6 (6.5%) | 4 (3.8%) |
| 60 to 64 Years | 11 (11.8%) | 8 (7.6%) |
| 65 to 69 Years | 14 (15.0%) | 4 (3.8%) |
| 70 to 74 Years | 5 (5.4%) | 5 (4.8%) |
| 75 to 79 Years | 10 (10.7%) | 10 (9.5%) |
| 80 to 84 Years | 5 (5.4%) | 10 (9.5%) |
| 85 Years and over | 5 (5.4%) | 7 (6.7%) |
| Total | 93 (100.0%) | 105 (100.0%) |
Families and Households in East Thermopolis
Median Family Size in East Thermopolis
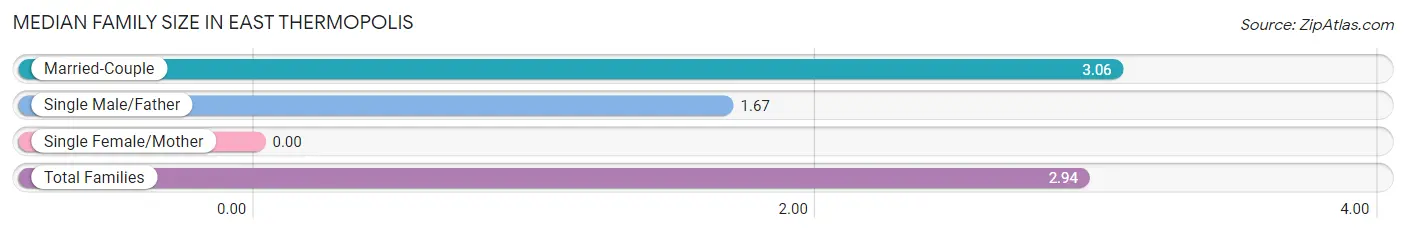
| Family Type | # Families | Family Size |
| Married-Couple | 31 (91.2%) | 3.06 |
| Single Male/Father | 3 (8.8%) | 1.67 |
| Single Female/Mother | 0 (0.0%) | - |
| Total Families | 34 (100.0%) | 2.94 |
Median Household Size in East Thermopolis
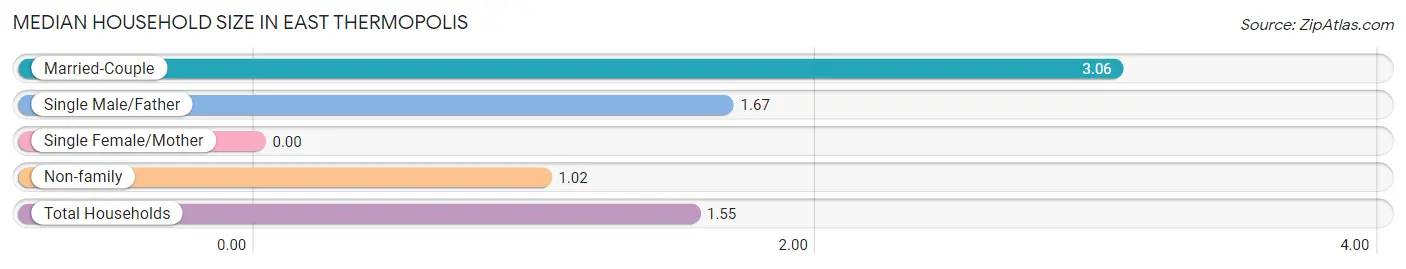
| Household Type | # Households | Household Size |
| Married-Couple | 31 (25.2%) | 3.06 |
| Single Male/Father | 3 (2.4%) | 1.67 |
| Single Female/Mother | 0 (0.0%) | - |
| Non-family | 89 (72.4%) | 1.02 |
| Total Households | 123 (100.0%) | 1.55 |
Household Size by Marriage Status in East Thermopolis
Out of a total of 123 households in East Thermopolis, 34 (27.6%) are family households, while 89 (72.4%) are nonfamily households. The most numerous type of family households are 2-person households, comprising 29, and the most common type of nonfamily households are 1-person households, comprising 85.
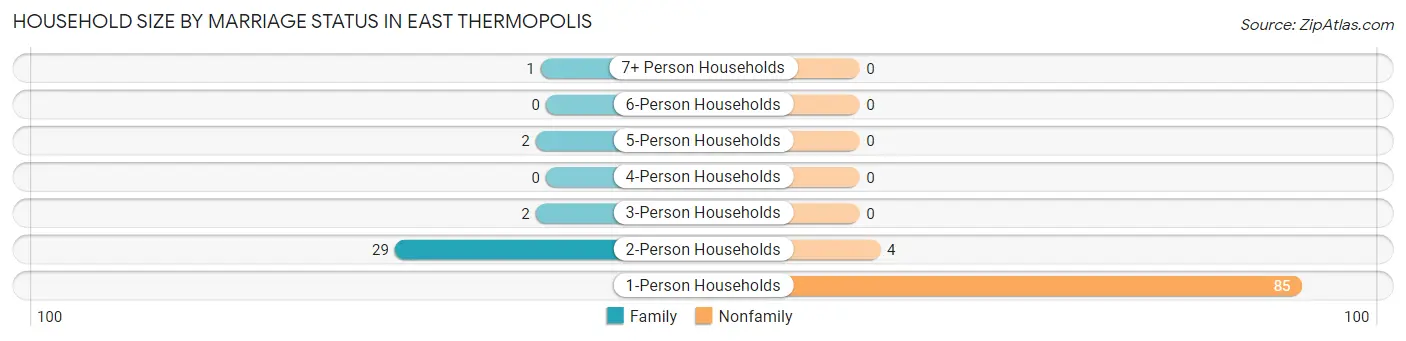
| Household Size | Family Households | Nonfamily Households |
| 1-Person Households | - | 85 (69.1%) |
| 2-Person Households | 29 (23.6%) | 4 (3.3%) |
| 3-Person Households | 2 (1.6%) | 0 (0.0%) |
| 4-Person Households | 0 (0.0%) | 0 (0.0%) |
| 5-Person Households | 2 (1.6%) | 0 (0.0%) |
| 6-Person Households | 0 (0.0%) | 0 (0.0%) |
| 7+ Person Households | 1 (0.8%) | 0 (0.0%) |
| Total | 34 (27.6%) | 89 (72.4%) |
Female Fertility in East Thermopolis
Fertility by Age in East Thermopolis
| Age Bracket | Women with Births | Births / 1,000 Women |
| 15 to 19 years | 0 (0.0%) | 0.0 |
| 20 to 34 years | 0 (0.0%) | 0.0 |
| 35 to 50 years | 0 (0.0%) | 0.0 |
| Total | 0 (0.0%) | 0.0 |
Fertility by Age by Marriage Status in East Thermopolis
| Age Bracket | Married | Unmarried |
| 15 to 19 years | 0 (0.0%) | 0 (0.0%) |
| 20 to 34 years | 0 (0.0%) | 0 (0.0%) |
| 35 to 50 years | 0 (0.0%) | 0 (0.0%) |
| Total | 0 (0.0%) | 0 (0.0%) |
Fertility by Education in East Thermopolis
| Educational Attainment | Women with Births | Births / 1,000 Women |
| Less than High School | 0 (0.0%) | 0.0 |
| High School Diploma | 0 (0.0%) | 0.0 |
| College or Associate's Degree | 0 (0.0%) | 0.0 |
| Bachelor's Degree | 0 (0.0%) | 0.0 |
| Graduate Degree | 0 (0.0%) | 0.0 |
| Total | 0 (0.0%) | 0.0 |
Fertility by Education by Marriage Status in East Thermopolis
| Educational Attainment | Married | Unmarried |
| Less than High School | 0 (0.0%) | 0 (0.0%) |
| High School Diploma | 0 (0.0%) | 0 (0.0%) |
| College or Associate's Degree | 0 (0.0%) | 0 (0.0%) |
| Bachelor's Degree | 0 (0.0%) | 0 (0.0%) |
| Graduate Degree | 0 (0.0%) | 0 (0.0%) |
| Total | 0 (0.0%) | 0 (0.0%) |
Employment Characteristics in East Thermopolis
Employment by Class of Employer in East Thermopolis
Among the 73 employed individuals in East Thermopolis, private company employees (32 | 43.8%), federal government employees (17 | 23.3%), and not-for-profit organizations (16 | 21.9%) make up the most common classes of employment.
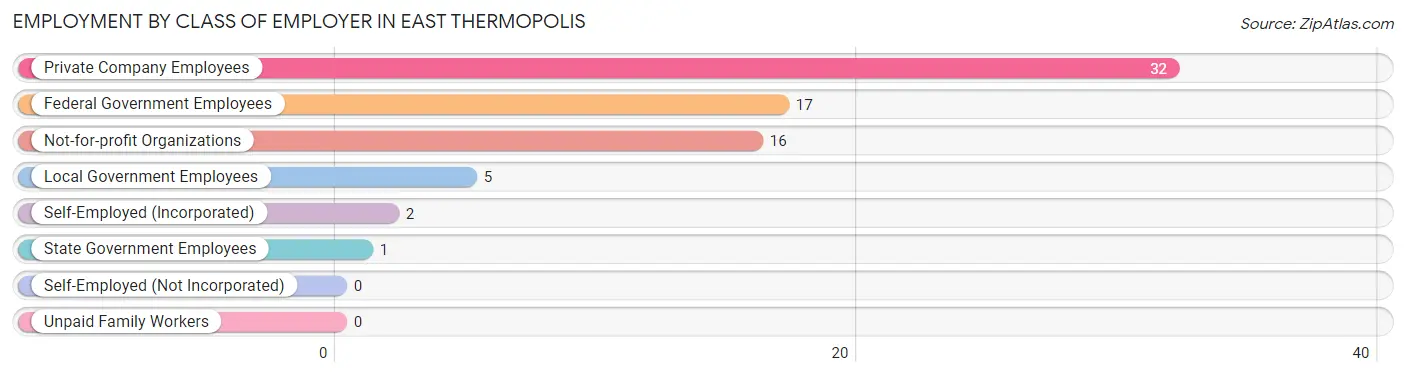
| Employer Class | # Employees | % Employees |
| Private Company Employees | 32 | 43.8% |
| Self-Employed (Incorporated) | 2 | 2.7% |
| Self-Employed (Not Incorporated) | 0 | 0.0% |
| Not-for-profit Organizations | 16 | 21.9% |
| Local Government Employees | 5 | 6.9% |
| State Government Employees | 1 | 1.4% |
| Federal Government Employees | 17 | 23.3% |
| Unpaid Family Workers | 0 | 0.0% |
| Total | 73 | 100.0% |
Employment Status by Age in East Thermopolis
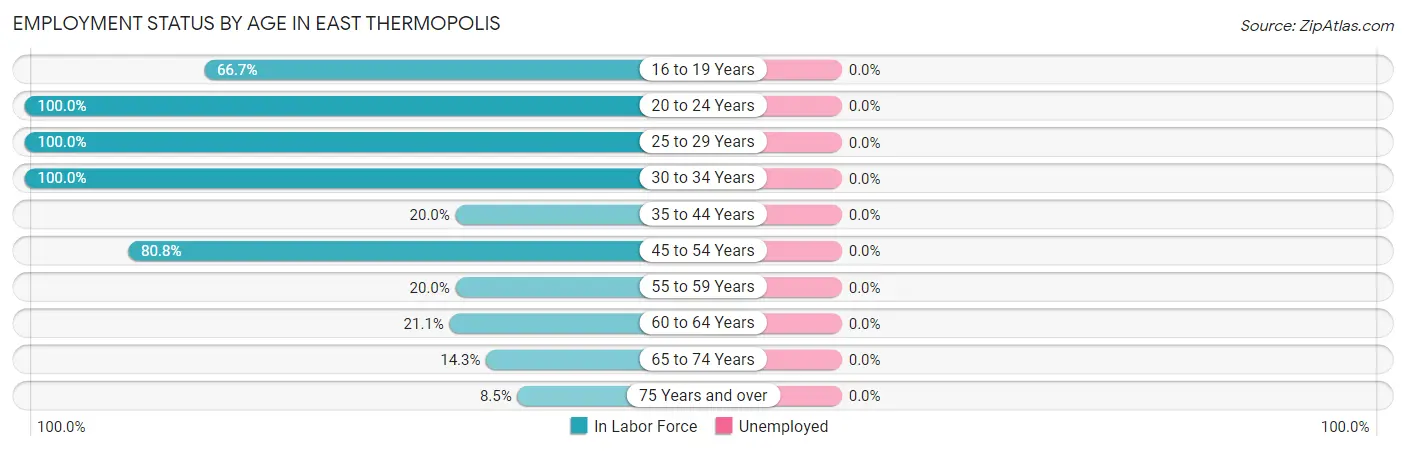
| Age Bracket | In Labor Force | Unemployed |
| 16 to 19 Years | 4 (66.7%) | 0 (0.0%) |
| 20 to 24 Years | 10 (100.0%) | 0 (0.0%) |
| 25 to 29 Years | 1 (100.0%) | 0 (0.0%) |
| 30 to 34 Years | 3 (100.0%) | 0 (0.0%) |
| 35 to 44 Years | 1 (20.0%) | 0 (0.0%) |
| 45 to 54 Years | 42 (80.8%) | 0 (0.0%) |
| 55 to 59 Years | 2 (20.0%) | 0 (0.0%) |
| 60 to 64 Years | 4 (21.1%) | 0 (0.0%) |
| 65 to 74 Years | 4 (14.3%) | 0 (0.0%) |
| 75 Years and over | 4 (8.5%) | 0 (0.0%) |
| Total | 75 (41.4%) | 0 (0.0%) |
Employment Status by Educational Attainment in East Thermopolis
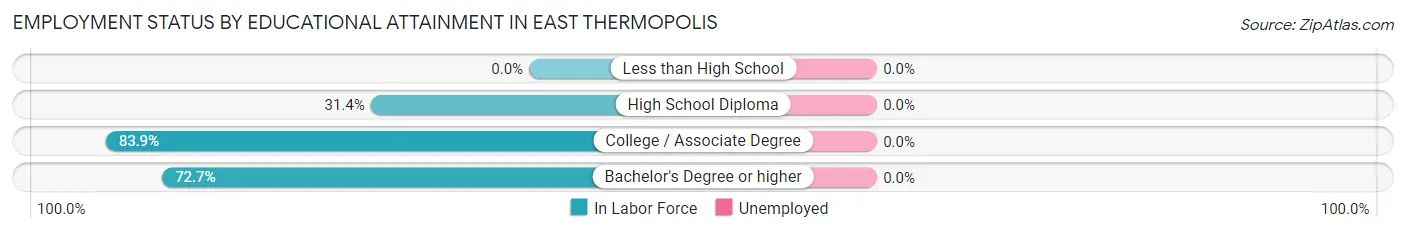
| Educational Attainment | In Labor Force | Unemployed |
| Less than High School | 0 (0.0%) | 0 (0.0%) |
| High School Diploma | 11 (31.4%) | 0 (0.0%) |
| College / Associate Degree | 26 (83.9%) | 0 (0.0%) |
| Bachelor's Degree or higher | 16 (72.7%) | 0 (0.0%) |
| Total | 53 (58.9%) | 0 (0.0%) |
Employment Occupations by Sex in East Thermopolis
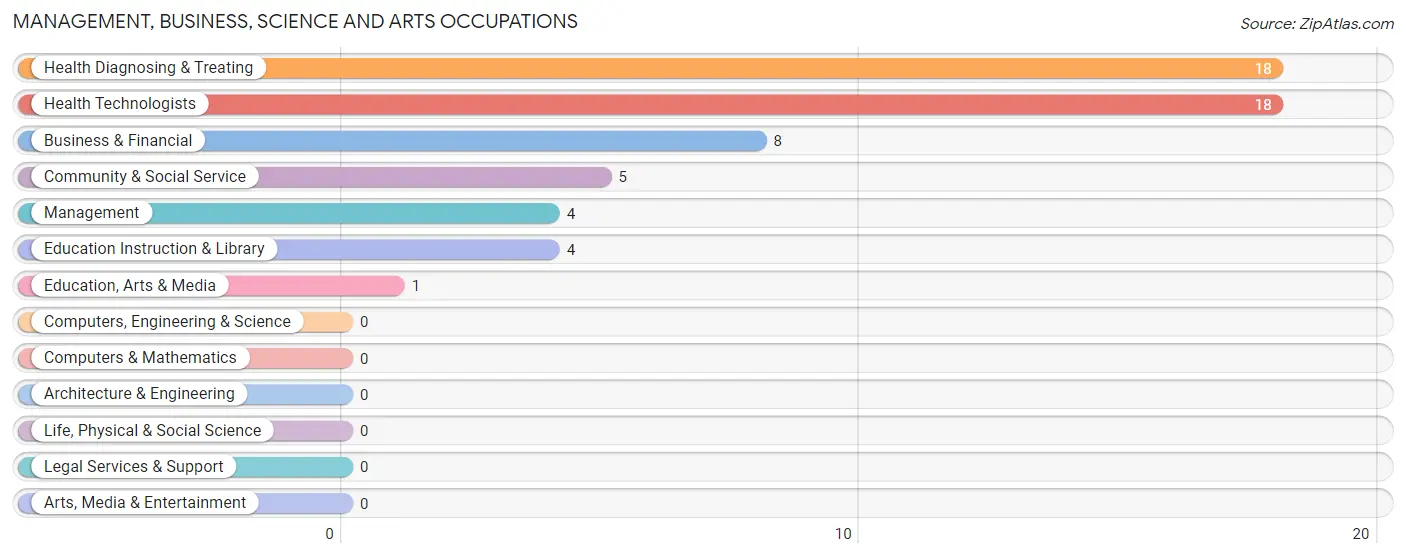
Management, Business, Science and Arts Occupations
The most common Management, Business, Science and Arts occupations in East Thermopolis are Health Diagnosing & Treating (18 | 24.0%), Health Technologists (18 | 24.0%), Business & Financial (8 | 10.7%), Community & Social Service (5 | 6.7%), and Management (4 | 5.3%).
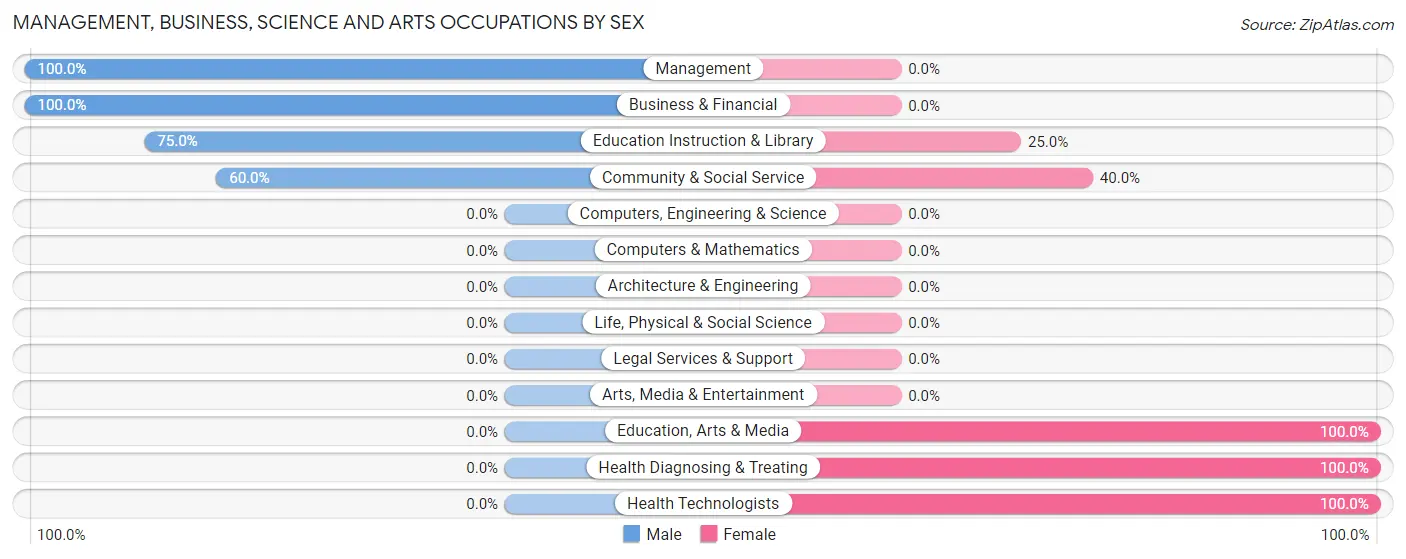
Management, Business, Science and Arts Occupations by Sex
Within the Management, Business, Science and Arts occupations in East Thermopolis, the most male-oriented occupations are Management (100.0%), Business & Financial (100.0%), and Education Instruction & Library (75.0%), while the most female-oriented occupations are Education, Arts & Media (100.0%), Health Diagnosing & Treating (100.0%), and Health Technologists (100.0%).
| Occupation | Male | Female |
| Management | 4 (100.0%) | 0 (0.0%) |
| Business & Financial | 8 (100.0%) | 0 (0.0%) |
| Computers, Engineering & Science | 0 (0.0%) | 0 (0.0%) |
| Computers & Mathematics | 0 (0.0%) | 0 (0.0%) |
| Architecture & Engineering | 0 (0.0%) | 0 (0.0%) |
| Life, Physical & Social Science | 0 (0.0%) | 0 (0.0%) |
| Community & Social Service | 3 (60.0%) | 2 (40.0%) |
| Education, Arts & Media | 0 (0.0%) | 1 (100.0%) |
| Legal Services & Support | 0 (0.0%) | 0 (0.0%) |
| Education Instruction & Library | 3 (75.0%) | 1 (25.0%) |
| Arts, Media & Entertainment | 0 (0.0%) | 0 (0.0%) |
| Health Diagnosing & Treating | 0 (0.0%) | 18 (100.0%) |
| Health Technologists | 0 (0.0%) | 18 (100.0%) |
| Total (Category) | 15 (42.9%) | 20 (57.1%) |
| Total (Overall) | 31 (41.3%) | 44 (58.7%) |
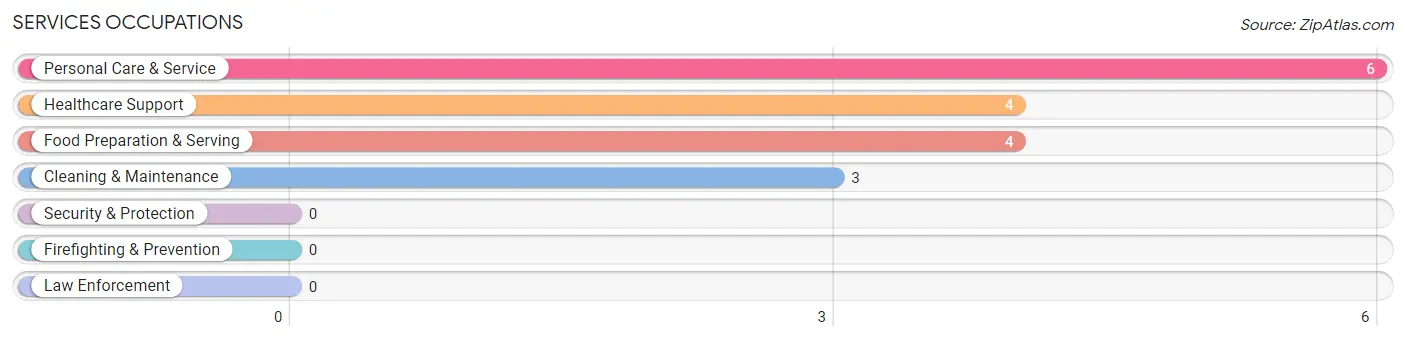
Services Occupations
The most common Services occupations in East Thermopolis are Personal Care & Service (6 | 8.0%), Healthcare Support (4 | 5.3%), Food Preparation & Serving (4 | 5.3%), and Cleaning & Maintenance (3 | 4.0%).
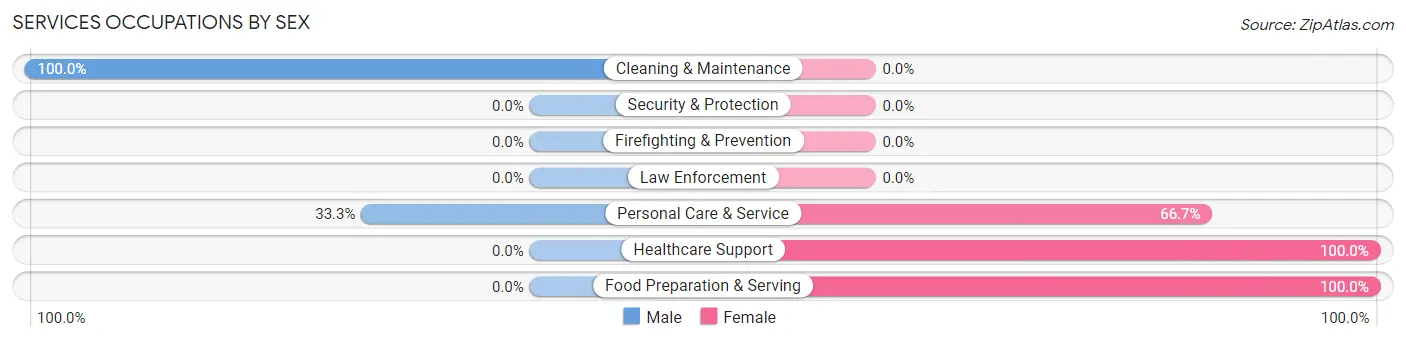
Services Occupations by Sex
Within the Services occupations in East Thermopolis, the most male-oriented occupations are Cleaning & Maintenance (100.0%), and Personal Care & Service (33.3%), while the most female-oriented occupations are Healthcare Support (100.0%), Food Preparation & Serving (100.0%), and Personal Care & Service (66.7%).
| Occupation | Male | Female |
| Healthcare Support | 0 (0.0%) | 4 (100.0%) |
| Security & Protection | 0 (0.0%) | 0 (0.0%) |
| Firefighting & Prevention | 0 (0.0%) | 0 (0.0%) |
| Law Enforcement | 0 (0.0%) | 0 (0.0%) |
| Food Preparation & Serving | 0 (0.0%) | 4 (100.0%) |
| Cleaning & Maintenance | 3 (100.0%) | 0 (0.0%) |
| Personal Care & Service | 2 (33.3%) | 4 (66.7%) |
| Total (Category) | 5 (29.4%) | 12 (70.6%) |
| Total (Overall) | 31 (41.3%) | 44 (58.7%) |
Sales and Office Occupations
The most common Sales and Office occupations in East Thermopolis are Office & Administration (12 | 16.0%), and Sales & Related (2 | 2.7%).
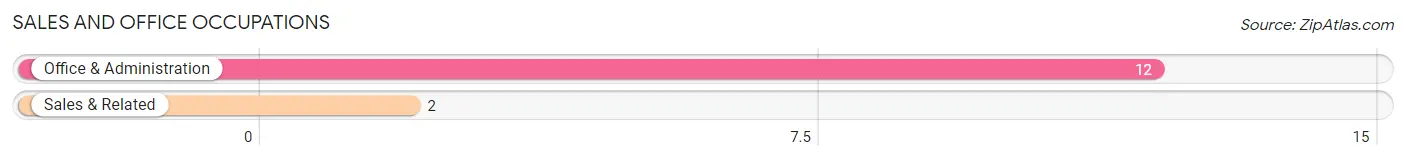
Sales and Office Occupations by Sex
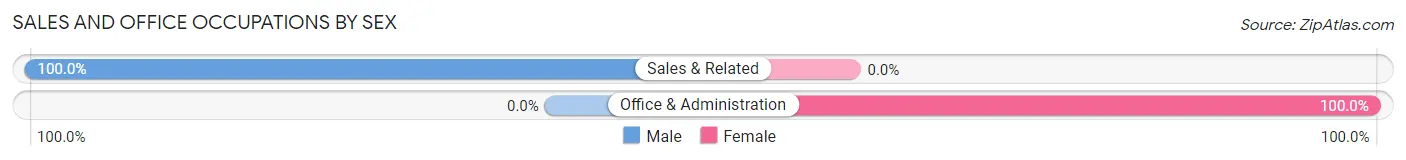
| Occupation | Male | Female |
| Sales & Related | 2 (100.0%) | 0 (0.0%) |
| Office & Administration | 0 (0.0%) | 12 (100.0%) |
| Total (Category) | 2 (14.3%) | 12 (85.7%) |
| Total (Overall) | 31 (41.3%) | 44 (58.7%) |
Natural Resources, Construction and Maintenance Occupations
The most common Natural Resources, Construction and Maintenance occupations in East Thermopolis are Construction & Extraction (2 | 2.7%), and Installation, Maintenance & Repair (2 | 2.7%).
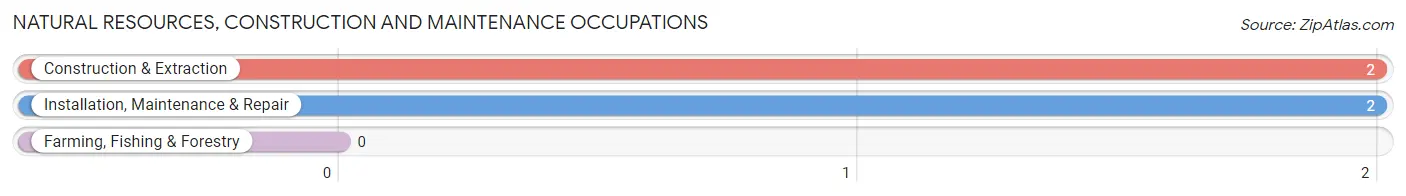
Natural Resources, Construction and Maintenance Occupations by Sex
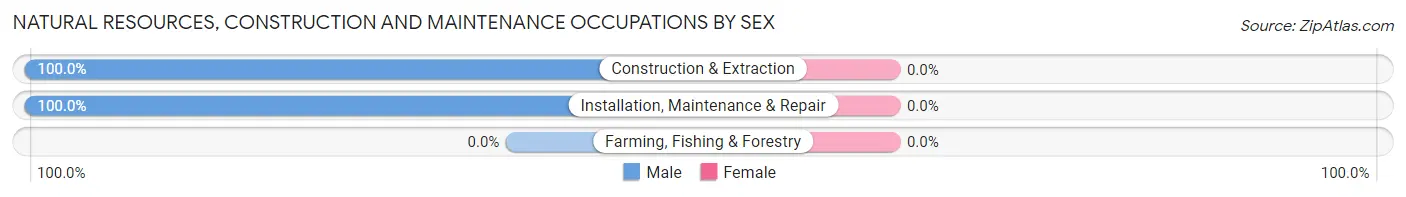
| Occupation | Male | Female |
| Farming, Fishing & Forestry | 0 (0.0%) | 0 (0.0%) |
| Construction & Extraction | 2 (100.0%) | 0 (0.0%) |
| Installation, Maintenance & Repair | 2 (100.0%) | 0 (0.0%) |
| Total (Category) | 4 (100.0%) | 0 (0.0%) |
| Total (Overall) | 31 (41.3%) | 44 (58.7%) |
Production, Transportation and Moving Occupations
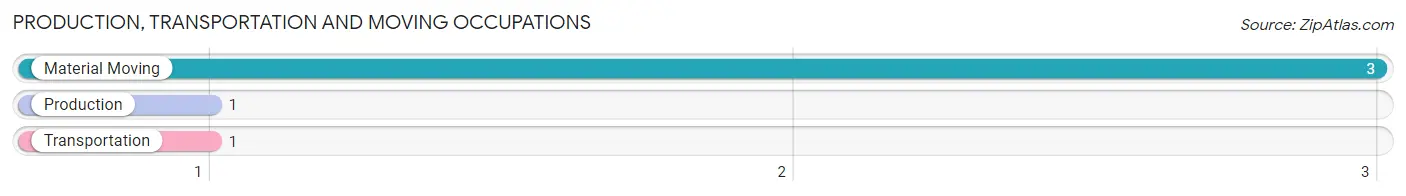
The most common Production, Transportation and Moving occupations in East Thermopolis are Material Moving (3 | 4.0%), Production (1 | 1.3%), and Transportation (1 | 1.3%).
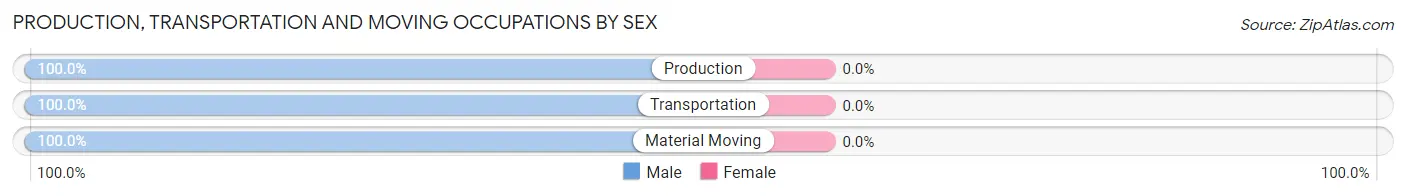
Production, Transportation and Moving Occupations by Sex
| Occupation | Male | Female |
| Production | 1 (100.0%) | 0 (0.0%) |
| Transportation | 1 (100.0%) | 0 (0.0%) |
| Material Moving | 3 (100.0%) | 0 (0.0%) |
| Total (Category) | 5 (100.0%) | 0 (0.0%) |
| Total (Overall) | 31 (41.3%) | 44 (58.7%) |
Employment Industries by Sex in East Thermopolis
Employment Industries in East Thermopolis
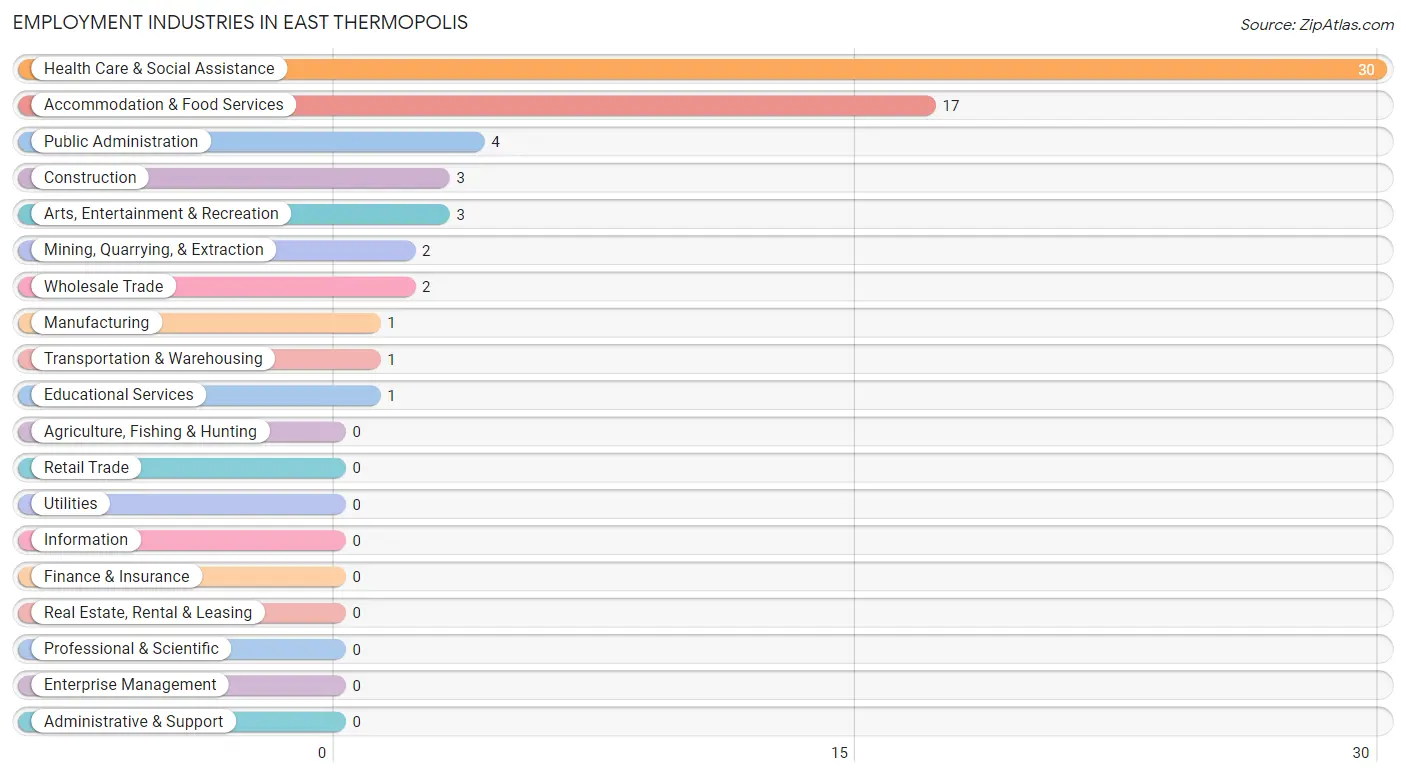
The major employment industries in East Thermopolis include Health Care & Social Assistance (30 | 40.0%), Accommodation & Food Services (17 | 22.7%), Public Administration (4 | 5.3%), Construction (3 | 4.0%), and Arts, Entertainment & Recreation (3 | 4.0%).
Employment Industries by Sex in East Thermopolis
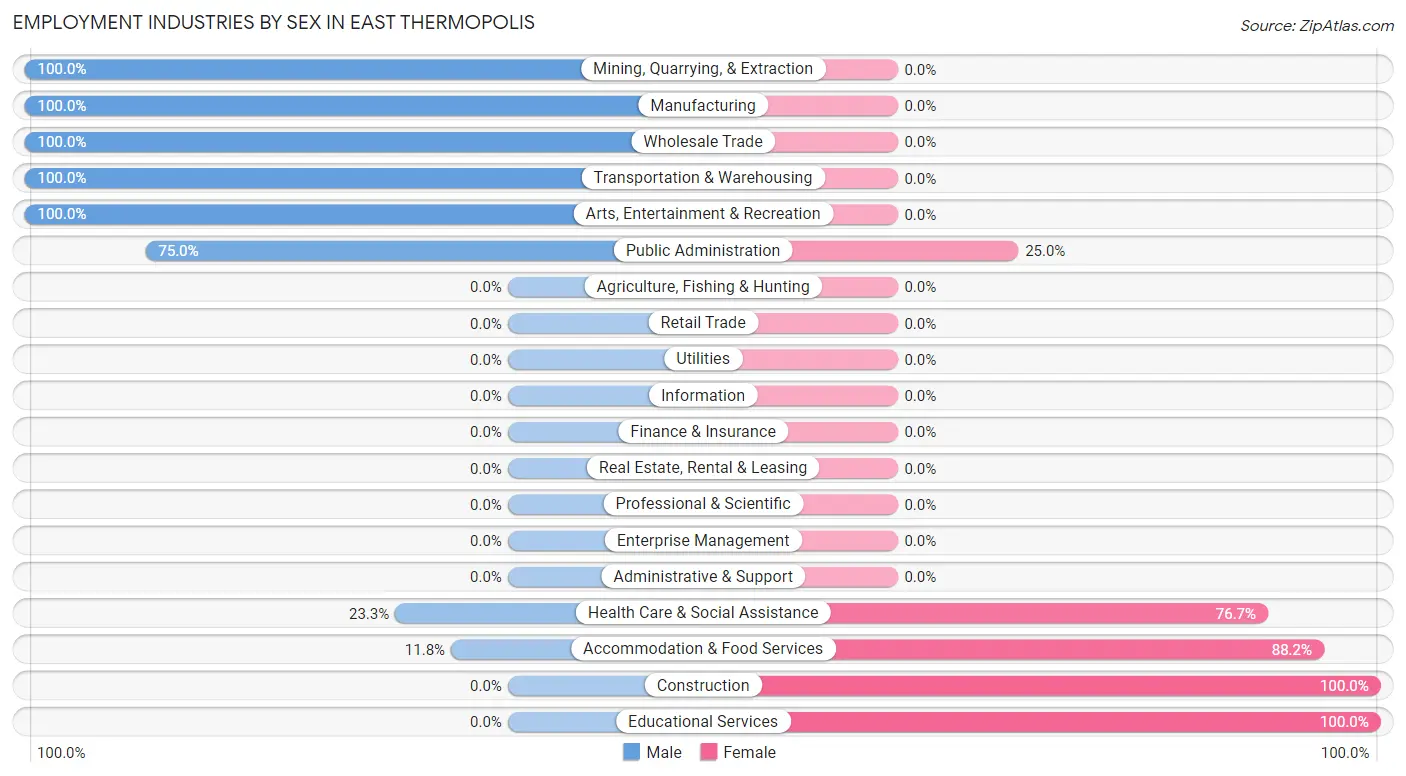
The East Thermopolis industries that see more men than women are Mining, Quarrying, & Extraction (100.0%), Manufacturing (100.0%), and Wholesale Trade (100.0%), whereas the industries that tend to have a higher number of women are Construction (100.0%), Educational Services (100.0%), and Accommodation & Food Services (88.2%).
| Industry | Male | Female |
| Agriculture, Fishing & Hunting | 0 (0.0%) | 0 (0.0%) |
| Mining, Quarrying, & Extraction | 2 (100.0%) | 0 (0.0%) |
| Construction | 0 (0.0%) | 3 (100.0%) |
| Manufacturing | 1 (100.0%) | 0 (0.0%) |
| Wholesale Trade | 2 (100.0%) | 0 (0.0%) |
| Retail Trade | 0 (0.0%) | 0 (0.0%) |
| Transportation & Warehousing | 1 (100.0%) | 0 (0.0%) |
| Utilities | 0 (0.0%) | 0 (0.0%) |
| Information | 0 (0.0%) | 0 (0.0%) |
| Finance & Insurance | 0 (0.0%) | 0 (0.0%) |
| Real Estate, Rental & Leasing | 0 (0.0%) | 0 (0.0%) |
| Professional & Scientific | 0 (0.0%) | 0 (0.0%) |
| Enterprise Management | 0 (0.0%) | 0 (0.0%) |
| Administrative & Support | 0 (0.0%) | 0 (0.0%) |
| Educational Services | 0 (0.0%) | 1 (100.0%) |
| Health Care & Social Assistance | 7 (23.3%) | 23 (76.7%) |
| Arts, Entertainment & Recreation | 3 (100.0%) | 0 (0.0%) |
| Accommodation & Food Services | 2 (11.8%) | 15 (88.2%) |
| Public Administration | 3 (75.0%) | 1 (25.0%) |
| Total | 31 (41.3%) | 44 (58.7%) |
Education in East Thermopolis
School Enrollment in East Thermopolis
The most common levels of schooling among the 42 students in East Thermopolis are college / undergraduate (19 | 45.2%), middle school (11 | 26.2%), and high school (7 | 16.7%).
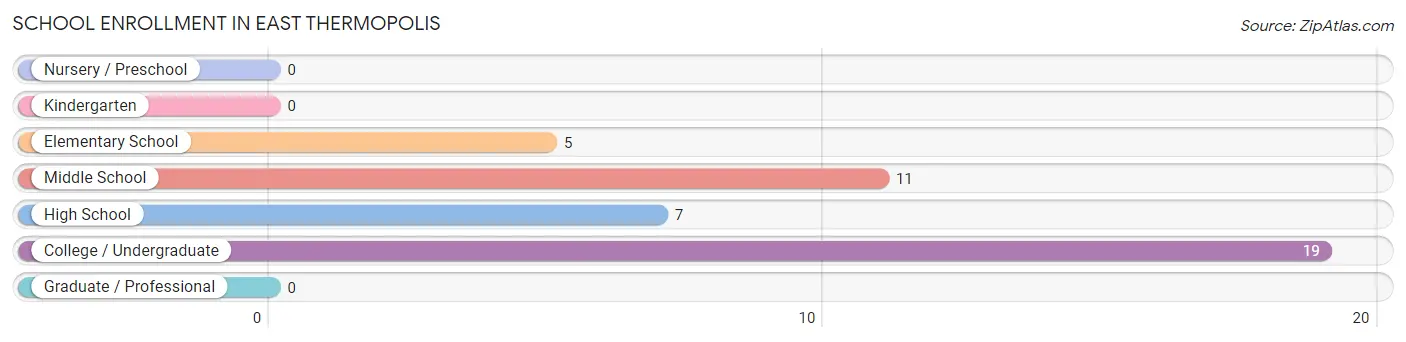
| School Level | # Students | % Students |
| Nursery / Preschool | 0 | 0.0% |
| Kindergarten | 0 | 0.0% |
| Elementary School | 5 | 11.9% |
| Middle School | 11 | 26.2% |
| High School | 7 | 16.7% |
| College / Undergraduate | 19 | 45.2% |
| Graduate / Professional | 0 | 0.0% |
| Total | 42 | 100.0% |
School Enrollment by Age by Funding Source in East Thermopolis
Out of a total of 42 students who are enrolled in schools in East Thermopolis, 20 (47.6%) attend a private institution, while the remaining 22 (52.4%) are enrolled in public schools. The age group of 35 years and over has the highest likelihood of being enrolled in private schools, with 16 (100.0% in the age bracket) enrolled. Conversely, the age group of 15 to 17 year olds has the lowest likelihood of being enrolled in a private school, with 9 (100.0% in the age bracket) attending a public institution.
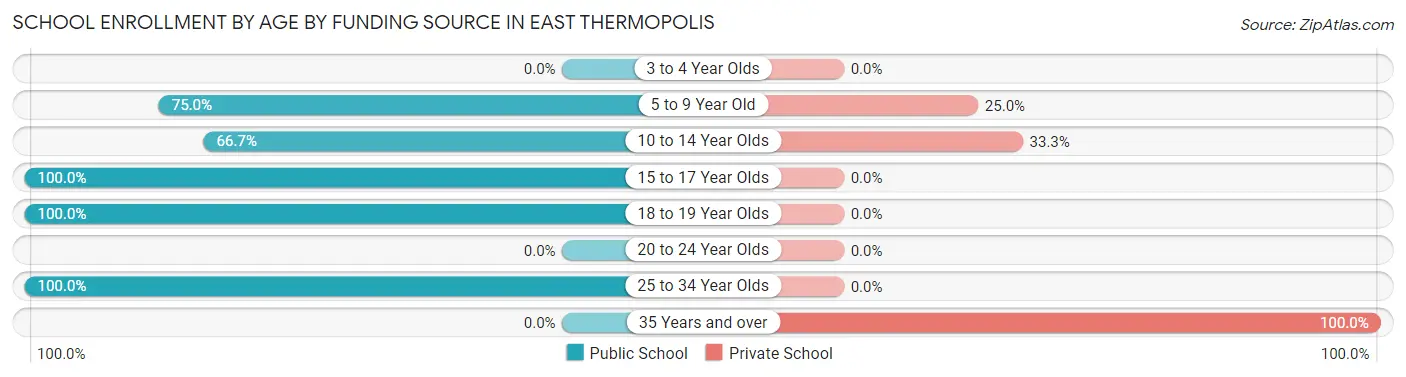
| Age Bracket | Public School | Private School |
| 3 to 4 Year Olds | 0 (0.0%) | 0 (0.0%) |
| 5 to 9 Year Old | 3 (75.0%) | 1 (25.0%) |
| 10 to 14 Year Olds | 6 (66.7%) | 3 (33.3%) |
| 15 to 17 Year Olds | 9 (100.0%) | 0 (0.0%) |
| 18 to 19 Year Olds | 1 (100.0%) | 0 (0.0%) |
| 20 to 24 Year Olds | 0 (0.0%) | 0 (0.0%) |
| 25 to 34 Year Olds | 3 (100.0%) | 0 (0.0%) |
| 35 Years and over | 0 (0.0%) | 16 (100.0%) |
| Total | 22 (52.4%) | 20 (47.6%) |
Educational Attainment by Field of Study in East Thermopolis
Liberal arts & history (9 | 26.5%), business (6 | 17.6%), science & technology (5 | 14.7%), literature & languages (5 | 14.7%), and education (4 | 11.8%) are the most common fields of study among 34 individuals in East Thermopolis who have obtained a bachelor's degree or higher.
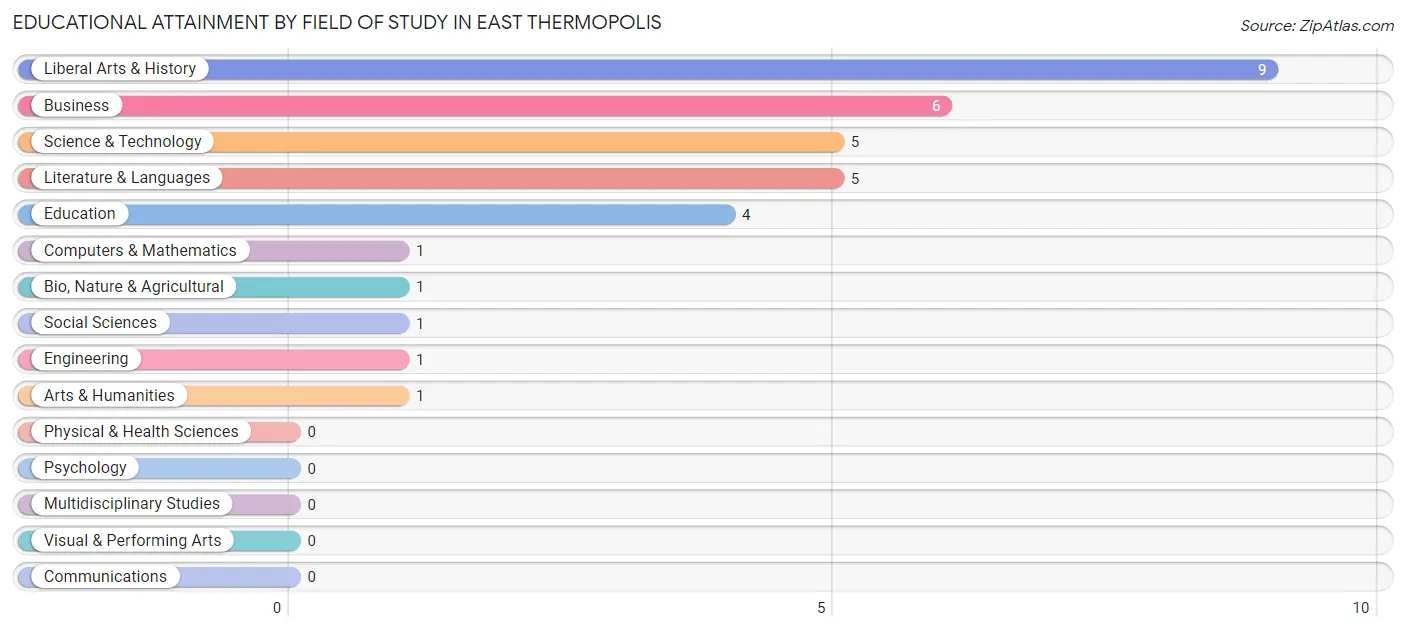
| Field of Study | # Graduates | % Graduates |
| Computers & Mathematics | 1 | 2.9% |
| Bio, Nature & Agricultural | 1 | 2.9% |
| Physical & Health Sciences | 0 | 0.0% |
| Psychology | 0 | 0.0% |
| Social Sciences | 1 | 2.9% |
| Engineering | 1 | 2.9% |
| Multidisciplinary Studies | 0 | 0.0% |
| Science & Technology | 5 | 14.7% |
| Business | 6 | 17.6% |
| Education | 4 | 11.8% |
| Literature & Languages | 5 | 14.7% |
| Liberal Arts & History | 9 | 26.5% |
| Visual & Performing Arts | 0 | 0.0% |
| Communications | 0 | 0.0% |
| Arts & Humanities | 1 | 2.9% |
| Total | 34 | 100.0% |
Transportation & Commute in East Thermopolis
Vehicle Availability by Sex in East Thermopolis
The most prevalent vehicle ownership categories in East Thermopolis are males with 2 vehicles (14, accounting for 48.3%) and females with 2 vehicles (18, making up 31.8%).
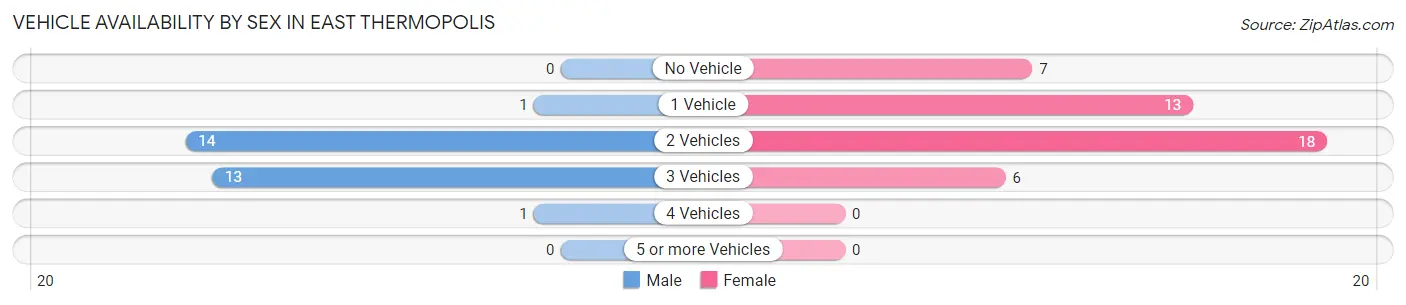
| Vehicles Available | Male | Female |
| No Vehicle | 0 (0.0%) | 7 (15.9%) |
| 1 Vehicle | 1 (3.5%) | 13 (29.5%) |
| 2 Vehicles | 14 (48.3%) | 18 (40.9%) |
| 3 Vehicles | 13 (44.8%) | 6 (13.6%) |
| 4 Vehicles | 1 (3.5%) | 0 (0.0%) |
| 5 or more Vehicles | 0 (0.0%) | 0 (0.0%) |
| Total | 29 (100.0%) | 44 (100.0%) |
Commute Time in East Thermopolis
The most frequently occuring commute durations in East Thermopolis are less than 5 minutes (31 commuters, 44.3%), 45 to 59 minutes (17 commuters, 24.3%), and 5 to 9 minutes (16 commuters, 22.9%).
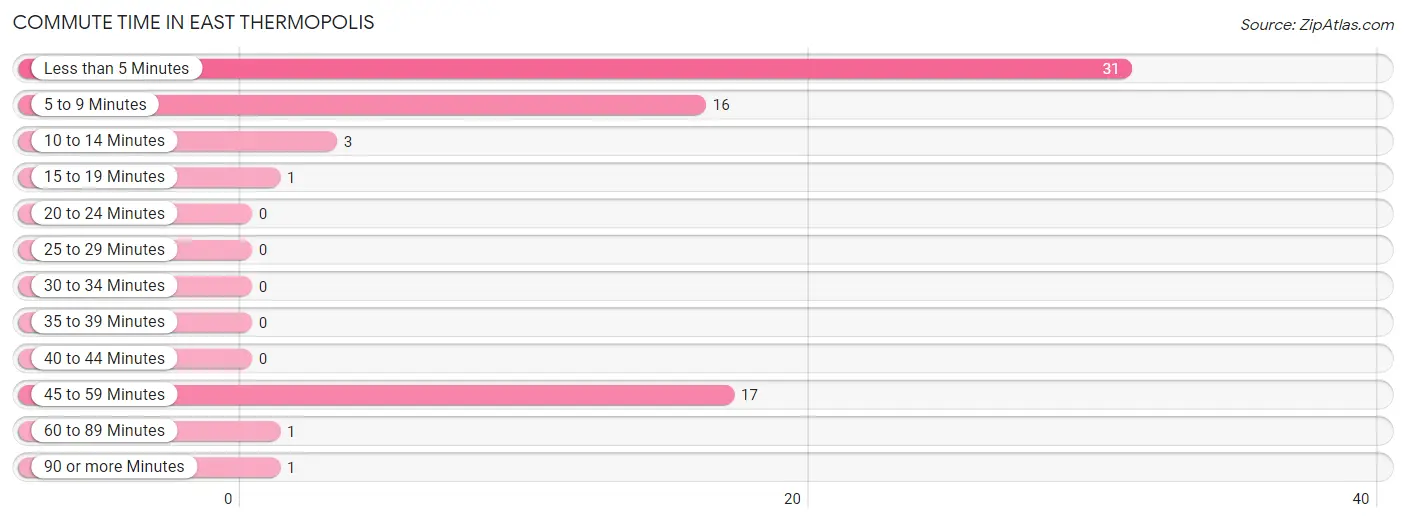
| Commute Time | # Commuters | % Commuters |
| Less than 5 Minutes | 31 | 44.3% |
| 5 to 9 Minutes | 16 | 22.9% |
| 10 to 14 Minutes | 3 | 4.3% |
| 15 to 19 Minutes | 1 | 1.4% |
| 20 to 24 Minutes | 0 | 0.0% |
| 25 to 29 Minutes | 0 | 0.0% |
| 30 to 34 Minutes | 0 | 0.0% |
| 35 to 39 Minutes | 0 | 0.0% |
| 40 to 44 Minutes | 0 | 0.0% |
| 45 to 59 Minutes | 17 | 24.3% |
| 60 to 89 Minutes | 1 | 1.4% |
| 90 or more Minutes | 1 | 1.4% |
Commute Time by Sex in East Thermopolis
The most common commute times in East Thermopolis are less than 5 minutes (20 commuters, 69.0%) for males and 45 to 59 minutes (16 commuters, 39.0%) for females.
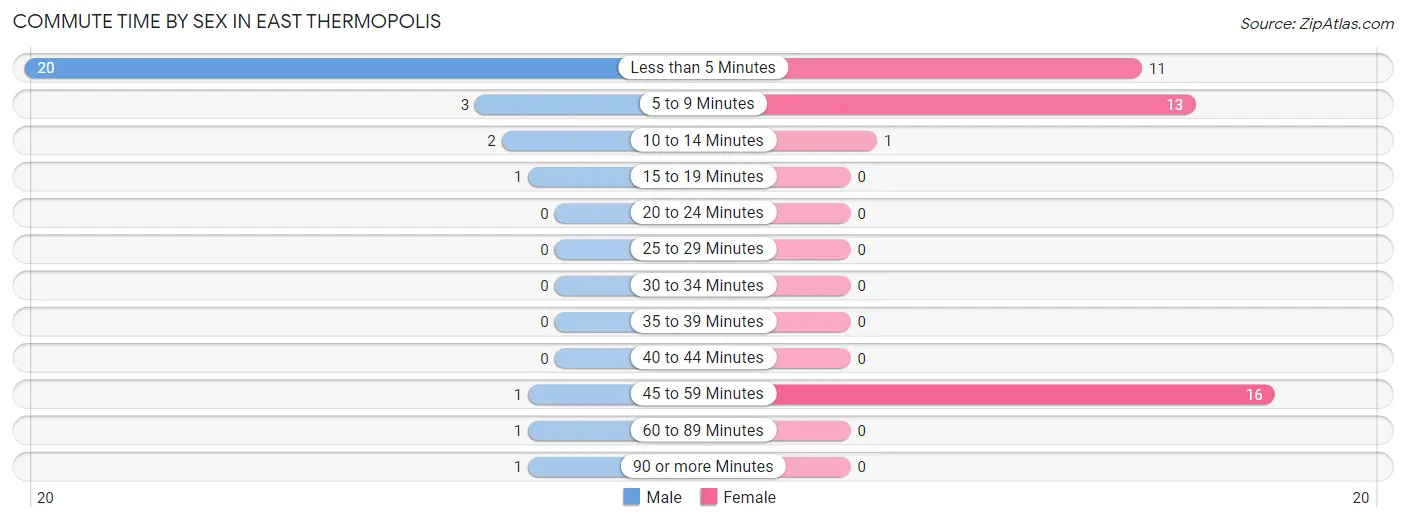
| Commute Time | Male | Female |
| Less than 5 Minutes | 20 (69.0%) | 11 (26.8%) |
| 5 to 9 Minutes | 3 (10.3%) | 13 (31.7%) |
| 10 to 14 Minutes | 2 (6.9%) | 1 (2.4%) |
| 15 to 19 Minutes | 1 (3.5%) | 0 (0.0%) |
| 20 to 24 Minutes | 0 (0.0%) | 0 (0.0%) |
| 25 to 29 Minutes | 0 (0.0%) | 0 (0.0%) |
| 30 to 34 Minutes | 0 (0.0%) | 0 (0.0%) |
| 35 to 39 Minutes | 0 (0.0%) | 0 (0.0%) |
| 40 to 44 Minutes | 0 (0.0%) | 0 (0.0%) |
| 45 to 59 Minutes | 1 (3.5%) | 16 (39.0%) |
| 60 to 89 Minutes | 1 (3.5%) | 0 (0.0%) |
| 90 or more Minutes | 1 (3.5%) | 0 (0.0%) |
Time of Departure to Work by Sex in East Thermopolis
The most frequent times of departure to work in East Thermopolis are 7:30 AM to 7:59 AM (13, 44.8%) for males and 6:30 AM to 6:59 AM (19, 46.3%) for females.
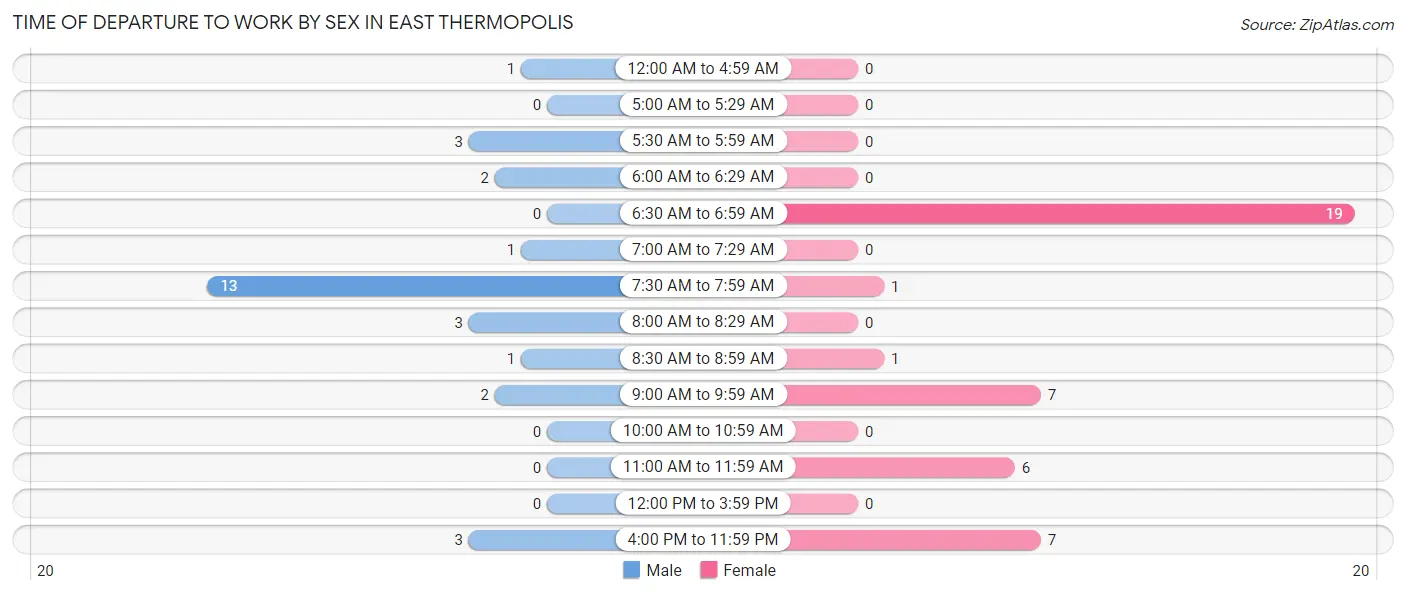
| Time of Departure | Male | Female |
| 12:00 AM to 4:59 AM | 1 (3.5%) | 0 (0.0%) |
| 5:00 AM to 5:29 AM | 0 (0.0%) | 0 (0.0%) |
| 5:30 AM to 5:59 AM | 3 (10.3%) | 0 (0.0%) |
| 6:00 AM to 6:29 AM | 2 (6.9%) | 0 (0.0%) |
| 6:30 AM to 6:59 AM | 0 (0.0%) | 19 (46.3%) |
| 7:00 AM to 7:29 AM | 1 (3.5%) | 0 (0.0%) |
| 7:30 AM to 7:59 AM | 13 (44.8%) | 1 (2.4%) |
| 8:00 AM to 8:29 AM | 3 (10.3%) | 0 (0.0%) |
| 8:30 AM to 8:59 AM | 1 (3.5%) | 1 (2.4%) |
| 9:00 AM to 9:59 AM | 2 (6.9%) | 7 (17.1%) |
| 10:00 AM to 10:59 AM | 0 (0.0%) | 0 (0.0%) |
| 11:00 AM to 11:59 AM | 0 (0.0%) | 6 (14.6%) |
| 12:00 PM to 3:59 PM | 0 (0.0%) | 0 (0.0%) |
| 4:00 PM to 11:59 PM | 3 (10.3%) | 7 (17.1%) |
| Total | 29 (100.0%) | 41 (100.0%) |
Housing Occupancy in East Thermopolis
Occupancy by Ownership in East Thermopolis
Of the total 123 dwellings in East Thermopolis, owner-occupied units account for 49 (39.8%), while renter-occupied units make up 74 (60.2%).
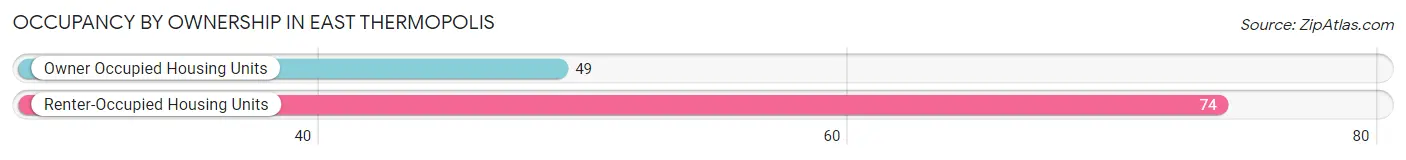
| Occupancy | # Housing Units | % Housing Units |
| Owner Occupied Housing Units | 49 | 39.8% |
| Renter-Occupied Housing Units | 74 | 60.2% |
| Total Occupied Housing Units | 123 | 100.0% |
Occupancy by Household Size in East Thermopolis
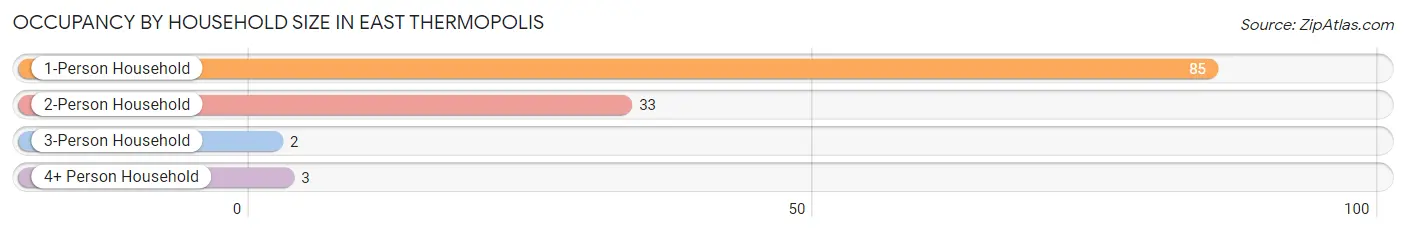
| Household Size | # Housing Units | % Housing Units |
| 1-Person Household | 85 | 69.1% |
| 2-Person Household | 33 | 26.8% |
| 3-Person Household | 2 | 1.6% |
| 4+ Person Household | 3 | 2.4% |
| Total Housing Units | 123 | 100.0% |
Occupancy by Ownership by Household Size in East Thermopolis
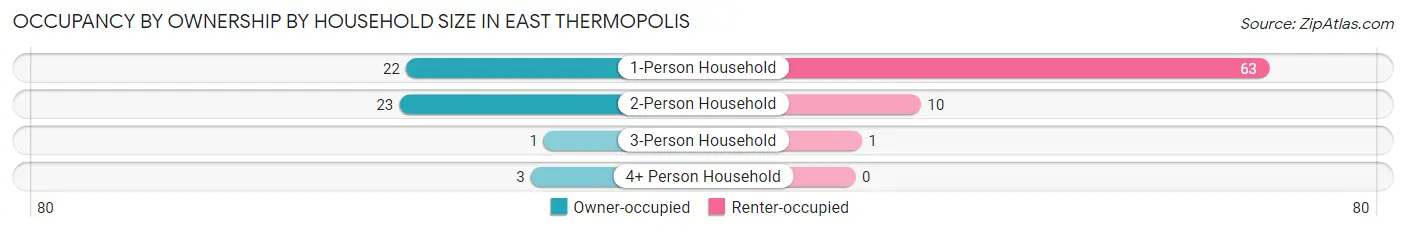
| Household Size | Owner-occupied | Renter-occupied |
| 1-Person Household | 22 (25.9%) | 63 (74.1%) |
| 2-Person Household | 23 (69.7%) | 10 (30.3%) |
| 3-Person Household | 1 (50.0%) | 1 (50.0%) |
| 4+ Person Household | 3 (100.0%) | 0 (0.0%) |
| Total Housing Units | 49 (39.8%) | 74 (60.2%) |
Occupancy by Educational Attainment in East Thermopolis
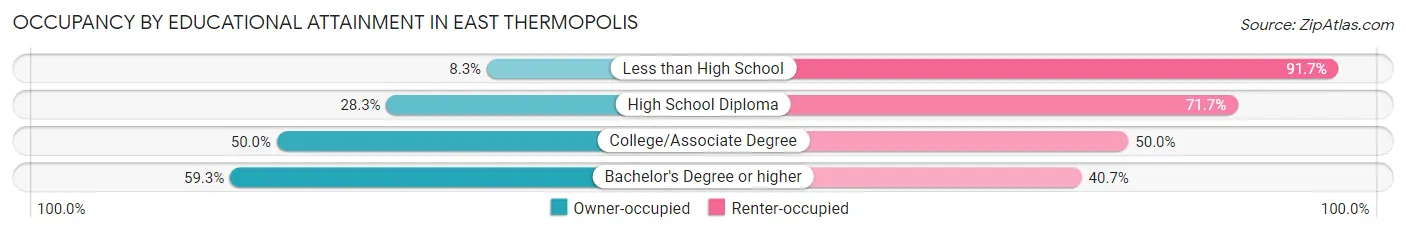
| Household Size | Owner-occupied | Renter-occupied |
| Less than High School | 1 (8.3%) | 11 (91.7%) |
| High School Diploma | 13 (28.3%) | 33 (71.7%) |
| College/Associate Degree | 19 (50.0%) | 19 (50.0%) |
| Bachelor's Degree or higher | 16 (59.3%) | 11 (40.7%) |
Occupancy by Age of Householder in East Thermopolis
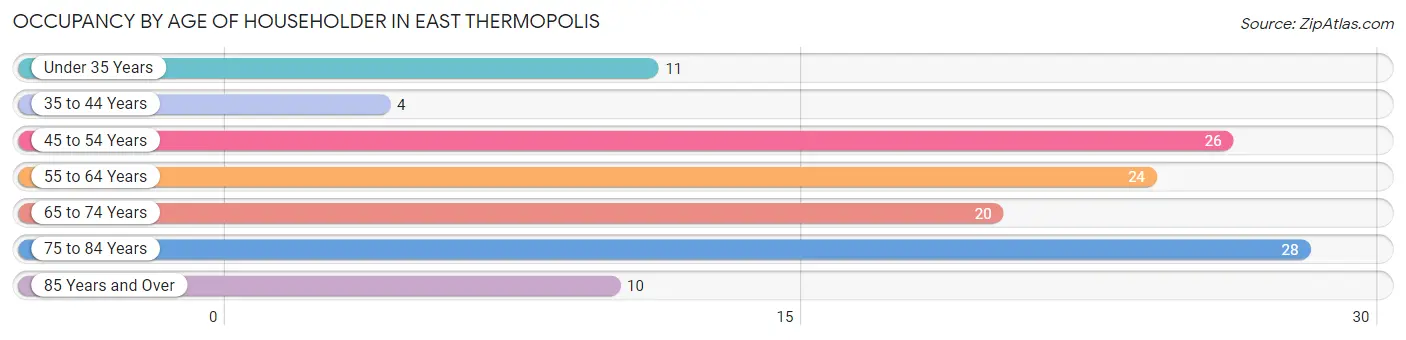
| Age Bracket | # Households | % Households |
| Under 35 Years | 11 | 8.9% |
| 35 to 44 Years | 4 | 3.3% |
| 45 to 54 Years | 26 | 21.1% |
| 55 to 64 Years | 24 | 19.5% |
| 65 to 74 Years | 20 | 16.3% |
| 75 to 84 Years | 28 | 22.8% |
| 85 Years and Over | 10 | 8.1% |
| Total | 123 | 100.0% |
Housing Finances in East Thermopolis
Median Income by Occupancy in East Thermopolis
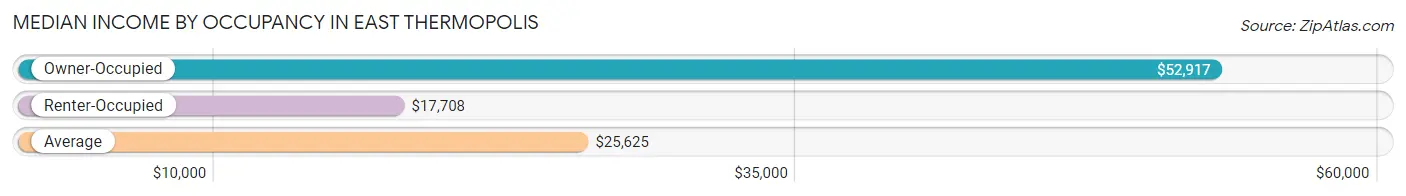
| Occupancy Type | # Households | Median Income |
| Owner-Occupied | 49 (39.8%) | $52,917 |
| Renter-Occupied | 74 (60.2%) | $17,708 |
| Average | 123 (100.0%) | $25,625 |
Occupancy by Householder Income Bracket in East Thermopolis
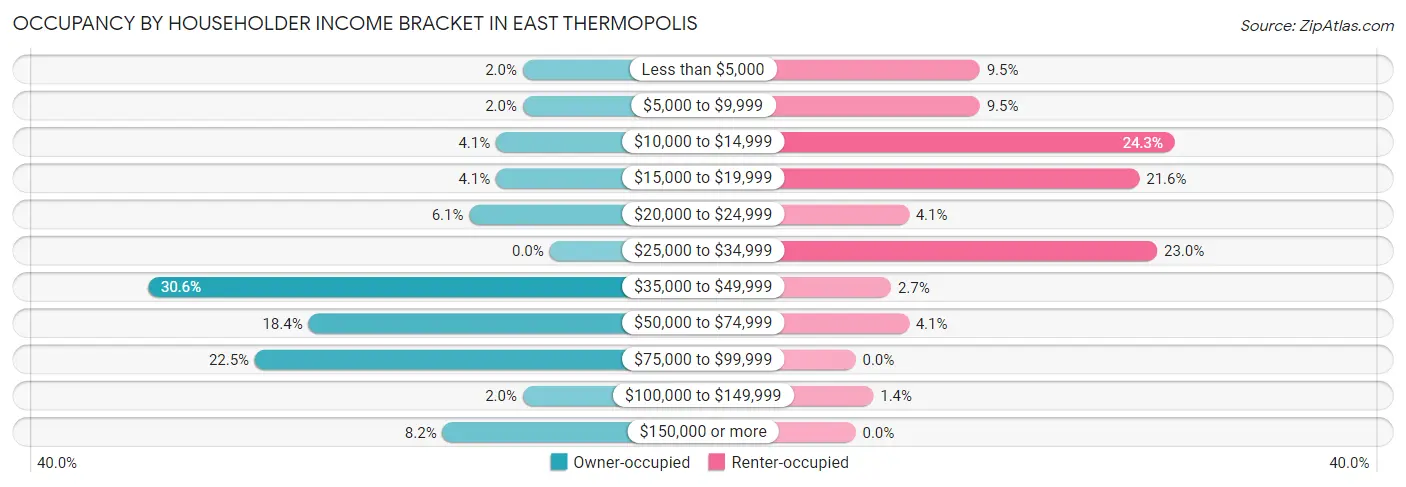
| Income Bracket | Owner-occupied | Renter-occupied |
| Less than $5,000 | 1 (2.0%) | 7 (9.5%) |
| $5,000 to $9,999 | 1 (2.0%) | 7 (9.5%) |
| $10,000 to $14,999 | 2 (4.1%) | 18 (24.3%) |
| $15,000 to $19,999 | 2 (4.1%) | 16 (21.6%) |
| $20,000 to $24,999 | 3 (6.1%) | 3 (4.1%) |
| $25,000 to $34,999 | 0 (0.0%) | 17 (23.0%) |
| $35,000 to $49,999 | 15 (30.6%) | 2 (2.7%) |
| $50,000 to $74,999 | 9 (18.4%) | 3 (4.1%) |
| $75,000 to $99,999 | 11 (22.5%) | 0 (0.0%) |
| $100,000 to $149,999 | 1 (2.0%) | 1 (1.3%) |
| $150,000 or more | 4 (8.2%) | 0 (0.0%) |
| Total | 49 (100.0%) | 74 (100.0%) |
Monthly Housing Cost Tiers in East Thermopolis
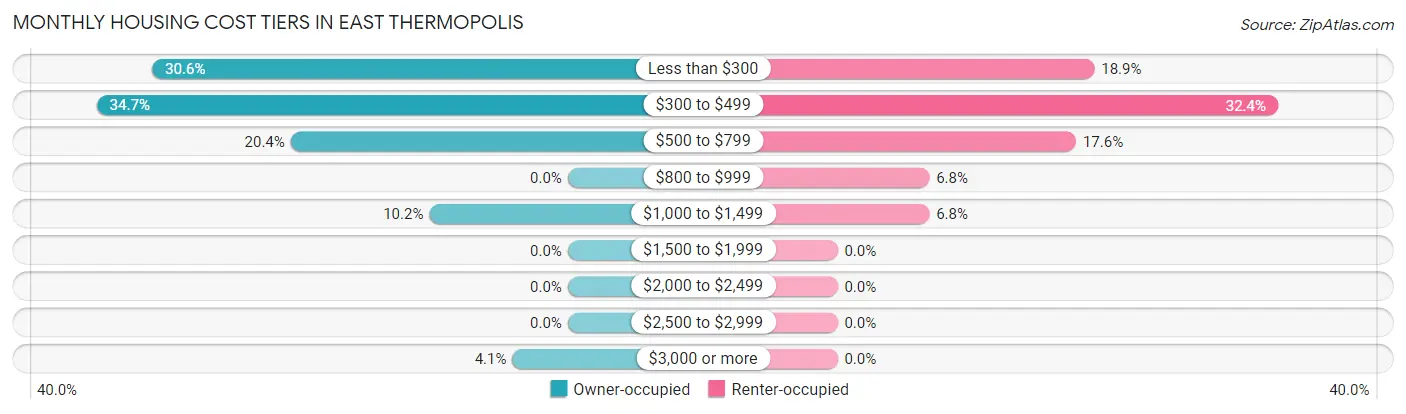
| Monthly Cost | Owner-occupied | Renter-occupied |
| Less than $300 | 15 (30.6%) | 14 (18.9%) |
| $300 to $499 | 17 (34.7%) | 24 (32.4%) |
| $500 to $799 | 10 (20.4%) | 13 (17.6%) |
| $800 to $999 | 0 (0.0%) | 5 (6.8%) |
| $1,000 to $1,499 | 5 (10.2%) | 5 (6.8%) |
| $1,500 to $1,999 | 0 (0.0%) | 0 (0.0%) |
| $2,000 to $2,499 | 0 (0.0%) | 0 (0.0%) |
| $2,500 to $2,999 | 0 (0.0%) | 0 (0.0%) |
| $3,000 or more | 2 (4.1%) | 0 (0.0%) |
| Total | 49 (100.0%) | 74 (100.0%) |
Physical Housing Characteristics in East Thermopolis
Housing Structures in East Thermopolis
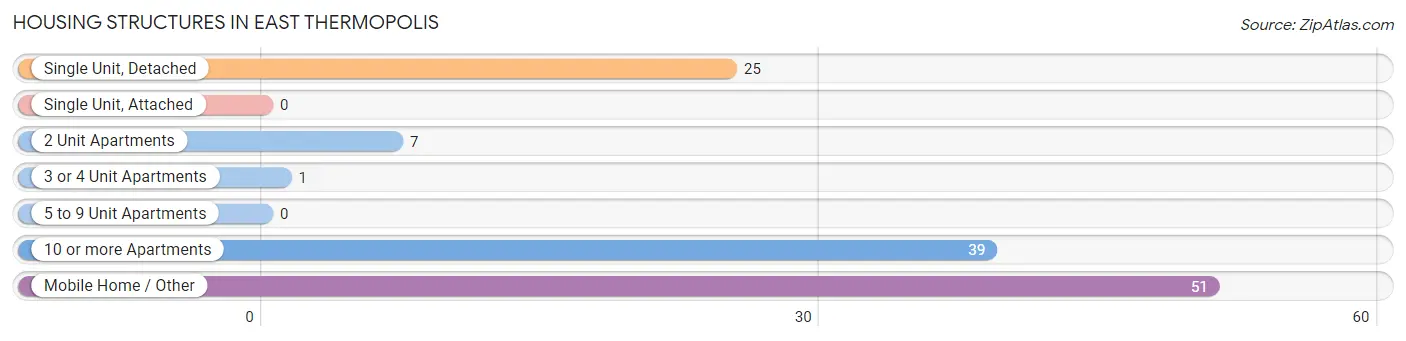
| Structure Type | # Housing Units | % Housing Units |
| Single Unit, Detached | 25 | 20.3% |
| Single Unit, Attached | 0 | 0.0% |
| 2 Unit Apartments | 7 | 5.7% |
| 3 or 4 Unit Apartments | 1 | 0.8% |
| 5 to 9 Unit Apartments | 0 | 0.0% |
| 10 or more Apartments | 39 | 31.7% |
| Mobile Home / Other | 51 | 41.5% |
| Total | 123 | 100.0% |
Housing Structures by Occupancy in East Thermopolis
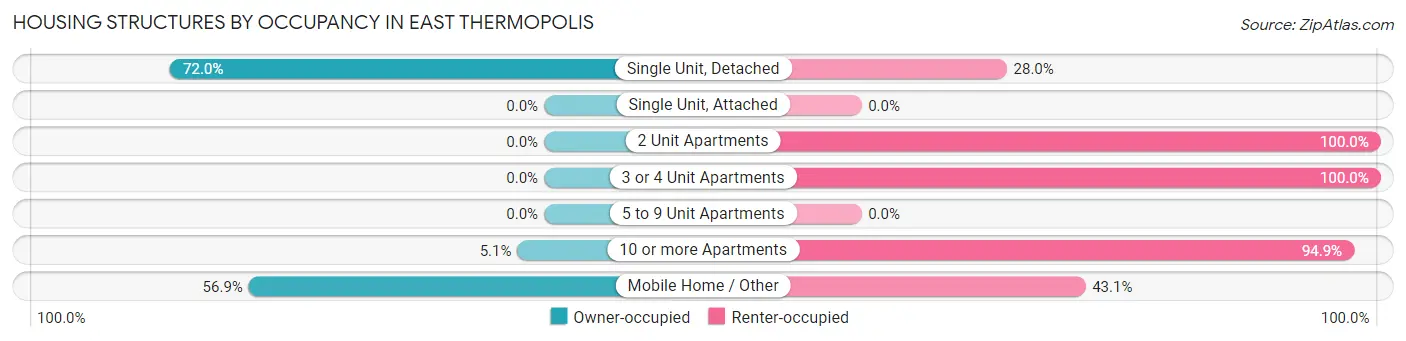
| Structure Type | Owner-occupied | Renter-occupied |
| Single Unit, Detached | 18 (72.0%) | 7 (28.0%) |
| Single Unit, Attached | 0 (0.0%) | 0 (0.0%) |
| 2 Unit Apartments | 0 (0.0%) | 7 (100.0%) |
| 3 or 4 Unit Apartments | 0 (0.0%) | 1 (100.0%) |
| 5 to 9 Unit Apartments | 0 (0.0%) | 0 (0.0%) |
| 10 or more Apartments | 2 (5.1%) | 37 (94.9%) |
| Mobile Home / Other | 29 (56.9%) | 22 (43.1%) |
| Total | 49 (39.8%) | 74 (60.2%) |
Housing Structures by Number of Rooms in East Thermopolis
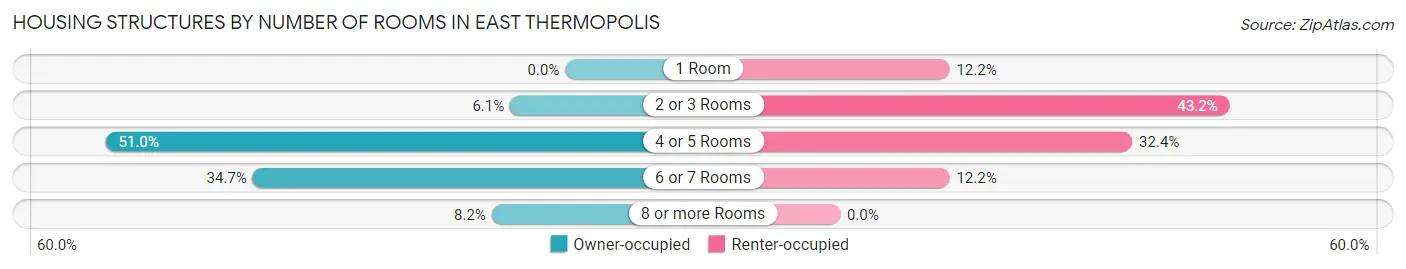
| Number of Rooms | Owner-occupied | Renter-occupied |
| 1 Room | 0 (0.0%) | 9 (12.2%) |
| 2 or 3 Rooms | 3 (6.1%) | 32 (43.2%) |
| 4 or 5 Rooms | 25 (51.0%) | 24 (32.4%) |
| 6 or 7 Rooms | 17 (34.7%) | 9 (12.2%) |
| 8 or more Rooms | 4 (8.2%) | 0 (0.0%) |
| Total | 49 (100.0%) | 74 (100.0%) |
Housing Structure by Heating Type in East Thermopolis
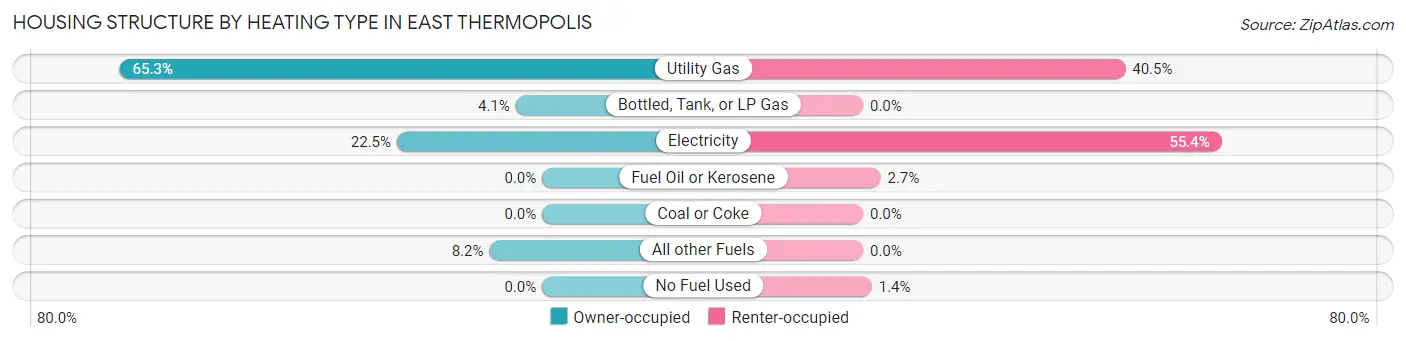
| Heating Type | Owner-occupied | Renter-occupied |
| Utility Gas | 32 (65.3%) | 30 (40.5%) |
| Bottled, Tank, or LP Gas | 2 (4.1%) | 0 (0.0%) |
| Electricity | 11 (22.5%) | 41 (55.4%) |
| Fuel Oil or Kerosene | 0 (0.0%) | 2 (2.7%) |
| Coal or Coke | 0 (0.0%) | 0 (0.0%) |
| All other Fuels | 4 (8.2%) | 0 (0.0%) |
| No Fuel Used | 0 (0.0%) | 1 (1.3%) |
| Total | 49 (100.0%) | 74 (100.0%) |
Household Vehicle Usage in East Thermopolis
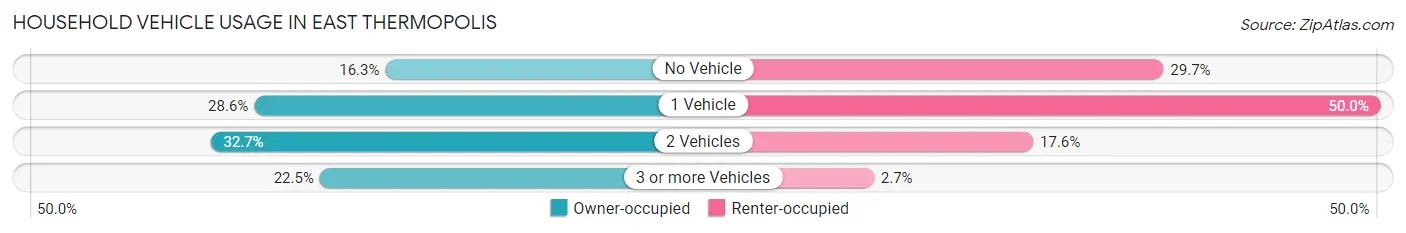
| Vehicles per Household | Owner-occupied | Renter-occupied |
| No Vehicle | 8 (16.3%) | 22 (29.7%) |
| 1 Vehicle | 14 (28.6%) | 37 (50.0%) |
| 2 Vehicles | 16 (32.7%) | 13 (17.6%) |
| 3 or more Vehicles | 11 (22.5%) | 2 (2.7%) |
| Total | 49 (100.0%) | 74 (100.0%) |
Real Estate & Mortgages in East Thermopolis
Real Estate and Mortgage Overview in East Thermopolis
| Characteristic | Without Mortgage | With Mortgage |
| Housing Units | 37 | 12 |
| Median Property Value | $96,300 | $100,000 |
| Median Household Income | $44,688 | $3 |
| Monthly Housing Costs | $329 | $2 |
| Real Estate Taxes | $460 | $0 |
Property Value by Mortgage Status in East Thermopolis
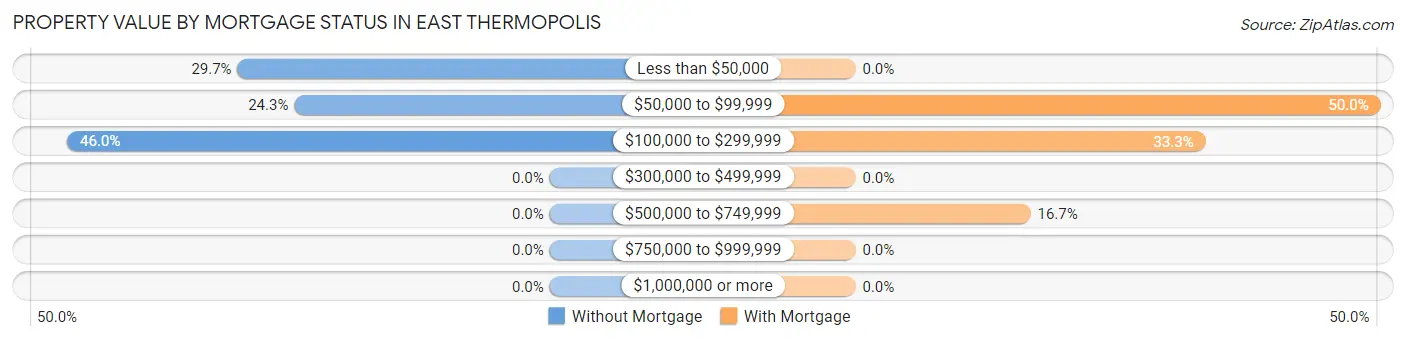
| Property Value | Without Mortgage | With Mortgage |
| Less than $50,000 | 11 (29.7%) | 0 (0.0%) |
| $50,000 to $99,999 | 9 (24.3%) | 6 (50.0%) |
| $100,000 to $299,999 | 17 (46.0%) | 4 (33.3%) |
| $300,000 to $499,999 | 0 (0.0%) | 0 (0.0%) |
| $500,000 to $749,999 | 0 (0.0%) | 2 (16.7%) |
| $750,000 to $999,999 | 0 (0.0%) | 0 (0.0%) |
| $1,000,000 or more | 0 (0.0%) | 0 (0.0%) |
| Total | 37 (100.0%) | 12 (100.0%) |
Household Income by Mortgage Status in East Thermopolis
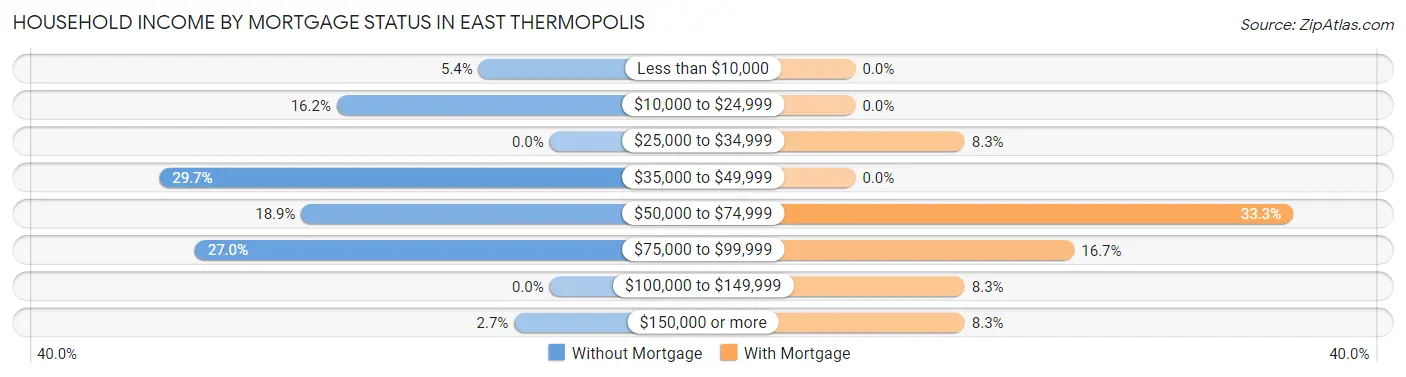
| Household Income | Without Mortgage | With Mortgage |
| Less than $10,000 | 2 (5.4%) | 0 (0.0%) |
| $10,000 to $24,999 | 6 (16.2%) | 0 (0.0%) |
| $25,000 to $34,999 | 0 (0.0%) | 1 (8.3%) |
| $35,000 to $49,999 | 11 (29.7%) | 0 (0.0%) |
| $50,000 to $74,999 | 7 (18.9%) | 4 (33.3%) |
| $75,000 to $99,999 | 10 (27.0%) | 2 (16.7%) |
| $100,000 to $149,999 | 0 (0.0%) | 1 (8.3%) |
| $150,000 or more | 1 (2.7%) | 1 (8.3%) |
| Total | 37 (100.0%) | 12 (100.0%) |
Property Value to Household Income Ratio in East Thermopolis
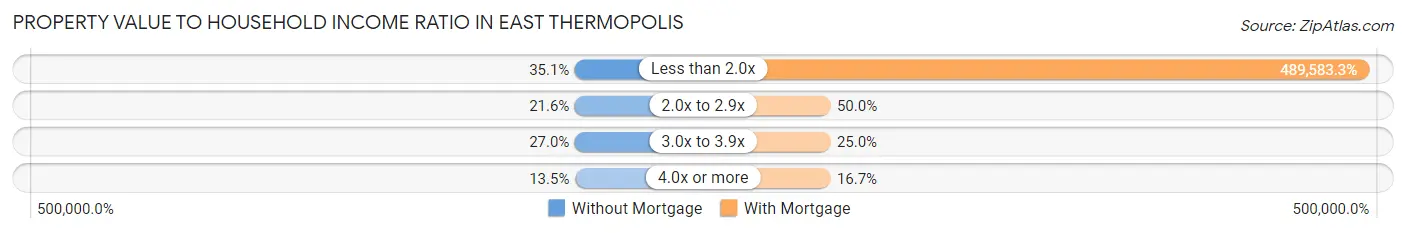
| Value-to-Income Ratio | Without Mortgage | With Mortgage |
| Less than 2.0x | 13 (35.1%) | 58,750 (489,583.3%) |
| 2.0x to 2.9x | 8 (21.6%) | 6 (50.0%) |
| 3.0x to 3.9x | 10 (27.0%) | 3 (25.0%) |
| 4.0x or more | 5 (13.5%) | 2 (16.7%) |
| Total | 37 (100.0%) | 12 (100.0%) |
Real Estate Taxes by Mortgage Status in East Thermopolis
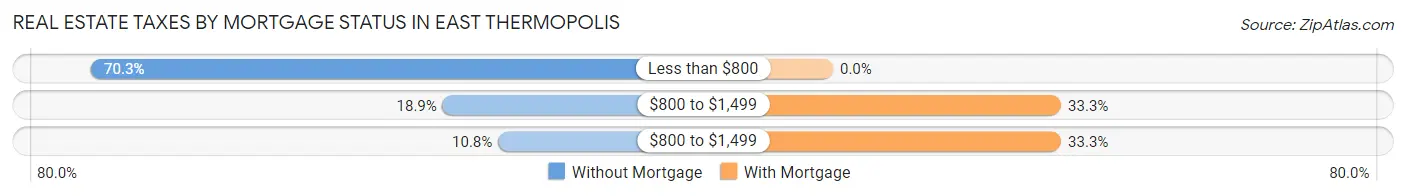
| Property Taxes | Without Mortgage | With Mortgage |
| Less than $800 | 26 (70.3%) | 0 (0.0%) |
| $800 to $1,499 | 7 (18.9%) | 4 (33.3%) |
| $800 to $1,499 | 4 (10.8%) | 4 (33.3%) |
| Total | 37 (100.0%) | 12 (100.0%) |
Health & Disability in East Thermopolis
Health Insurance Coverage by Age in East Thermopolis
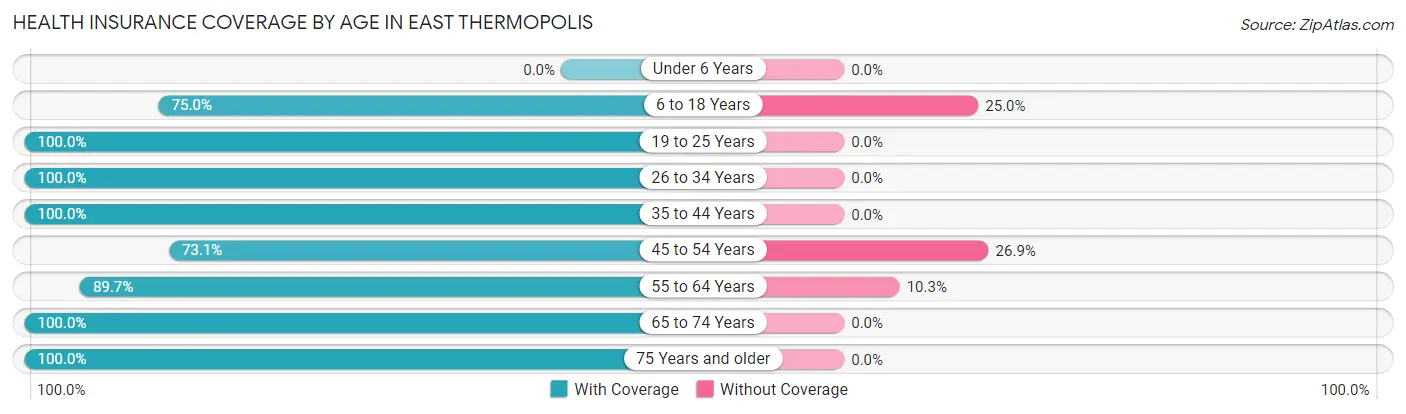
| Age Bracket | With Coverage | Without Coverage |
| Under 6 Years | 0 (0.0%) | 0 (0.0%) |
| 6 to 18 Years | 12 (75.0%) | 4 (25.0%) |
| 19 to 25 Years | 10 (100.0%) | 0 (0.0%) |
| 26 to 34 Years | 4 (100.0%) | 0 (0.0%) |
| 35 to 44 Years | 5 (100.0%) | 0 (0.0%) |
| 45 to 54 Years | 38 (73.1%) | 14 (26.9%) |
| 55 to 64 Years | 26 (89.7%) | 3 (10.3%) |
| 65 to 74 Years | 28 (100.0%) | 0 (0.0%) |
| 75 Years and older | 47 (100.0%) | 0 (0.0%) |
| Total | 170 (89.0%) | 21 (11.0%) |
Health Insurance Coverage by Citizenship Status in East Thermopolis
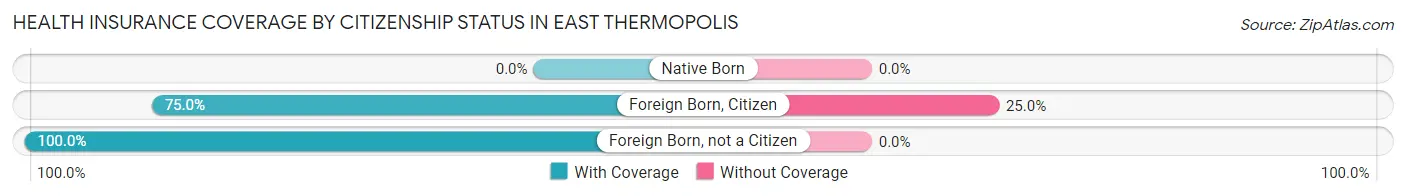
| Citizenship Status | With Coverage | Without Coverage |
| Native Born | 0 (0.0%) | 0 (0.0%) |
| Foreign Born, Citizen | 12 (75.0%) | 4 (25.0%) |
| Foreign Born, not a Citizen | 10 (100.0%) | 0 (0.0%) |
Health Insurance Coverage by Household Income in East Thermopolis
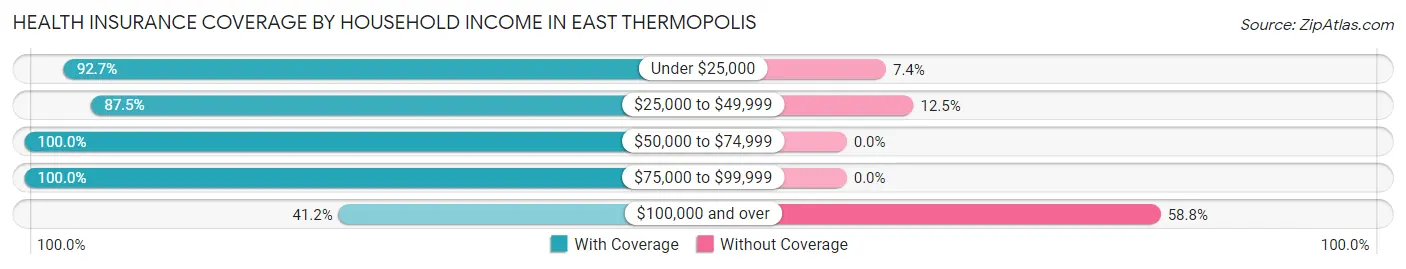
| Household Income | With Coverage | Without Coverage |
| Under $25,000 | 63 (92.6%) | 5 (7.3%) |
| $25,000 to $49,999 | 42 (87.5%) | 6 (12.5%) |
| $50,000 to $74,999 | 28 (100.0%) | 0 (0.0%) |
| $75,000 to $99,999 | 30 (100.0%) | 0 (0.0%) |
| $100,000 and over | 7 (41.2%) | 10 (58.8%) |
Public vs Private Health Insurance Coverage by Age in East Thermopolis
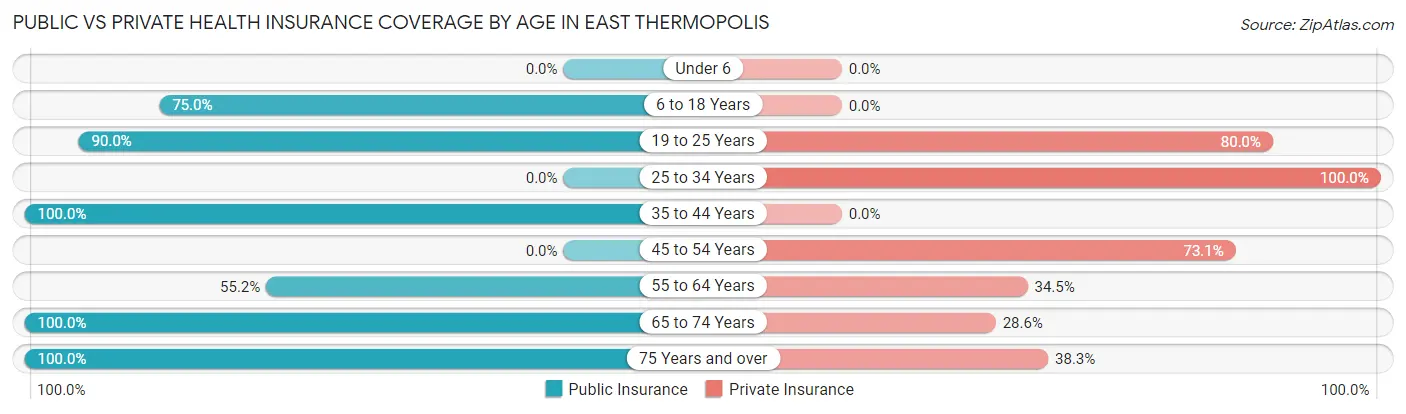
| Age Bracket | Public Insurance | Private Insurance |
| Under 6 | 0 (0.0%) | 0 (0.0%) |
| 6 to 18 Years | 12 (75.0%) | 0 (0.0%) |
| 19 to 25 Years | 9 (90.0%) | 8 (80.0%) |
| 25 to 34 Years | 0 (0.0%) | 4 (100.0%) |
| 35 to 44 Years | 5 (100.0%) | 0 (0.0%) |
| 45 to 54 Years | 0 (0.0%) | 38 (73.1%) |
| 55 to 64 Years | 16 (55.2%) | 10 (34.5%) |
| 65 to 74 Years | 28 (100.0%) | 8 (28.6%) |
| 75 Years and over | 47 (100.0%) | 18 (38.3%) |
| Total | 117 (61.3%) | 86 (45.0%) |
Disability Status by Sex by Age in East Thermopolis
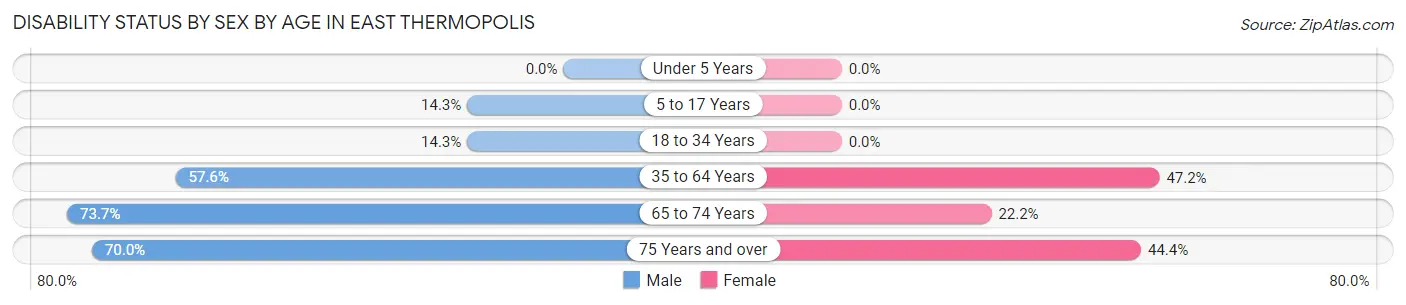
| Age Bracket | Male | Female |
| Under 5 Years | 0 (0.0%) | 0 (0.0%) |
| 5 to 17 Years | 1 (14.3%) | 0 (0.0%) |
| 18 to 34 Years | 1 (14.3%) | 0 (0.0%) |
| 35 to 64 Years | 19 (57.6%) | 25 (47.2%) |
| 65 to 74 Years | 14 (73.7%) | 2 (22.2%) |
| 75 Years and over | 14 (70.0%) | 12 (44.4%) |
Disability Class by Sex by Age in East Thermopolis
Disability Class: Hearing Difficulty
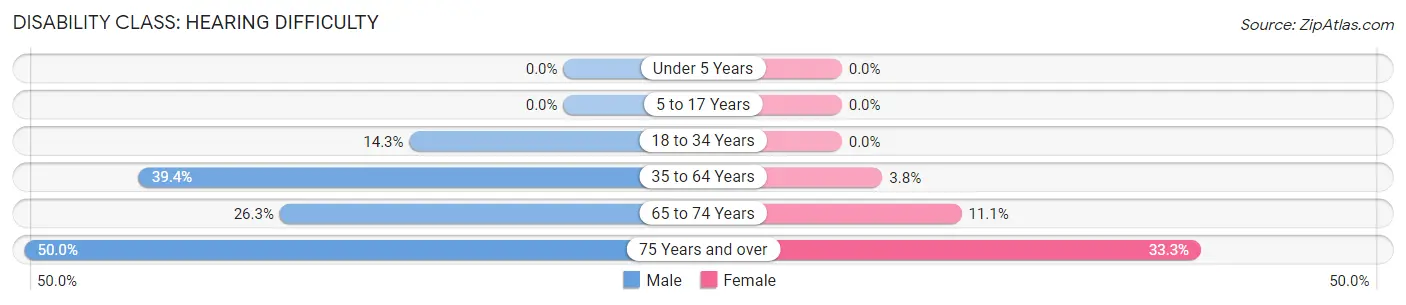
| Age Bracket | Male | Female |
| Under 5 Years | 0 (0.0%) | 0 (0.0%) |
| 5 to 17 Years | 0 (0.0%) | 0 (0.0%) |
| 18 to 34 Years | 1 (14.3%) | 0 (0.0%) |
| 35 to 64 Years | 13 (39.4%) | 2 (3.8%) |
| 65 to 74 Years | 5 (26.3%) | 1 (11.1%) |
| 75 Years and over | 10 (50.0%) | 9 (33.3%) |
Disability Class: Vision Difficulty
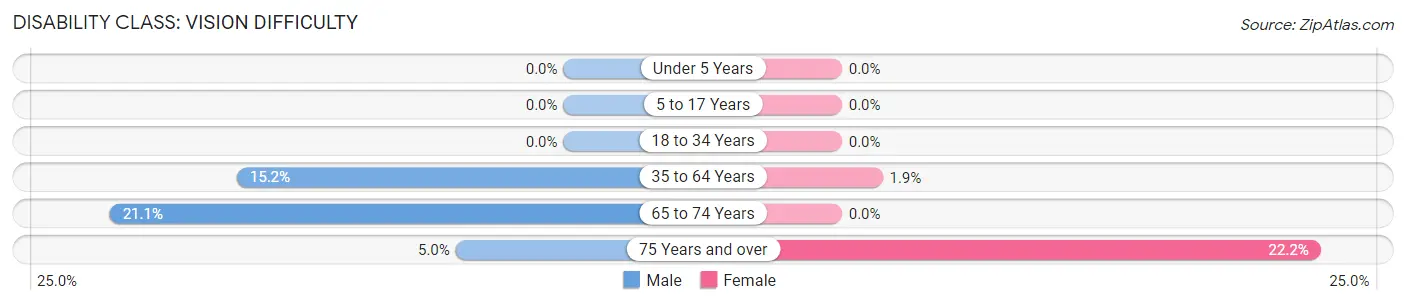
| Age Bracket | Male | Female |
| Under 5 Years | 0 (0.0%) | 0 (0.0%) |
| 5 to 17 Years | 0 (0.0%) | 0 (0.0%) |
| 18 to 34 Years | 0 (0.0%) | 0 (0.0%) |
| 35 to 64 Years | 5 (15.1%) | 1 (1.9%) |
| 65 to 74 Years | 4 (21.0%) | 0 (0.0%) |
| 75 Years and over | 1 (5.0%) | 6 (22.2%) |
Disability Class: Cognitive Difficulty
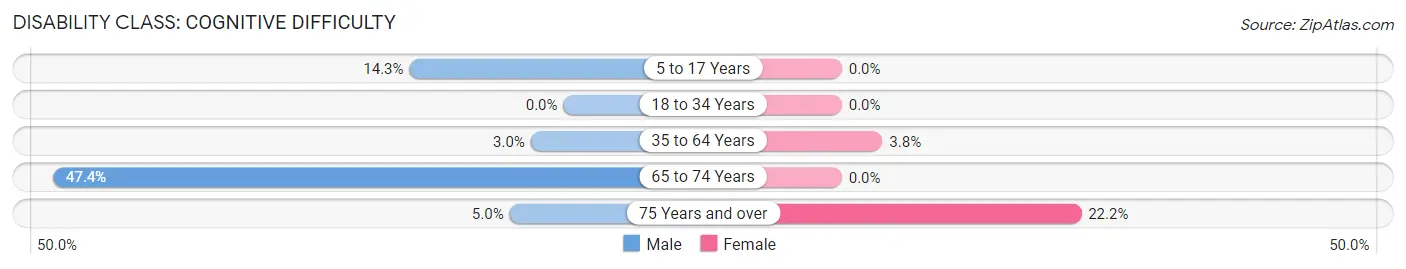
| Age Bracket | Male | Female |
| 5 to 17 Years | 1 (14.3%) | 0 (0.0%) |
| 18 to 34 Years | 0 (0.0%) | 0 (0.0%) |
| 35 to 64 Years | 1 (3.0%) | 2 (3.8%) |
| 65 to 74 Years | 9 (47.4%) | 0 (0.0%) |
| 75 Years and over | 1 (5.0%) | 6 (22.2%) |
Disability Class: Ambulatory Difficulty
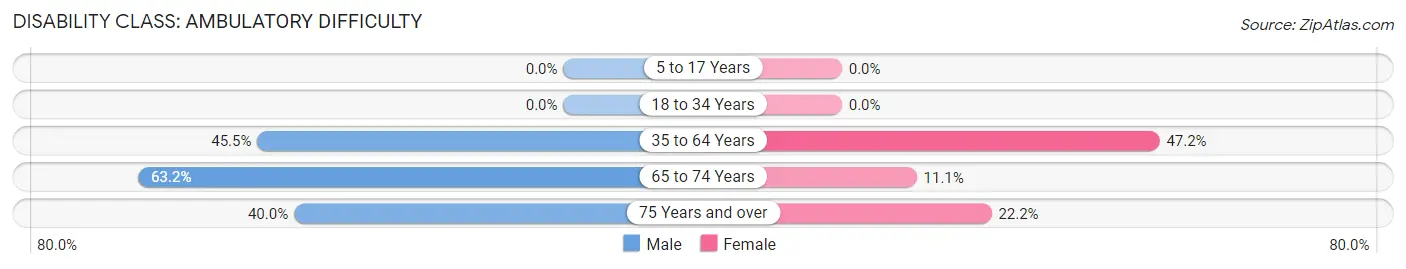
| Age Bracket | Male | Female |
| 5 to 17 Years | 0 (0.0%) | 0 (0.0%) |
| 18 to 34 Years | 0 (0.0%) | 0 (0.0%) |
| 35 to 64 Years | 15 (45.5%) | 25 (47.2%) |
| 65 to 74 Years | 12 (63.2%) | 1 (11.1%) |
| 75 Years and over | 8 (40.0%) | 6 (22.2%) |
Disability Class: Self-Care Difficulty
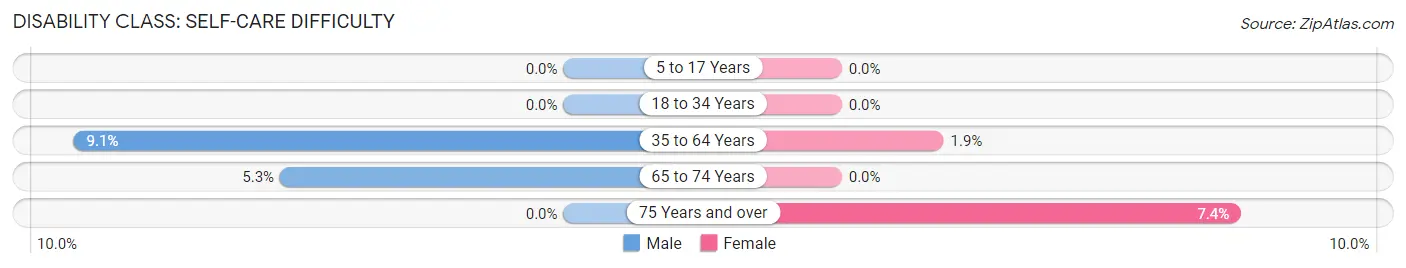
| Age Bracket | Male | Female |
| 5 to 17 Years | 0 (0.0%) | 0 (0.0%) |
| 18 to 34 Years | 0 (0.0%) | 0 (0.0%) |
| 35 to 64 Years | 3 (9.1%) | 1 (1.9%) |
| 65 to 74 Years | 1 (5.3%) | 0 (0.0%) |
| 75 Years and over | 0 (0.0%) | 2 (7.4%) |
Technology Access in East Thermopolis
Computing Device Access in East Thermopolis
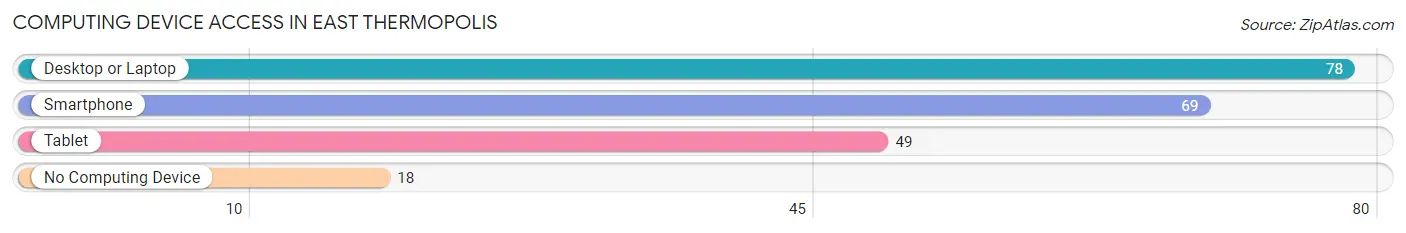
| Device Type | # Households | % Households |
| Desktop or Laptop | 78 | 63.4% |
| Smartphone | 69 | 56.1% |
| Tablet | 49 | 39.8% |
| No Computing Device | 18 | 14.6% |
| Total | 123 | 100.0% |
Internet Access in East Thermopolis
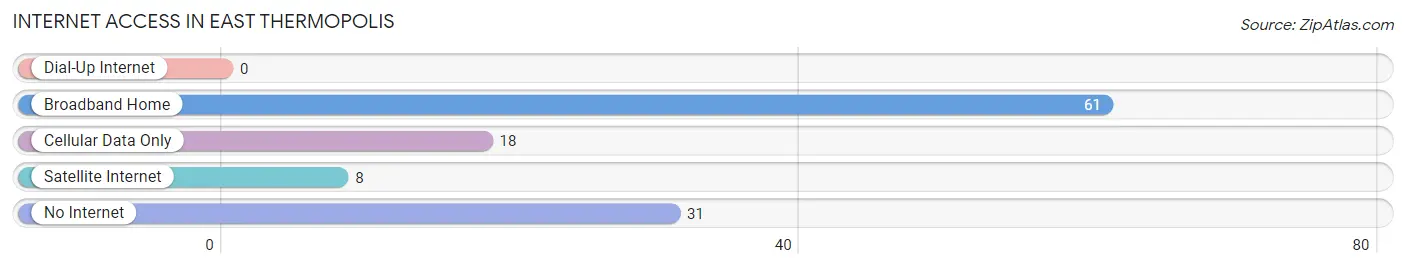
| Internet Type | # Households | % Households |
| Dial-Up Internet | 0 | 0.0% |
| Broadband Home | 61 | 49.6% |
| Cellular Data Only | 18 | 14.6% |
| Satellite Internet | 8 | 6.5% |
| No Internet | 31 | 25.2% |
| Total | 123 | 100.0% |
East Thermopolis Summary
Thermopolis, Wyoming is a small town located in the Big Horn Basin of Hot Springs County in the northwest corner of the state. It is the county seat and the largest town in the county. The town is situated on the banks of the Big Horn River and is surrounded by the Big Horn Mountains. The town is known for its hot springs, which are the largest in the world and attract visitors from all over the world.
History
The area around Thermopolis has been inhabited for thousands of years by Native American tribes, including the Shoshone, Arapaho, and Crow. The first Europeans to visit the area were fur trappers in the early 1800s. The town was founded in 1883 by the Union Pacific Railroad and was named after the hot springs in the area. The town quickly grew and by the early 1900s, it was a bustling center of commerce and industry.
The town was also home to a number of famous people, including Buffalo Bill Cody, who owned a ranch nearby. The town was also the site of the first rodeo in the United States in 1897.
Geography
Thermopolis is located in the Big Horn Basin of Hot Springs County in the northwest corner of the state. It is situated on the banks of the Big Horn River and is surrounded by the Big Horn Mountains. The town is located at an elevation of 4,400 feet and has a total area of 2.2 square miles. The climate is semi-arid with hot summers and cold winters.
Economy
The economy of Thermopolis is largely based on tourism, with the hot springs being the main attraction. The town is also home to a number of businesses, including restaurants, hotels, and retail stores. The town is also home to a number of manufacturing companies, including a cheese factory and a wood products plant.
Demographics
As of the 2010 census, the population of Thermopolis was 2,845. The racial makeup of the town was 95.3% White, 0.3% African American, 0.7% Native American, 0.3% Asian, 0.1% Pacific Islander, 1.2% from other races, and 2.3% from two or more races. The median household income was $37,917 and the median family income was $45,625. The per capita income was $20,845.
Conclusion
Thermopolis, Wyoming is a small town located in the Big Horn Basin of Hot Springs County in the northwest corner of the state. It is the county seat and the largest town in the county. The town is known for its hot springs, which are the largest in the world and attract visitors from all over the world. The economy of the town is largely based on tourism, with the hot springs being the main attraction. The population of the town is 2,845 and the median household income is $37,917.
Common Questions
What is Per Capita Income in East Thermopolis?
Per Capita income in East Thermopolis is $27,249.
What is the Median Family Income in East Thermopolis?
Median Family Income in East Thermopolis is $66,250.
What is the Median Household income in East Thermopolis?
Median Household Income in East Thermopolis is $25,625.
What is Inequality or Gini Index in East Thermopolis?
Inequality or Gini Index in East Thermopolis is 0.50.
What is the Total Population of East Thermopolis?
Total Population of East Thermopolis is 198.
What is the Total Male Population of East Thermopolis?
Total Male Population of East Thermopolis is 93.
What is the Total Female Population of East Thermopolis?
Total Female Population of East Thermopolis is 105.
What is the Ratio of Males per 100 Females in East Thermopolis?
There are 88.57 Males per 100 Females in East Thermopolis.
What is the Ratio of Females per 100 Males in East Thermopolis?
There are 112.90 Females per 100 Males in East Thermopolis.
What is the Median Population Age in East Thermopolis?
Median Population Age in East Thermopolis is 58.3 Years.
What is the Average Family Size in East Thermopolis
Average Family Size in East Thermopolis is 2.9 People.
What is the Average Household Size in East Thermopolis
Average Household Size in East Thermopolis is 1.6 People.
How Large is the Labor Force in East Thermopolis?
There are 75 People in the Labor Forcein in East Thermopolis.
What is the Percentage of People in the Labor Force in East Thermopolis?
41.4% of People are in the Labor Force in East Thermopolis.