Bear River, WY Map & Demographics
Bear River Map
Bear River Overview
$31,421
PER CAPITA INCOME
$114,758
AVG FAMILY INCOME
$105,625
AVG HOUSEHOLD INCOME
56.6%
WAGE / INCOME GAP [ % ]
43.4¢/ $1
WAGE / INCOME GAP [ $ ]
0.25
INEQUALITY / GINI INDEX
873
TOTAL POPULATION
414
MALE POPULATION
459
FEMALE POPULATION
90.20
MALES / 100 FEMALES
110.87
FEMALES / 100 MALES
35.0
MEDIAN AGE
3.4
AVG FAMILY SIZE
3.0
AVG HOUSEHOLD SIZE
399
LABOR FORCE [ PEOPLE ]
61.5%
PERCENT IN LABOR FORCE
2.3%
UNEMPLOYMENT RATE
Bear River Area Codes
Income in Bear River
Income Overview in Bear River
Per Capita Income in Bear River is $31,421, while median incomes of families and households are $114,758 and $105,625 respectively.
| Characteristic | Number | Measure |
| Per Capita Income | 873 | $31,421 |
| Median Family Income | 230 | $114,758 |
| Mean Family Income | 230 | $115,520 |
| Median Household Income | 291 | $105,625 |
| Mean Household Income | 291 | $102,030 |
| Income Deficit | 230 | $0 |
| Wage / Income Gap (%) | 873 | 56.60% |
| Wage / Income Gap ($) | 873 | 43.40¢ per $1 |
| Gini / Inequality Index | 873 | 0.25 |
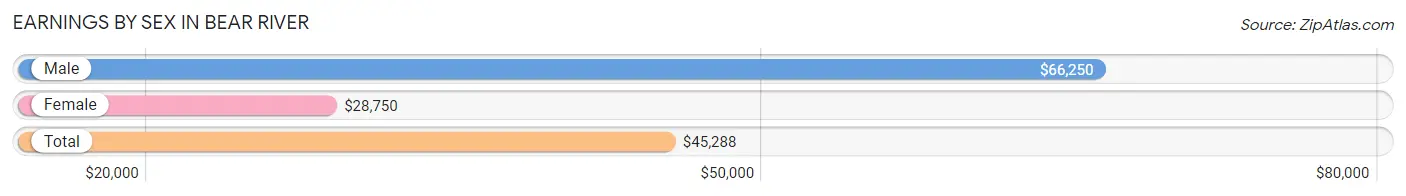
Earnings by Sex in Bear River
Average Earnings in Bear River are $45,288, $66,250 for men and $28,750 for women, a difference of 56.6%.
| Sex | Number | Average Earnings |
| Male | 206 (44.5%) | $66,250 |
| Female | 257 (55.5%) | $28,750 |
| Total | 463 (100.0%) | $45,288 |
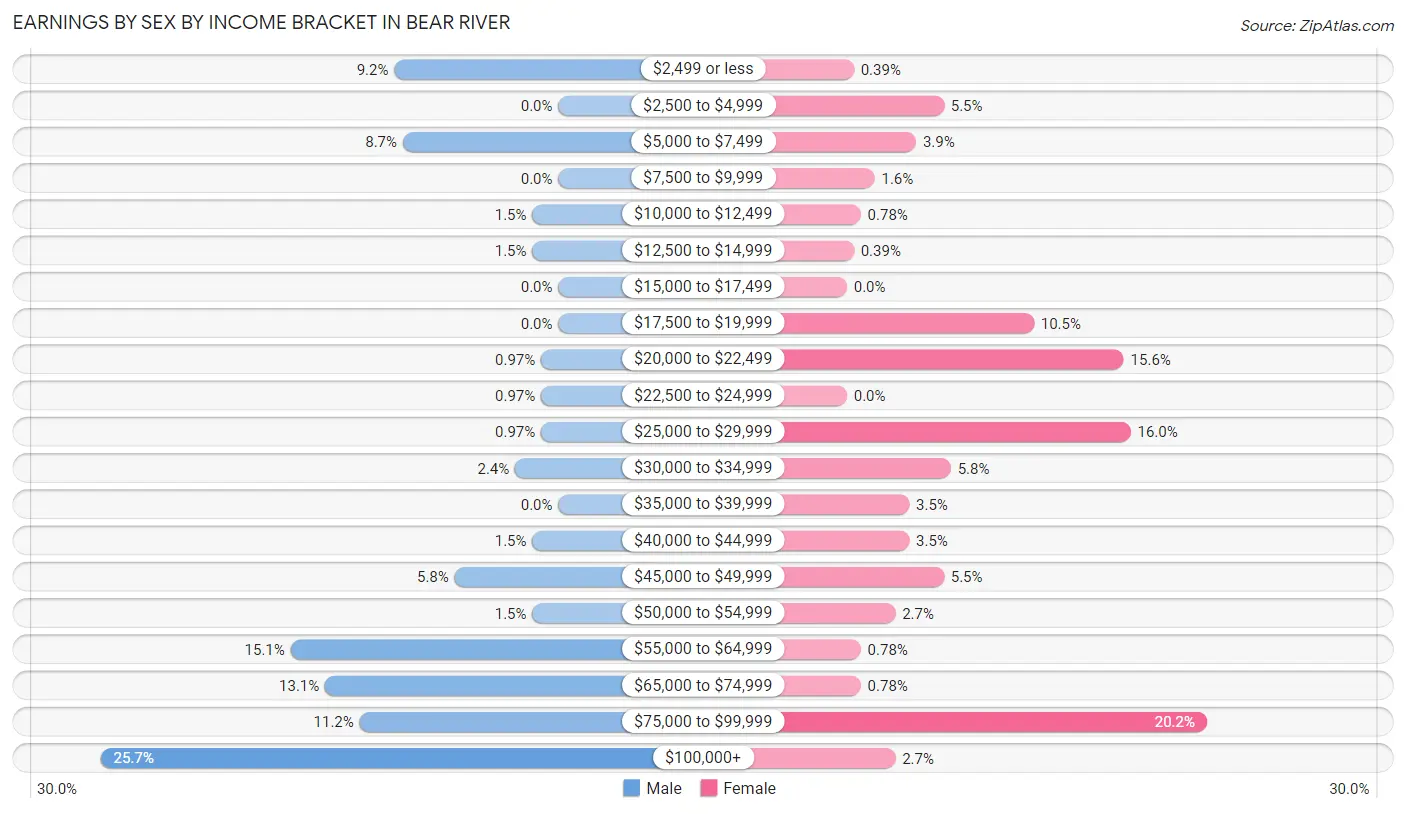
Earnings by Sex by Income Bracket in Bear River
The most common earnings brackets in Bear River are $100,000+ for men (53 | 25.7%) and $75,000 to $99,999 for women (52 | 20.2%).
| Income | Male | Female |
| $2,499 or less | 19 (9.2%) | 1 (0.4%) |
| $2,500 to $4,999 | 0 (0.0%) | 14 (5.4%) |
| $5,000 to $7,499 | 18 (8.7%) | 10 (3.9%) |
| $7,500 to $9,999 | 0 (0.0%) | 4 (1.6%) |
| $10,000 to $12,499 | 3 (1.5%) | 2 (0.8%) |
| $12,500 to $14,999 | 3 (1.5%) | 1 (0.4%) |
| $15,000 to $17,499 | 0 (0.0%) | 0 (0.0%) |
| $17,500 to $19,999 | 0 (0.0%) | 27 (10.5%) |
| $20,000 to $22,499 | 2 (1.0%) | 40 (15.6%) |
| $22,500 to $24,999 | 2 (1.0%) | 0 (0.0%) |
| $25,000 to $29,999 | 2 (1.0%) | 41 (16.0%) |
| $30,000 to $34,999 | 5 (2.4%) | 15 (5.8%) |
| $35,000 to $39,999 | 0 (0.0%) | 9 (3.5%) |
| $40,000 to $44,999 | 3 (1.5%) | 9 (3.5%) |
| $45,000 to $49,999 | 12 (5.8%) | 14 (5.4%) |
| $50,000 to $54,999 | 3 (1.5%) | 7 (2.7%) |
| $55,000 to $64,999 | 31 (15.0%) | 2 (0.8%) |
| $65,000 to $74,999 | 27 (13.1%) | 2 (0.8%) |
| $75,000 to $99,999 | 23 (11.2%) | 52 (20.2%) |
| $100,000+ | 53 (25.7%) | 7 (2.7%) |
| Total | 206 (100.0%) | 257 (100.0%) |
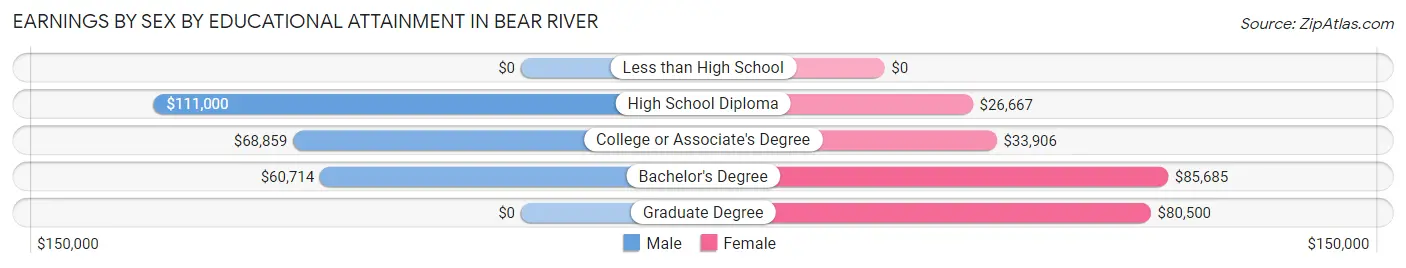
Earnings by Sex by Educational Attainment in Bear River
Average earnings in Bear River are $69,087 for men and $38,750 for women, a difference of 43.9%. Men with an educational attainment of high school diploma enjoy the highest average annual earnings of $111,000, while those with bachelor's degree education earn the least with $60,714. Women with an educational attainment of bachelor's degree earn the most with the average annual earnings of $85,685, while those with high school diploma education have the smallest earnings of $26,667.
| Educational Attainment | Male Income | Female Income |
| Less than High School | - | - |
| High School Diploma | $111,000 | $26,667 |
| College or Associate's Degree | $68,859 | $33,906 |
| Bachelor's Degree | $60,714 | $85,685 |
| Graduate Degree | - | - |
| Total | $69,087 | $38,750 |
Family Income in Bear River
Family Income Brackets in Bear River
According to the Bear River family income data, there are 89 families falling into the $100,000 to $149,999 income range, which is the most common income bracket and makes up 38.7% of all families.
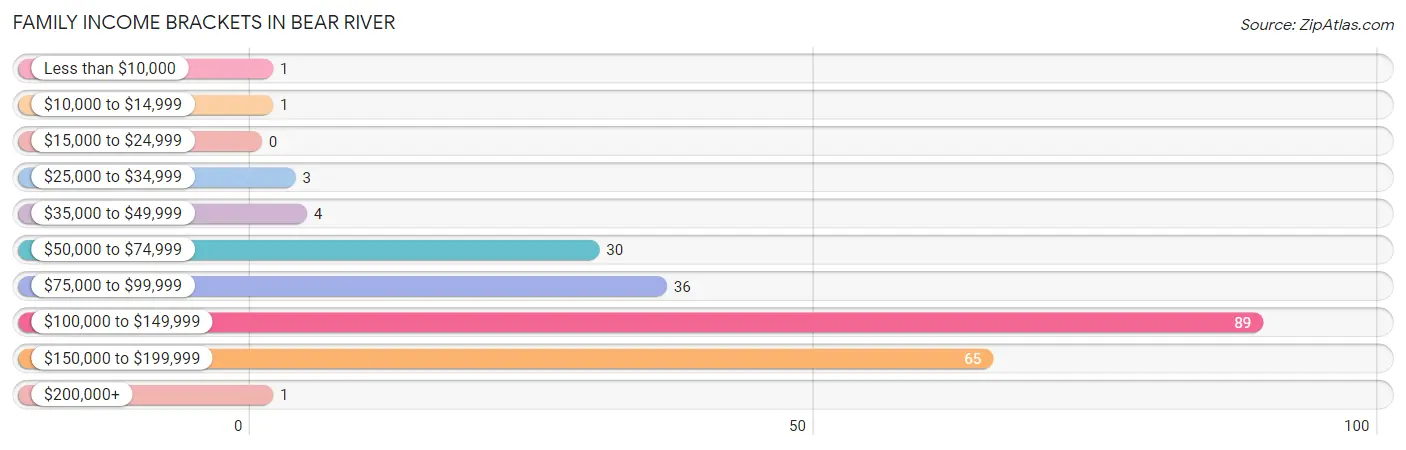
| Income Bracket | # Families | % Families |
| Less than $10,000 | 1 | 0.4% |
| $10,000 to $14,999 | 1 | 0.4% |
| $15,000 to $24,999 | 0 | 0.0% |
| $25,000 to $34,999 | 3 | 1.3% |
| $35,000 to $49,999 | 4 | 1.7% |
| $50,000 to $74,999 | 30 | 13.0% |
| $75,000 to $99,999 | 36 | 15.7% |
| $100,000 to $149,999 | 89 | 38.7% |
| $150,000 to $199,999 | 65 | 28.3% |
| $200,000+ | 1 | 0.4% |
Family Income by Famaliy Size in Bear River
4-person families (67 | 29.1%) account for the highest median family income in Bear River with $142,596 per family, while 2-person families (104 | 45.2%) have the highest median income of $56,250 per family member.
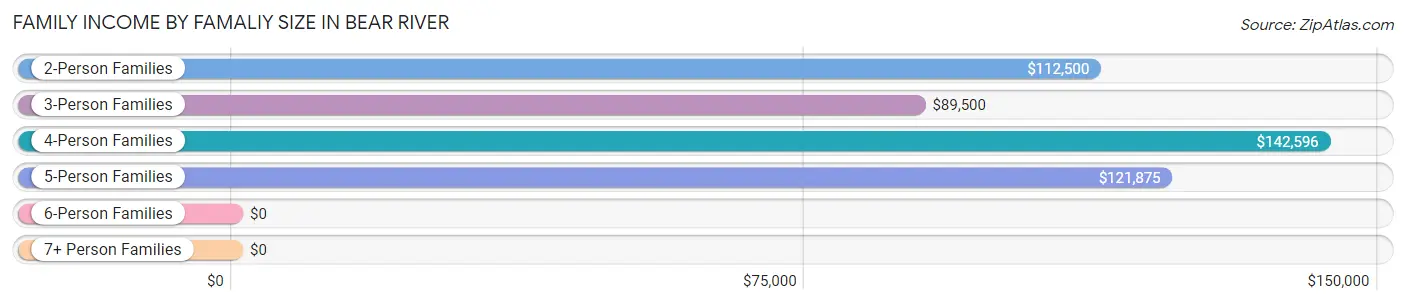
| Income Bracket | # Families | Median Income |
| 2-Person Families | 104 (45.2%) | $112,500 |
| 3-Person Families | 32 (13.9%) | $89,500 |
| 4-Person Families | 67 (29.1%) | $142,596 |
| 5-Person Families | 12 (5.2%) | $121,875 |
| 6-Person Families | 2 (0.9%) | $0 |
| 7+ Person Families | 13 (5.7%) | $0 |
| Total | 230 (100.0%) | $114,758 |
Family Income by Number of Earners in Bear River
The median family income in Bear River is $114,758, with families comprising 3+ earners (34) having the highest median family income of $165,595, while families with no earners (17) have the lowest median family income of $62,083, accounting for 14.8% and 7.4% of families, respectively.
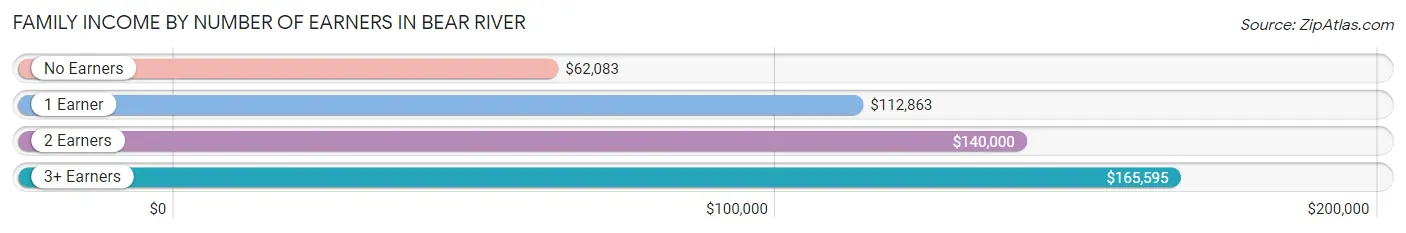
| Number of Earners | # Families | Median Income |
| No Earners | 17 (7.4%) | $62,083 |
| 1 Earner | 63 (27.4%) | $112,863 |
| 2 Earners | 116 (50.4%) | $140,000 |
| 3+ Earners | 34 (14.8%) | $165,595 |
| Total | 230 (100.0%) | $114,758 |
Household Income in Bear River
Household Income Brackets in Bear River
With 94 households falling in the category, the $100,000 to $149,999 income range is the most frequent in Bear River, accounting for 32.3% of all households. In contrast, only 1 households (0.3%) fall into the $200,000+ income bracket, making it the least populous group.
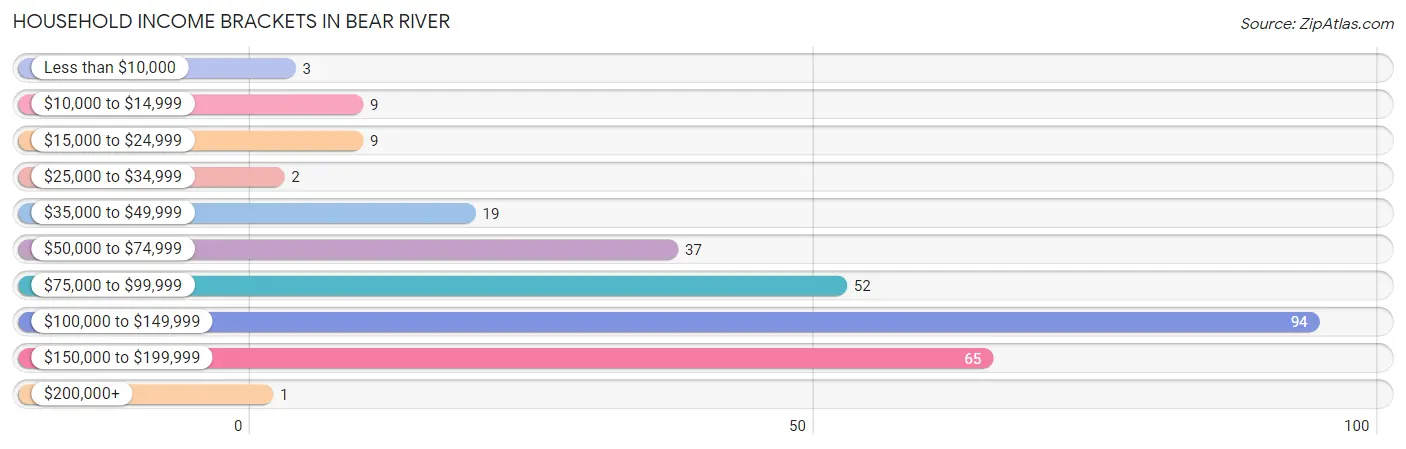
| Income Bracket | # Households | % Households |
| Less than $10,000 | 3 | 1.0% |
| $10,000 to $14,999 | 9 | 3.1% |
| $15,000 to $24,999 | 9 | 3.1% |
| $25,000 to $34,999 | 2 | 0.7% |
| $35,000 to $49,999 | 19 | 6.5% |
| $50,000 to $74,999 | 37 | 12.7% |
| $75,000 to $99,999 | 52 | 17.9% |
| $100,000 to $149,999 | 94 | 32.3% |
| $150,000 to $199,999 | 65 | 22.3% |
| $200,000+ | 1 | 0.3% |
Household Income by Householder Age in Bear River
The median household income in Bear River is $105,625, with the highest median household income of $121,094 found in the 45 to 64 years age bracket for the primary householder. A total of 141 households (48.4%) fall into this category. Meanwhile, the 65+ years age bracket for the primary householder has the lowest median household income of $53,750, with 54 households (18.6%) in this group.
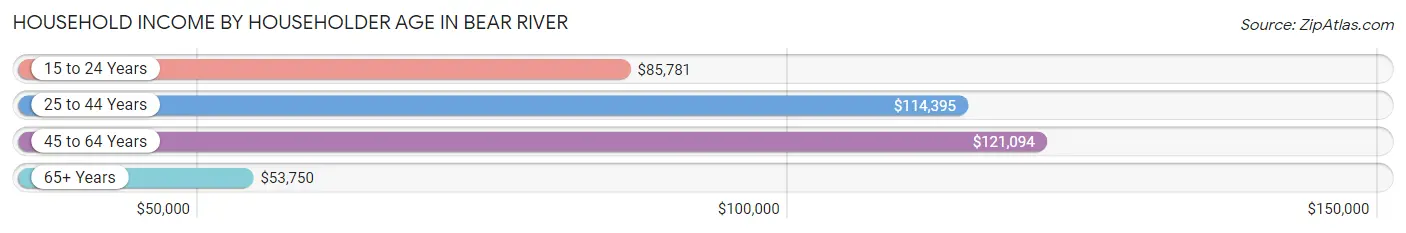
| Income Bracket | # Households | Median Income |
| 15 to 24 Years | 15 (5.1%) | $85,781 |
| 25 to 44 Years | 81 (27.8%) | $114,395 |
| 45 to 64 Years | 141 (48.4%) | $121,094 |
| 65+ Years | 54 (18.6%) | $53,750 |
| Total | 291 (100.0%) | $105,625 |
Poverty in Bear River
Income Below Poverty by Sex and Age in Bear River
With 4.3% poverty level for males and 4.6% for females among the residents of Bear River, 75 year old and over males and 65 to 74 year old females are the most vulnerable to poverty, with 2 males (33.3%) and 7 females (15.2%) in their respective age groups living below the poverty level.
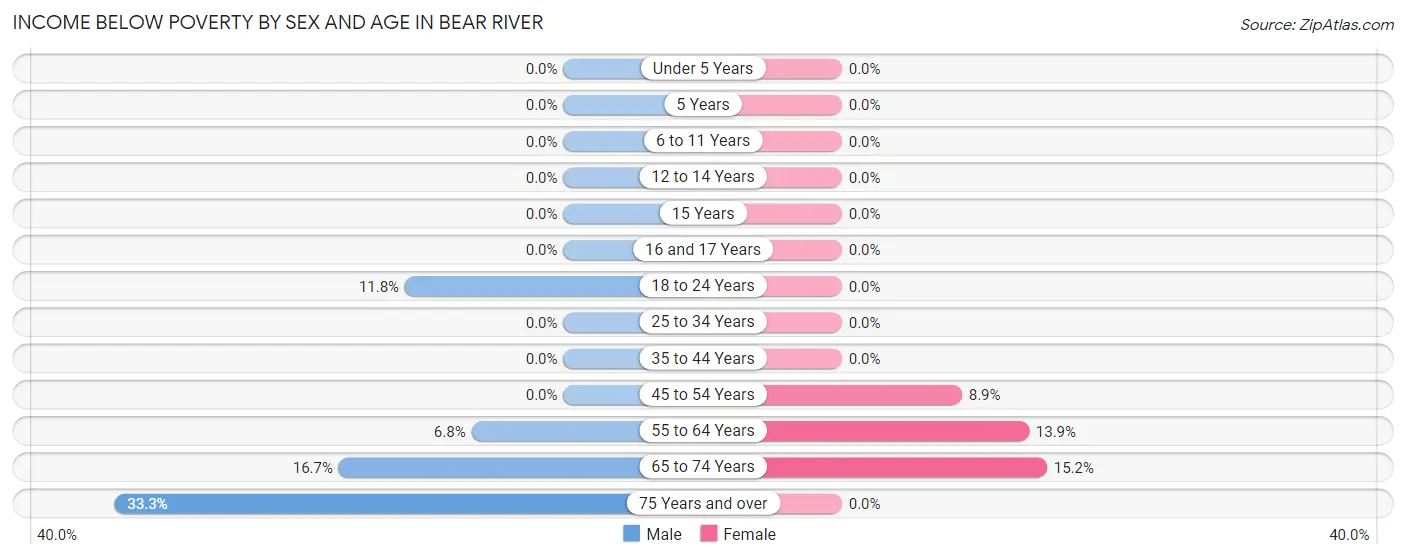
| Age Bracket | Male | Female |
| Under 5 Years | 0 (0.0%) | 0 (0.0%) |
| 5 Years | 0 (0.0%) | 0 (0.0%) |
| 6 to 11 Years | 0 (0.0%) | 0 (0.0%) |
| 12 to 14 Years | 0 (0.0%) | 0 (0.0%) |
| 15 Years | 0 (0.0%) | 0 (0.0%) |
| 16 and 17 Years | 0 (0.0%) | 0 (0.0%) |
| 18 to 24 Years | 6 (11.8%) | 0 (0.0%) |
| 25 to 34 Years | 0 (0.0%) | 0 (0.0%) |
| 35 to 44 Years | 0 (0.0%) | 0 (0.0%) |
| 45 to 54 Years | 0 (0.0%) | 9 (8.9%) |
| 55 to 64 Years | 3 (6.8%) | 5 (13.9%) |
| 65 to 74 Years | 7 (16.7%) | 7 (15.2%) |
| 75 Years and over | 2 (33.3%) | 0 (0.0%) |
| Total | 18 (4.3%) | 21 (4.6%) |
Income Above Poverty by Sex and Age in Bear River
According to the poverty statistics in Bear River, males aged under 5 years and females aged under 5 years are the age groups that are most secure financially, with 100.0% of males and 100.0% of females in these age groups living above the poverty line.
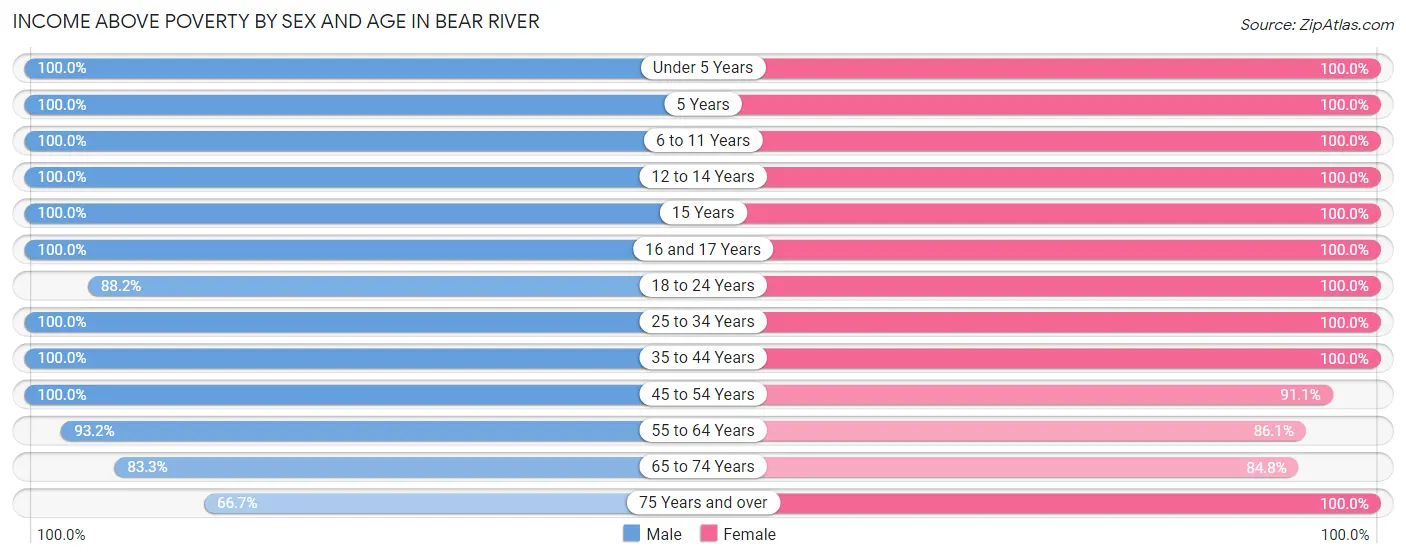
| Age Bracket | Male | Female |
| Under 5 Years | 1 (100.0%) | 15 (100.0%) |
| 5 Years | 1 (100.0%) | 52 (100.0%) |
| 6 to 11 Years | 92 (100.0%) | 11 (100.0%) |
| 12 to 14 Years | 23 (100.0%) | 12 (100.0%) |
| 15 Years | 14 (100.0%) | 3 (100.0%) |
| 16 and 17 Years | 22 (100.0%) | 15 (100.0%) |
| 18 to 24 Years | 45 (88.2%) | 77 (100.0%) |
| 25 to 34 Years | 6 (100.0%) | 41 (100.0%) |
| 35 to 44 Years | 55 (100.0%) | 46 (100.0%) |
| 45 to 54 Years | 57 (100.0%) | 92 (91.1%) |
| 55 to 64 Years | 41 (93.2%) | 31 (86.1%) |
| 65 to 74 Years | 35 (83.3%) | 39 (84.8%) |
| 75 Years and over | 4 (66.7%) | 4 (100.0%) |
| Total | 396 (95.7%) | 438 (95.4%) |
Income Below Poverty Among Married-Couple Families in Bear River
The poverty statistics for married-couple families in Bear River show that 0.9% or 2 of the total 216 families live below the poverty line. Families with no children have the highest poverty rate of 1.6%, comprising of 2 families. On the other hand, families with 1 or 2 children have the lowest poverty rate of 0.0%, which includes 0 families.
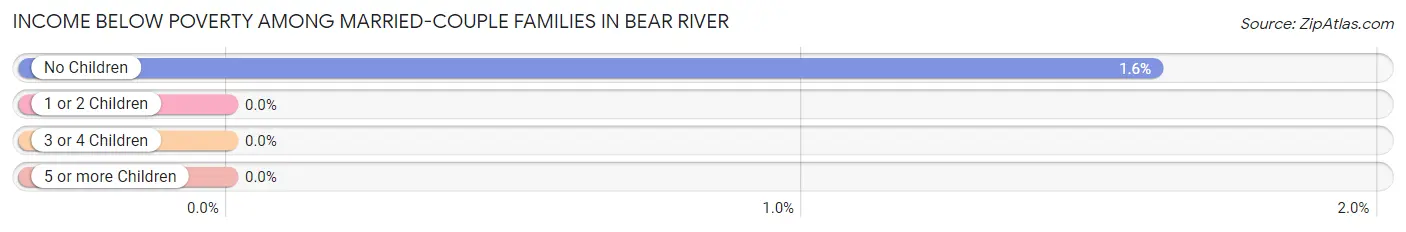
| Children | Above Poverty | Below Poverty |
| No Children | 122 (98.4%) | 2 (1.6%) |
| 1 or 2 Children | 74 (100.0%) | 0 (0.0%) |
| 3 or 4 Children | 5 (100.0%) | 0 (0.0%) |
| 5 or more Children | 13 (100.0%) | 0 (0.0%) |
| Total | 214 (99.1%) | 2 (0.9%) |
Income Below Poverty Among Single-Parent Households in Bear River
| Children | Single Father | Single Mother |
| No Children | 0 (0.0%) | 0 (0.0%) |
| 1 or 2 Children | 0 (0.0%) | 0 (0.0%) |
| 3 or 4 Children | 0 (0.0%) | 0 (0.0%) |
| 5 or more Children | 0 (0.0%) | 0 (0.0%) |
| Total | 0 (0.0%) | 0 (0.0%) |
Income Below Poverty Among Married-Couple vs Single-Parent Households in Bear River
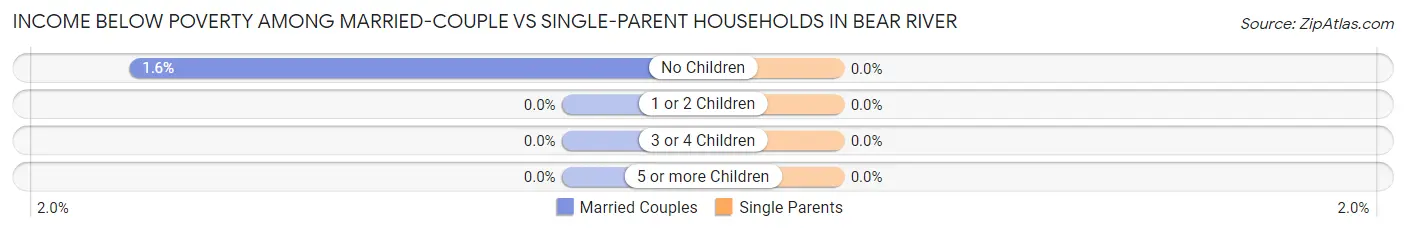
| Children | Married-Couple Families | Single-Parent Households |
| No Children | 2 (1.6%) | 0 (0.0%) |
| 1 or 2 Children | 0 (0.0%) | 0 (0.0%) |
| 3 or 4 Children | 0 (0.0%) | 0 (0.0%) |
| 5 or more Children | 0 (0.0%) | 0 (0.0%) |
| Total | 2 (0.9%) | 0 (0.0%) |
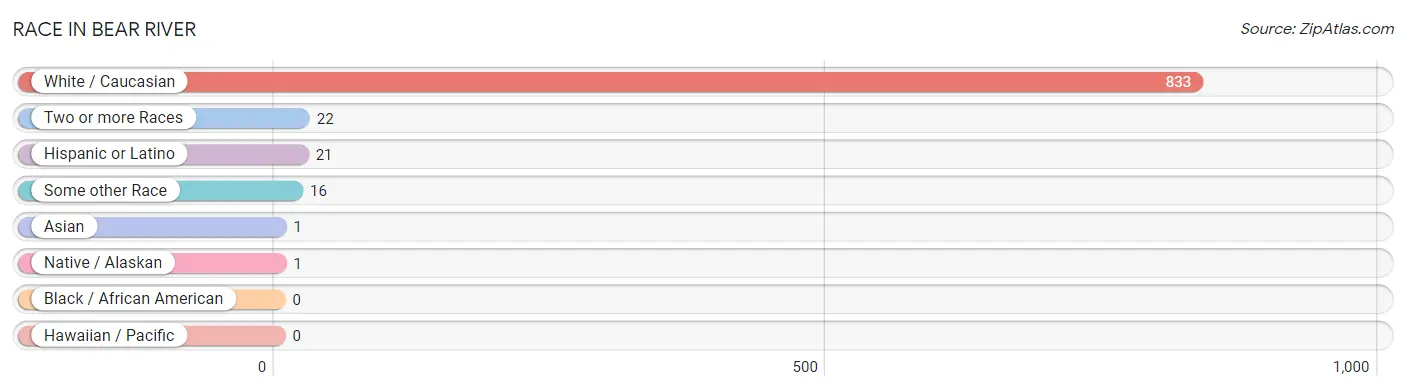
Race in Bear River
The most populous races in Bear River are White / Caucasian (833 | 95.4%), Two or more Races (22 | 2.5%), and Hispanic or Latino (21 | 2.4%).
| Race | # Population | % Population |
| Asian | 1 | 0.1% |
| Black / African American | 0 | 0.0% |
| Hawaiian / Pacific | 0 | 0.0% |
| Hispanic or Latino | 21 | 2.4% |
| Native / Alaskan | 1 | 0.1% |
| White / Caucasian | 833 | 95.4% |
| Two or more Races | 22 | 2.5% |
| Some other Race | 16 | 1.8% |
| Total | 873 | 100.0% |
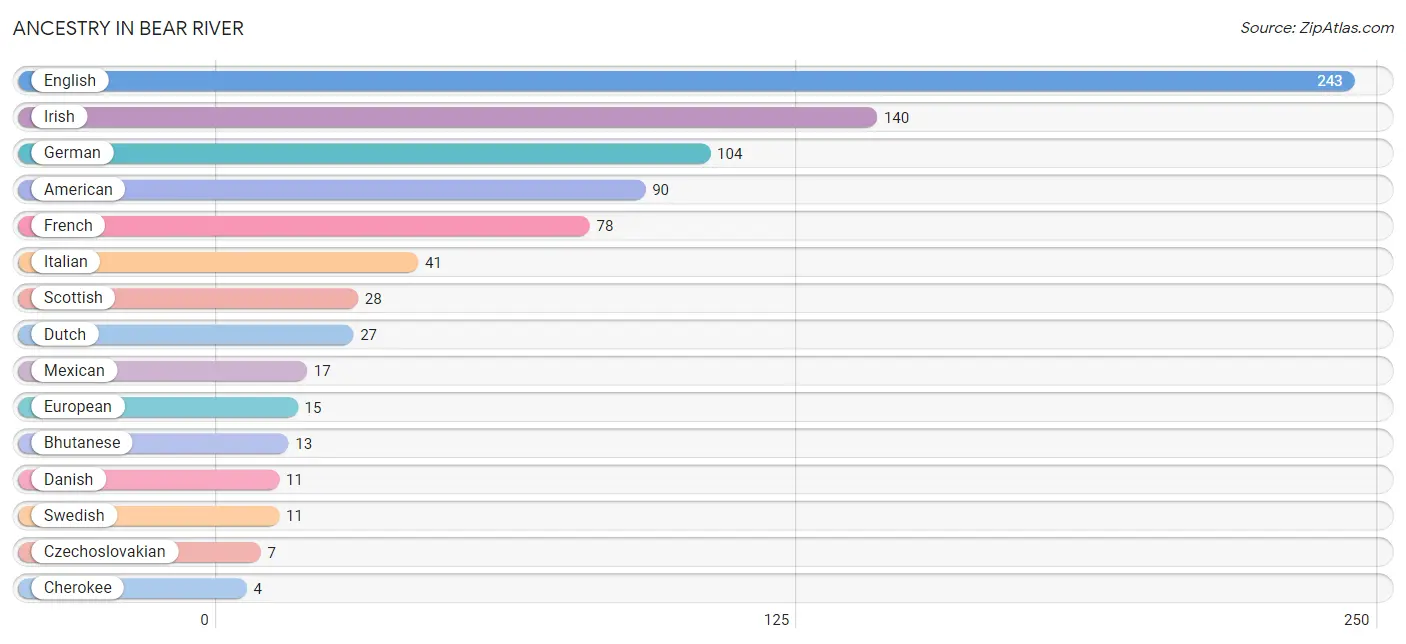
Ancestry in Bear River
The most populous ancestries reported in Bear River are English (243 | 27.8%), Irish (140 | 16.0%), German (104 | 11.9%), American (90 | 10.3%), and French (78 | 8.9%), together accounting for 75.0% of all Bear River residents.
| Ancestry | # Population | % Population |
| American | 90 | 10.3% |
| Apache | 3 | 0.3% |
| Arab | 1 | 0.1% |
| Bhutanese | 13 | 1.5% |
| Cherokee | 4 | 0.5% |
| Czechoslovakian | 7 | 0.8% |
| Danish | 11 | 1.3% |
| Dutch | 27 | 3.1% |
| English | 243 | 27.8% |
| European | 15 | 1.7% |
| Finnish | 3 | 0.3% |
| French | 78 | 8.9% |
| German | 104 | 11.9% |
| Greek | 3 | 0.3% |
| Hungarian | 1 | 0.1% |
| Icelander | 2 | 0.2% |
| Irish | 140 | 16.0% |
| Iroquois | 1 | 0.1% |
| Italian | 41 | 4.7% |
| Korean | 2 | 0.2% |
| Mexican | 17 | 1.9% |
| Moroccan | 1 | 0.1% |
| Norwegian | 4 | 0.5% |
| Puerto Rican | 2 | 0.2% |
| Scandinavian | 3 | 0.3% |
| Scotch-Irish | 4 | 0.5% |
| Scottish | 28 | 3.2% |
| Sioux | 1 | 0.1% |
| Spaniard | 1 | 0.1% |
| Spanish | 1 | 0.1% |
| Swedish | 11 | 1.3% |
| Welsh | 2 | 0.2% |
| Yugoslavian | 1 | 0.1% | View All 33 Rows |
Immigrants in Bear River
The most numerous immigrant groups reported in Bear River came from Central America (7 | 0.8%), Latin America (7 | 0.8%), Mexico (7 | 0.8%), Asia (1 | 0.1%), and Philippines (1 | 0.1%), together accounting for 2.6% of all Bear River residents.
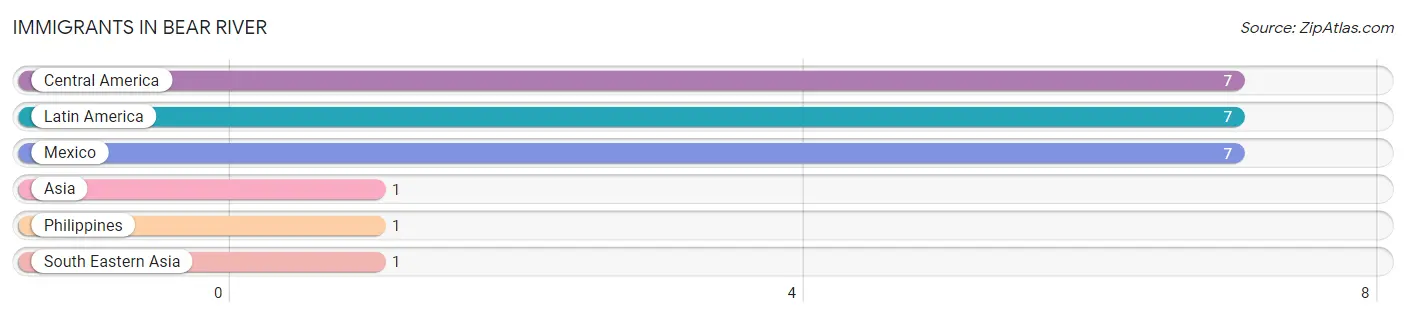
| Immigration Origin | # Population | % Population |
| Asia | 1 | 0.1% |
| Central America | 7 | 0.8% |
| Latin America | 7 | 0.8% |
| Mexico | 7 | 0.8% |
| Philippines | 1 | 0.1% |
| South Eastern Asia | 1 | 0.1% | View All 6 Rows |
Sex and Age in Bear River
Sex and Age in Bear River
The most populous age groups in Bear River are 5 to 9 Years (87 | 21.0%) for men and 45 to 49 Years (75 | 16.3%) for women.
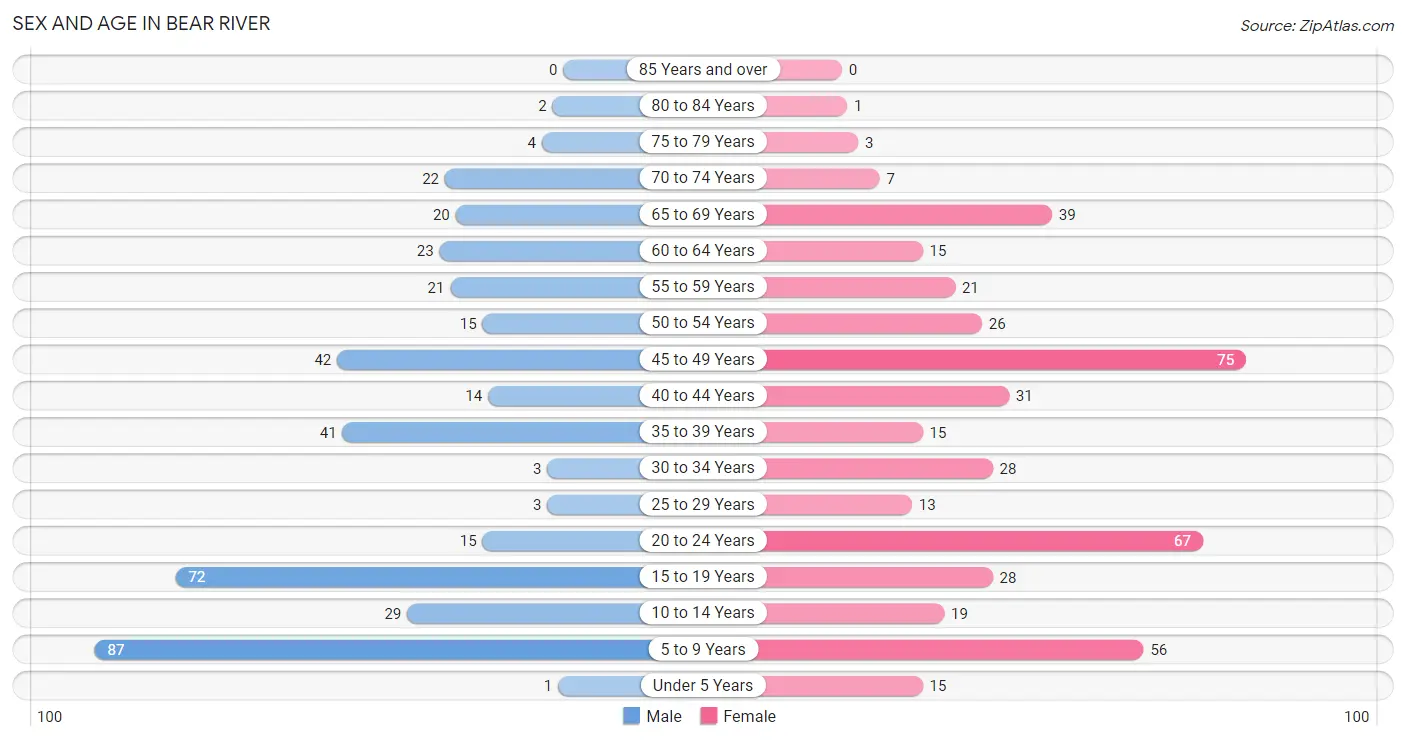
| Age Bracket | Male | Female |
| Under 5 Years | 1 (0.2%) | 15 (3.3%) |
| 5 to 9 Years | 87 (21.0%) | 56 (12.2%) |
| 10 to 14 Years | 29 (7.0%) | 19 (4.1%) |
| 15 to 19 Years | 72 (17.4%) | 28 (6.1%) |
| 20 to 24 Years | 15 (3.6%) | 67 (14.6%) |
| 25 to 29 Years | 3 (0.7%) | 13 (2.8%) |
| 30 to 34 Years | 3 (0.7%) | 28 (6.1%) |
| 35 to 39 Years | 41 (9.9%) | 15 (3.3%) |
| 40 to 44 Years | 14 (3.4%) | 31 (6.8%) |
| 45 to 49 Years | 42 (10.1%) | 75 (16.3%) |
| 50 to 54 Years | 15 (3.6%) | 26 (5.7%) |
| 55 to 59 Years | 21 (5.1%) | 21 (4.6%) |
| 60 to 64 Years | 23 (5.6%) | 15 (3.3%) |
| 65 to 69 Years | 20 (4.8%) | 39 (8.5%) |
| 70 to 74 Years | 22 (5.3%) | 7 (1.5%) |
| 75 to 79 Years | 4 (1.0%) | 3 (0.6%) |
| 80 to 84 Years | 2 (0.5%) | 1 (0.2%) |
| 85 Years and over | 0 (0.0%) | 0 (0.0%) |
| Total | 414 (100.0%) | 459 (100.0%) |
Families and Households in Bear River
Median Family Size in Bear River
The median family size in Bear River is 3.43 persons per family, with single male/father families (3 | 1.3%) accounting for the largest median family size of 6.33 persons per family. On the other hand, single female/mother families (11 | 4.8%) represent the smallest median family size with 2.45 persons per family.
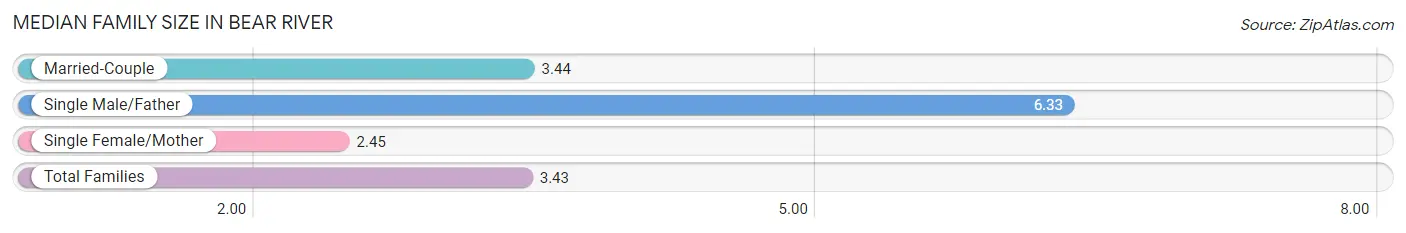
| Family Type | # Families | Family Size |
| Married-Couple | 216 (93.9%) | 3.44 |
| Single Male/Father | 3 (1.3%) | 6.33 |
| Single Female/Mother | 11 (4.8%) | 2.45 |
| Total Families | 230 (100.0%) | 3.43 |
Median Household Size in Bear River
The median household size in Bear River is 3.00 persons per household, with single male/father households (3 | 1.0%) accounting for the largest median household size of 6.33 persons per household. non-family households (61 | 21.0%) represent the smallest median household size with 1.30 persons per household.
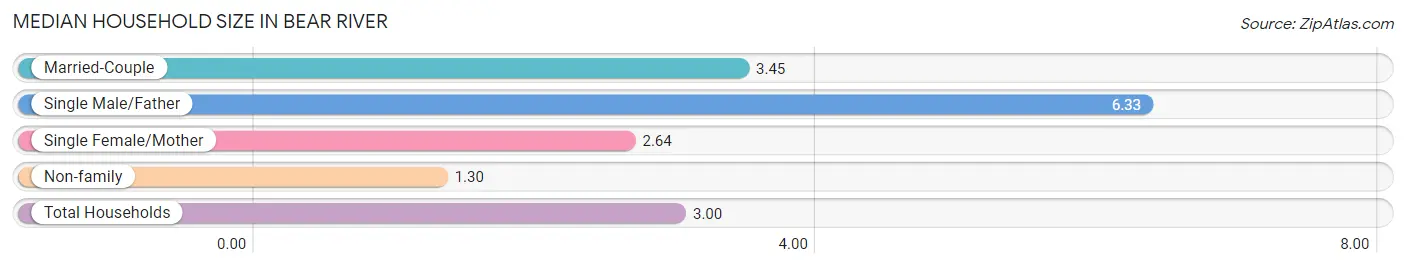
| Household Type | # Households | Household Size |
| Married-Couple | 216 (74.2%) | 3.45 |
| Single Male/Father | 3 (1.0%) | 6.33 |
| Single Female/Mother | 11 (3.8%) | 2.64 |
| Non-family | 61 (21.0%) | 1.30 |
| Total Households | 291 (100.0%) | 3.00 |
Household Size by Marriage Status in Bear River
Out of a total of 291 households in Bear River, 230 (79.0%) are family households, while 61 (21.0%) are nonfamily households. The most numerous type of family households are 2-person households, comprising 101, and the most common type of nonfamily households are 1-person households, comprising 41.
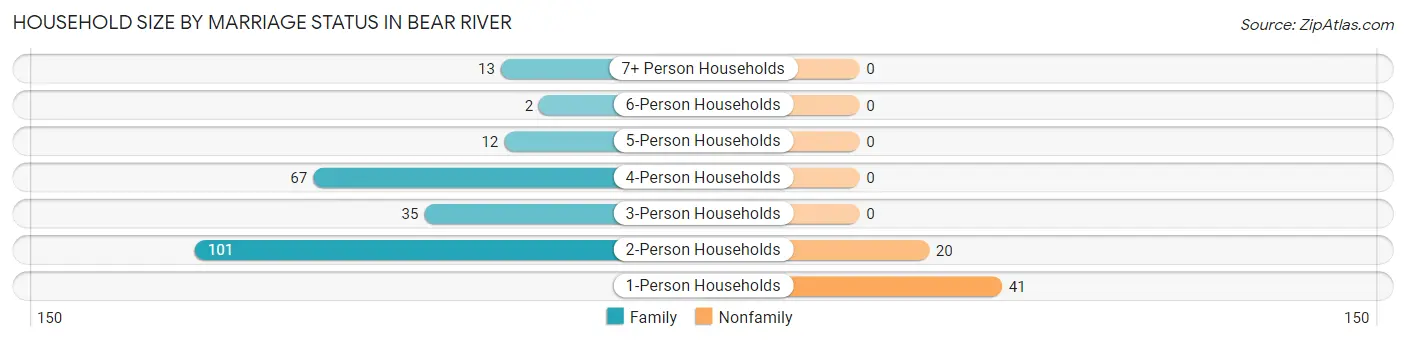
| Household Size | Family Households | Nonfamily Households |
| 1-Person Households | - | 41 (14.1%) |
| 2-Person Households | 101 (34.7%) | 20 (6.9%) |
| 3-Person Households | 35 (12.0%) | 0 (0.0%) |
| 4-Person Households | 67 (23.0%) | 0 (0.0%) |
| 5-Person Households | 12 (4.1%) | 0 (0.0%) |
| 6-Person Households | 2 (0.7%) | 0 (0.0%) |
| 7+ Person Households | 13 (4.5%) | 0 (0.0%) |
| Total | 230 (79.0%) | 61 (21.0%) |
Female Fertility in Bear River
Fertility by Age in Bear River
| Age Bracket | Women with Births | Births / 1,000 Women |
| 15 to 19 years | 0 (0.0%) | 0.0 |
| 20 to 34 years | 0 (0.0%) | 0.0 |
| 35 to 50 years | 0 (0.0%) | 0.0 |
| Total | 0 (0.0%) | 0.0 |
Fertility by Age by Marriage Status in Bear River
| Age Bracket | Married | Unmarried |
| 15 to 19 years | 0 (0.0%) | 0 (0.0%) |
| 20 to 34 years | 0 (0.0%) | 0 (0.0%) |
| 35 to 50 years | 0 (0.0%) | 0 (0.0%) |
| Total | 0 (0.0%) | 0 (0.0%) |
Fertility by Education in Bear River
| Educational Attainment | Women with Births | Births / 1,000 Women |
| Less than High School | 0 (0.0%) | 0.0 |
| High School Diploma | 0 (0.0%) | 0.0 |
| College or Associate's Degree | 0 (0.0%) | 0.0 |
| Bachelor's Degree | 0 (0.0%) | 0.0 |
| Graduate Degree | 0 (0.0%) | 0.0 |
| Total | 0 (0.0%) | 0.0 |
Fertility by Education by Marriage Status in Bear River
| Educational Attainment | Married | Unmarried |
| Less than High School | 0 (0.0%) | 0 (0.0%) |
| High School Diploma | 0 (0.0%) | 0 (0.0%) |
| College or Associate's Degree | 0 (0.0%) | 0 (0.0%) |
| Bachelor's Degree | 0 (0.0%) | 0 (0.0%) |
| Graduate Degree | 0 (0.0%) | 0 (0.0%) |
| Total | 0 (0.0%) | 0 (0.0%) |
Employment Characteristics in Bear River
Employment by Class of Employer in Bear River
Among the 382 employed individuals in Bear River, private company employees (246 | 64.4%), state government employees (38 | 10.0%), and local government employees (31 | 8.1%) make up the most common classes of employment.
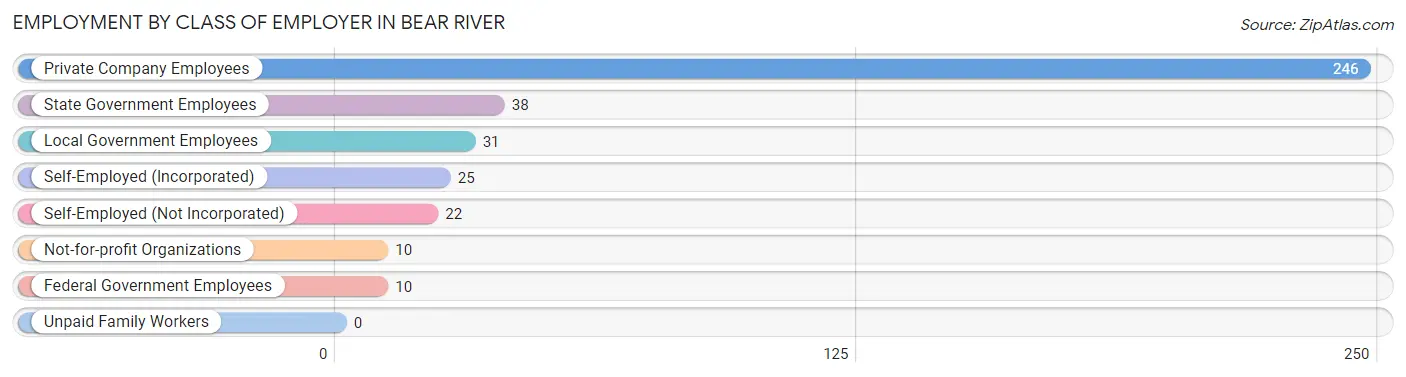
| Employer Class | # Employees | % Employees |
| Private Company Employees | 246 | 64.4% |
| Self-Employed (Incorporated) | 25 | 6.5% |
| Self-Employed (Not Incorporated) | 22 | 5.8% |
| Not-for-profit Organizations | 10 | 2.6% |
| Local Government Employees | 31 | 8.1% |
| State Government Employees | 38 | 10.0% |
| Federal Government Employees | 10 | 2.6% |
| Unpaid Family Workers | 0 | 0.0% |
| Total | 382 | 100.0% |
Employment Status by Age in Bear River
According to the labor force statistics for Bear River, out of the total population over 16 years of age (649), 61.5% or 399 individuals are in the labor force, with 2.3% or 9 of them unemployed. The age group with the highest labor force participation rate is 55 to 59 years, with 95.2% or 40 individuals in the labor force. Within the labor force, the 60 to 64 years age range has the highest percentage of unemployed individuals, with 26.3% or 5 of them being unemployed.
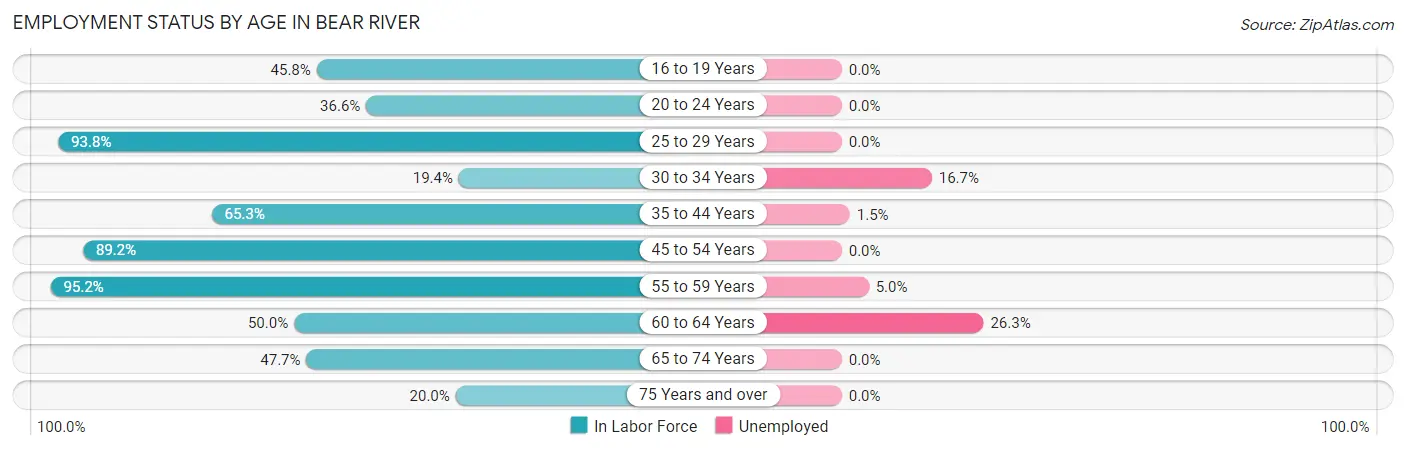
| Age Bracket | In Labor Force | Unemployed |
| 16 to 19 Years | 38 (45.8%) | 0 (0.0%) |
| 20 to 24 Years | 30 (36.6%) | 0 (0.0%) |
| 25 to 29 Years | 15 (93.8%) | 0 (0.0%) |
| 30 to 34 Years | 6 (19.4%) | 1 (16.7%) |
| 35 to 44 Years | 66 (65.3%) | 1 (1.5%) |
| 45 to 54 Years | 141 (89.2%) | 0 (0.0%) |
| 55 to 59 Years | 40 (95.2%) | 2 (5.0%) |
| 60 to 64 Years | 19 (50.0%) | 5 (26.3%) |
| 65 to 74 Years | 42 (47.7%) | 0 (0.0%) |
| 75 Years and over | 2 (20.0%) | 0 (0.0%) |
| Total | 399 (61.5%) | 9 (2.3%) |
Employment Status by Educational Attainment in Bear River
According to labor force statistics for Bear River, 74.4% of individuals (287) out of the total population between 25 and 64 years of age (386) are in the labor force, with 3.1% or 9 of them being unemployed. The group with the highest labor force participation rate are those with the educational attainment of less than high school, with 100.0% or 1 individuals in the labor force. Within the labor force, individuals with less than high school education have the highest percentage of unemployment, with 100.0% or 1 of them being unemployed.
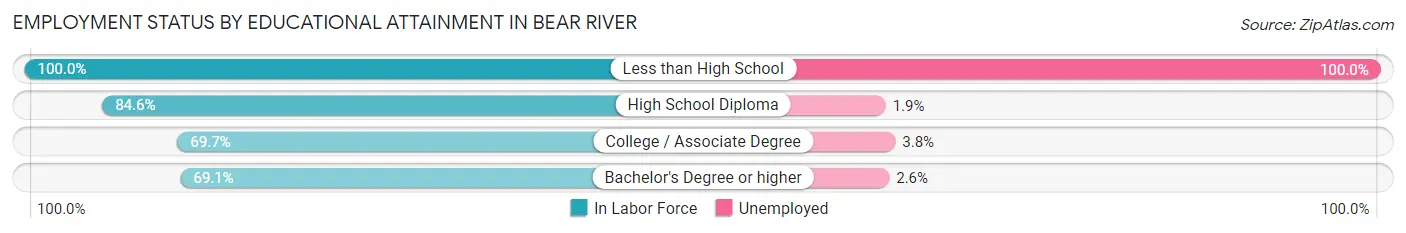
| Educational Attainment | In Labor Force | Unemployed |
| Less than High School | 1 (100.0%) | 1 (100.0%) |
| High School Diploma | 104 (84.6%) | 2 (1.9%) |
| College / Associate Degree | 106 (69.7%) | 6 (3.8%) |
| Bachelor's Degree or higher | 76 (69.1%) | 3 (2.6%) |
| Total | 287 (74.4%) | 12 (3.1%) |
Employment Occupations by Sex in Bear River
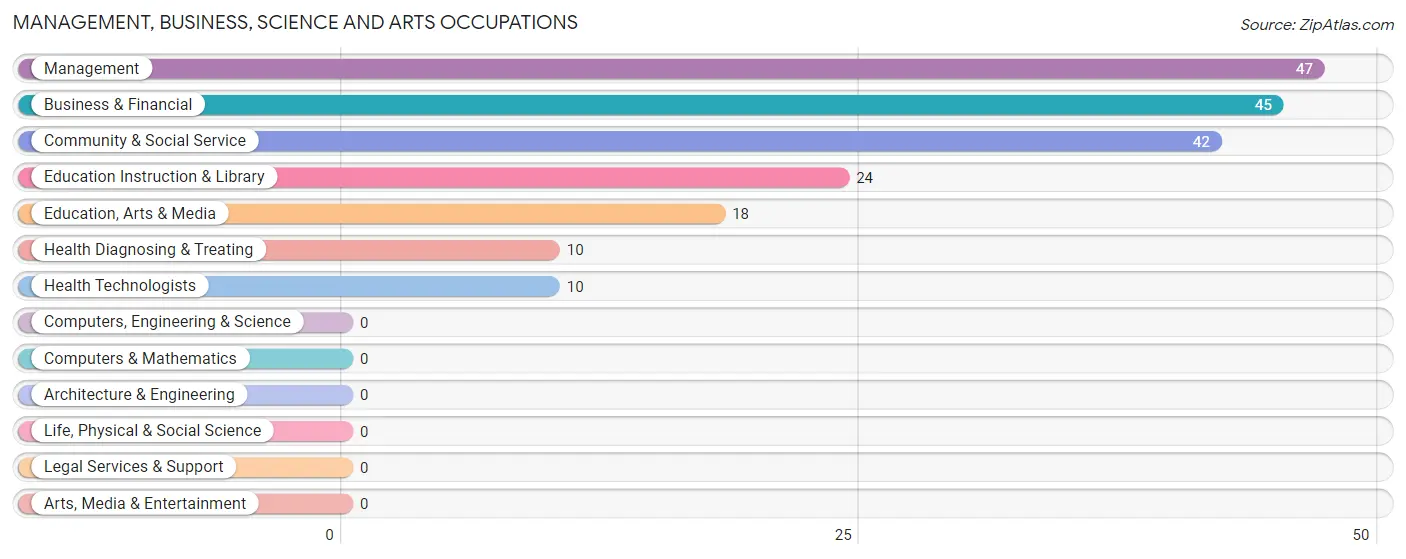
Management, Business, Science and Arts Occupations
The most common Management, Business, Science and Arts occupations in Bear River are Management (47 | 12.0%), Business & Financial (45 | 11.5%), Community & Social Service (42 | 10.8%), Education Instruction & Library (24 | 6.1%), and Education, Arts & Media (18 | 4.6%).
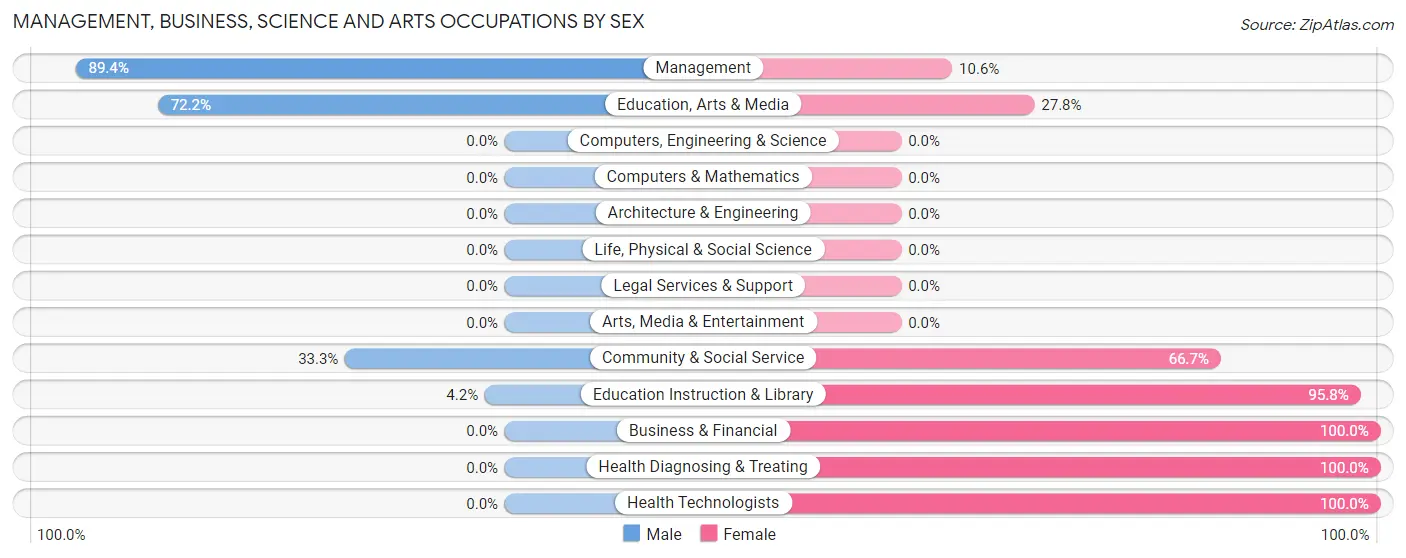
Management, Business, Science and Arts Occupations by Sex
Within the Management, Business, Science and Arts occupations in Bear River, the most male-oriented occupations are Management (89.4%), Education, Arts & Media (72.2%), and Community & Social Service (33.3%), while the most female-oriented occupations are Business & Financial (100.0%), Health Diagnosing & Treating (100.0%), and Health Technologists (100.0%).
| Occupation | Male | Female |
| Management | 42 (89.4%) | 5 (10.6%) |
| Business & Financial | 0 (0.0%) | 45 (100.0%) |
| Computers, Engineering & Science | 0 (0.0%) | 0 (0.0%) |
| Computers & Mathematics | 0 (0.0%) | 0 (0.0%) |
| Architecture & Engineering | 0 (0.0%) | 0 (0.0%) |
| Life, Physical & Social Science | 0 (0.0%) | 0 (0.0%) |
| Community & Social Service | 14 (33.3%) | 28 (66.7%) |
| Education, Arts & Media | 13 (72.2%) | 5 (27.8%) |
| Legal Services & Support | 0 (0.0%) | 0 (0.0%) |
| Education Instruction & Library | 1 (4.2%) | 23 (95.8%) |
| Arts, Media & Entertainment | 0 (0.0%) | 0 (0.0%) |
| Health Diagnosing & Treating | 0 (0.0%) | 10 (100.0%) |
| Health Technologists | 0 (0.0%) | 10 (100.0%) |
| Total (Category) | 56 (38.9%) | 88 (61.1%) |
| Total (Overall) | 197 (50.5%) | 193 (49.5%) |
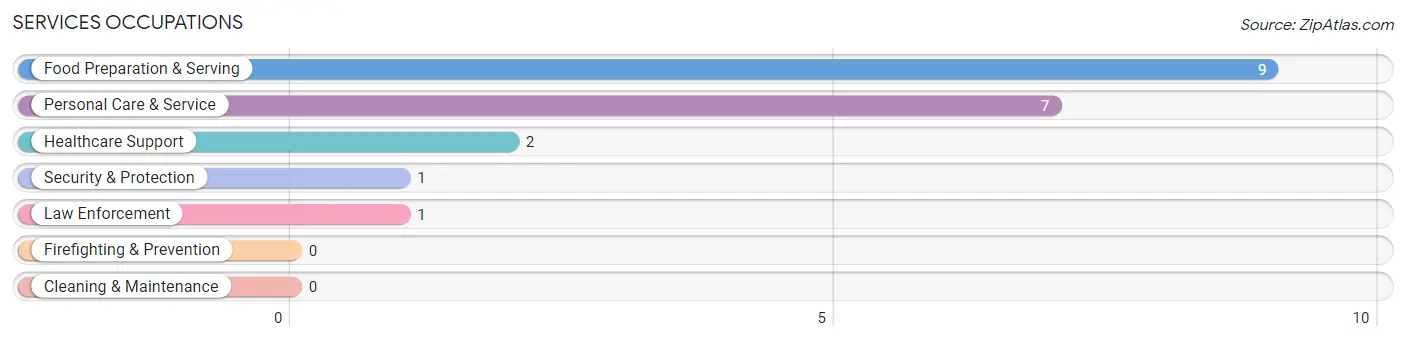
Services Occupations
The most common Services occupations in Bear River are Food Preparation & Serving (9 | 2.3%), Personal Care & Service (7 | 1.8%), Healthcare Support (2 | 0.5%), Security & Protection (1 | 0.3%), and Law Enforcement (1 | 0.3%).
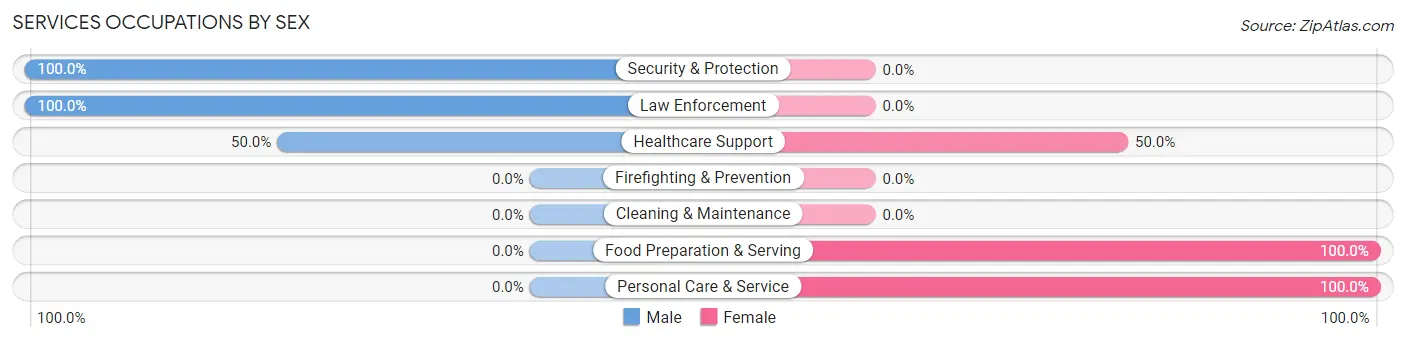
Services Occupations by Sex
Within the Services occupations in Bear River, the most male-oriented occupations are Security & Protection (100.0%), Law Enforcement (100.0%), and Healthcare Support (50.0%), while the most female-oriented occupations are Food Preparation & Serving (100.0%), Personal Care & Service (100.0%), and Healthcare Support (50.0%).
| Occupation | Male | Female |
| Healthcare Support | 1 (50.0%) | 1 (50.0%) |
| Security & Protection | 1 (100.0%) | 0 (0.0%) |
| Firefighting & Prevention | 0 (0.0%) | 0 (0.0%) |
| Law Enforcement | 1 (100.0%) | 0 (0.0%) |
| Food Preparation & Serving | 0 (0.0%) | 9 (100.0%) |
| Cleaning & Maintenance | 0 (0.0%) | 0 (0.0%) |
| Personal Care & Service | 0 (0.0%) | 7 (100.0%) |
| Total (Category) | 2 (10.5%) | 17 (89.5%) |
| Total (Overall) | 197 (50.5%) | 193 (49.5%) |
Sales and Office Occupations
The most common Sales and Office occupations in Bear River are Office & Administration (66 | 16.9%), and Sales & Related (41 | 10.5%).
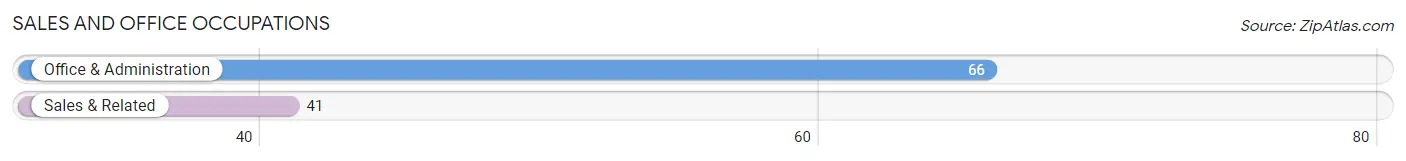
Sales and Office Occupations by Sex
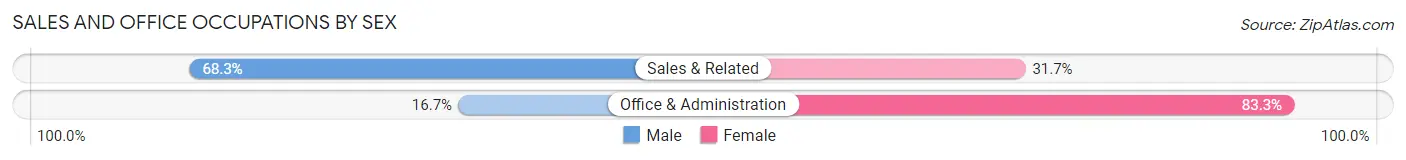
| Occupation | Male | Female |
| Sales & Related | 28 (68.3%) | 13 (31.7%) |
| Office & Administration | 11 (16.7%) | 55 (83.3%) |
| Total (Category) | 39 (36.4%) | 68 (63.5%) |
| Total (Overall) | 197 (50.5%) | 193 (49.5%) |
Natural Resources, Construction and Maintenance Occupations
The most common Natural Resources, Construction and Maintenance occupations in Bear River are Construction & Extraction (44 | 11.3%), and Installation, Maintenance & Repair (6 | 1.5%).
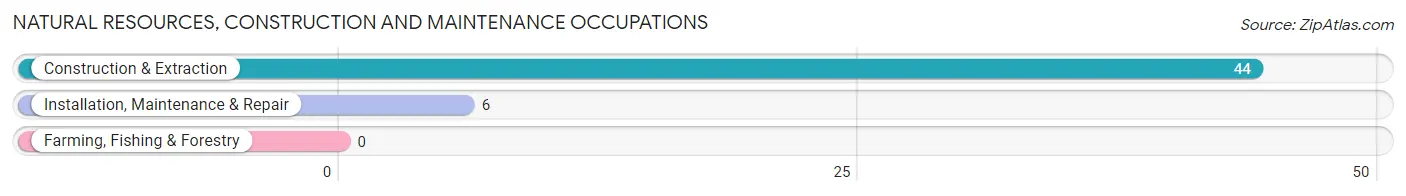
Natural Resources, Construction and Maintenance Occupations by Sex
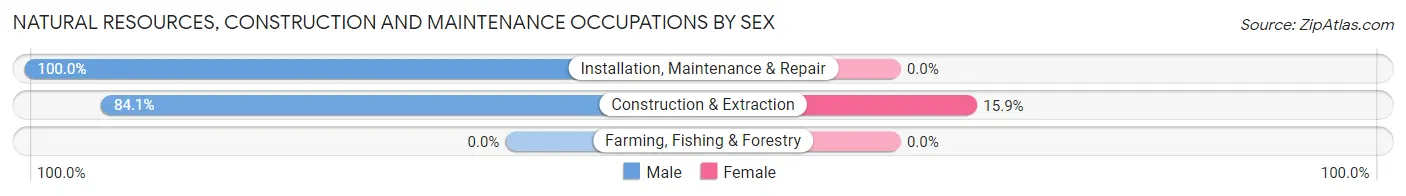
| Occupation | Male | Female |
| Farming, Fishing & Forestry | 0 (0.0%) | 0 (0.0%) |
| Construction & Extraction | 37 (84.1%) | 7 (15.9%) |
| Installation, Maintenance & Repair | 6 (100.0%) | 0 (0.0%) |
| Total (Category) | 43 (86.0%) | 7 (14.0%) |
| Total (Overall) | 197 (50.5%) | 193 (49.5%) |
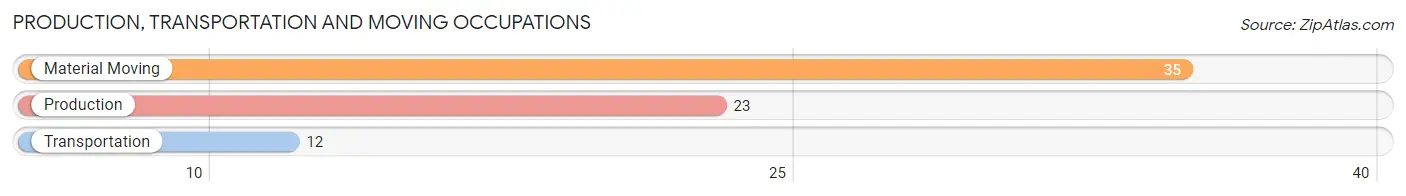
Production, Transportation and Moving Occupations
The most common Production, Transportation and Moving occupations in Bear River are Material Moving (35 | 9.0%), Production (23 | 5.9%), and Transportation (12 | 3.1%).
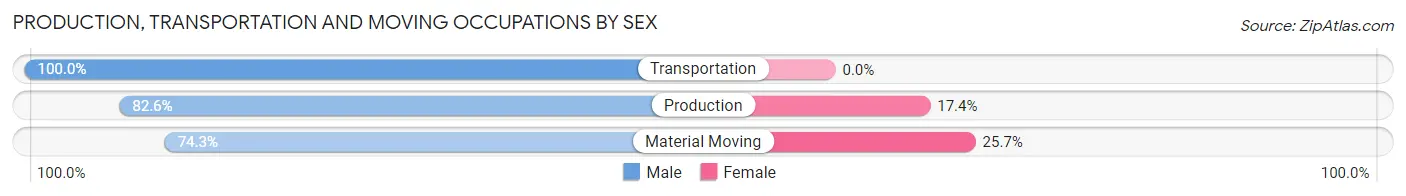
Production, Transportation and Moving Occupations by Sex
| Occupation | Male | Female |
| Production | 19 (82.6%) | 4 (17.4%) |
| Transportation | 12 (100.0%) | 0 (0.0%) |
| Material Moving | 26 (74.3%) | 9 (25.7%) |
| Total (Category) | 57 (81.4%) | 13 (18.6%) |
| Total (Overall) | 197 (50.5%) | 193 (49.5%) |
Employment Industries by Sex in Bear River
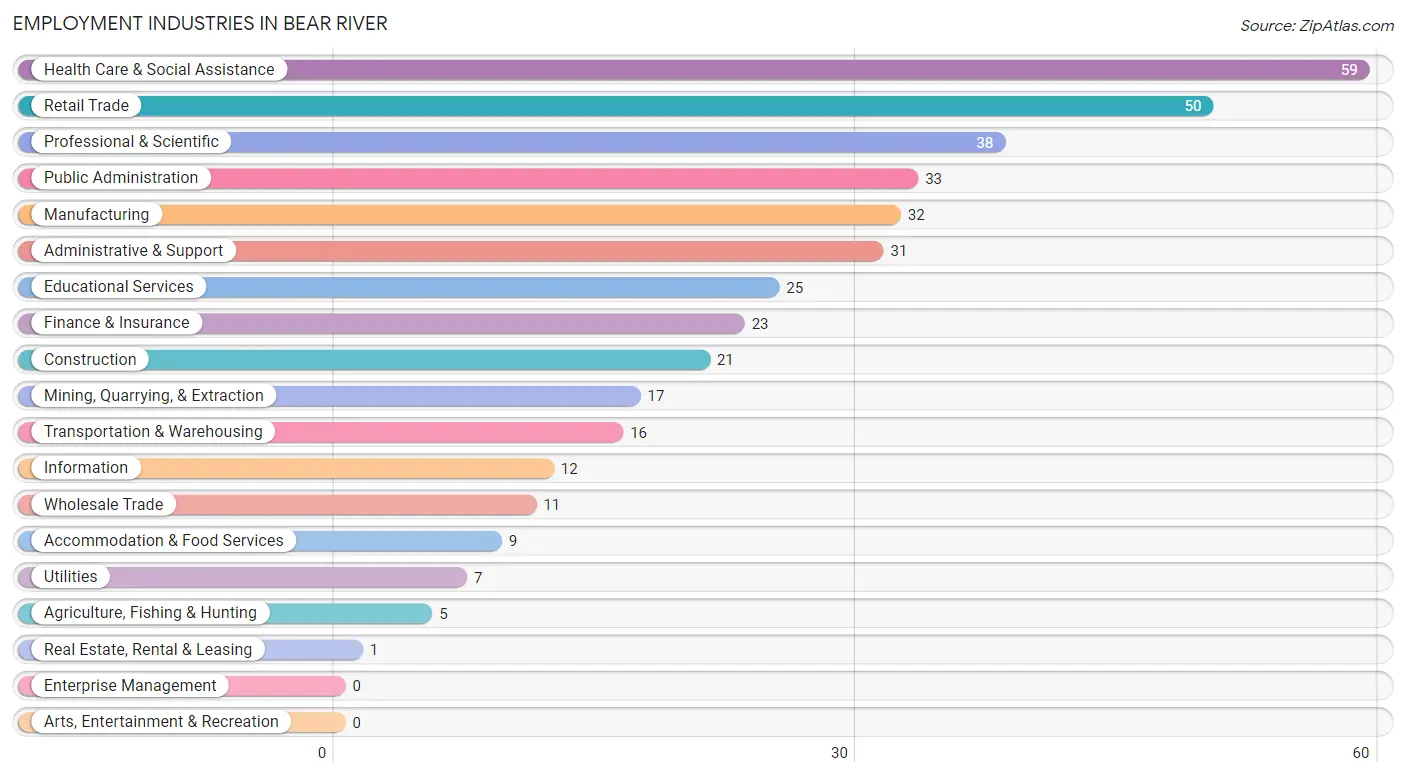
Employment Industries in Bear River
The major employment industries in Bear River include Health Care & Social Assistance (59 | 15.1%), Retail Trade (50 | 12.8%), Professional & Scientific (38 | 9.7%), Public Administration (33 | 8.5%), and Manufacturing (32 | 8.2%).
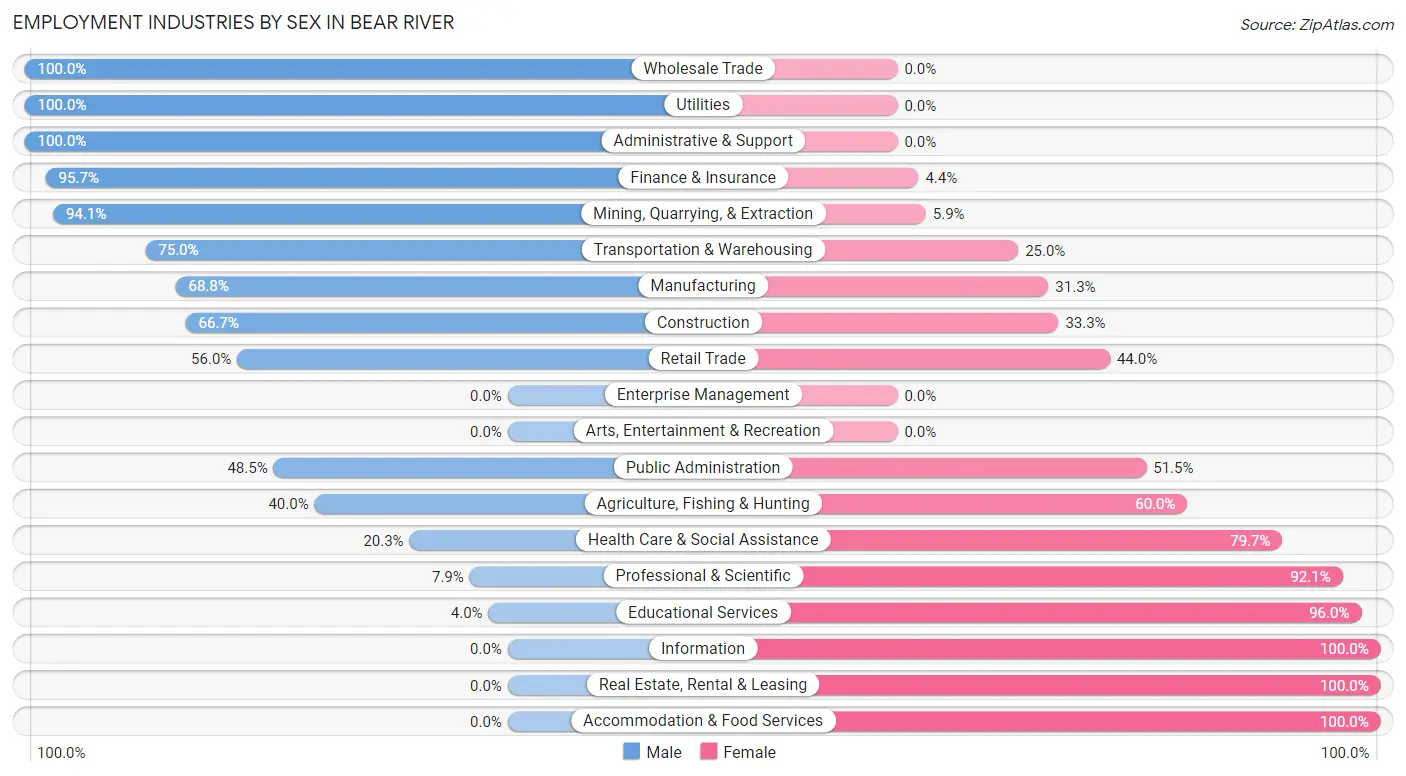
Employment Industries by Sex in Bear River
The Bear River industries that see more men than women are Wholesale Trade (100.0%), Utilities (100.0%), and Administrative & Support (100.0%), whereas the industries that tend to have a higher number of women are Information (100.0%), Real Estate, Rental & Leasing (100.0%), and Accommodation & Food Services (100.0%).
| Industry | Male | Female |
| Agriculture, Fishing & Hunting | 2 (40.0%) | 3 (60.0%) |
| Mining, Quarrying, & Extraction | 16 (94.1%) | 1 (5.9%) |
| Construction | 14 (66.7%) | 7 (33.3%) |
| Manufacturing | 22 (68.8%) | 10 (31.2%) |
| Wholesale Trade | 11 (100.0%) | 0 (0.0%) |
| Retail Trade | 28 (56.0%) | 22 (44.0%) |
| Transportation & Warehousing | 12 (75.0%) | 4 (25.0%) |
| Utilities | 7 (100.0%) | 0 (0.0%) |
| Information | 0 (0.0%) | 12 (100.0%) |
| Finance & Insurance | 22 (95.7%) | 1 (4.3%) |
| Real Estate, Rental & Leasing | 0 (0.0%) | 1 (100.0%) |
| Professional & Scientific | 3 (7.9%) | 35 (92.1%) |
| Enterprise Management | 0 (0.0%) | 0 (0.0%) |
| Administrative & Support | 31 (100.0%) | 0 (0.0%) |
| Educational Services | 1 (4.0%) | 24 (96.0%) |
| Health Care & Social Assistance | 12 (20.3%) | 47 (79.7%) |
| Arts, Entertainment & Recreation | 0 (0.0%) | 0 (0.0%) |
| Accommodation & Food Services | 0 (0.0%) | 9 (100.0%) |
| Public Administration | 16 (48.5%) | 17 (51.5%) |
| Total | 197 (50.5%) | 193 (49.5%) |
Education in Bear River
School Enrollment in Bear River
The most common levels of schooling among the 288 students in Bear River are high school (109 | 37.9%), elementary school (94 | 32.6%), and college / undergraduate (44 | 15.3%).
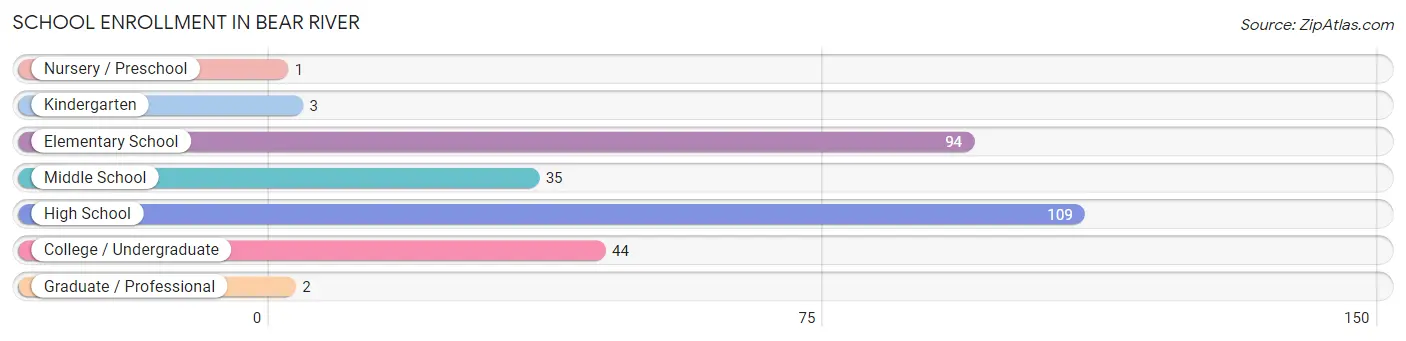
| School Level | # Students | % Students |
| Nursery / Preschool | 1 | 0.4% |
| Kindergarten | 3 | 1.0% |
| Elementary School | 94 | 32.6% |
| Middle School | 35 | 12.1% |
| High School | 109 | 37.9% |
| College / Undergraduate | 44 | 15.3% |
| Graduate / Professional | 2 | 0.7% |
| Total | 288 | 100.0% |
School Enrollment by Age by Funding Source in Bear River
Out of a total of 288 students who are enrolled in schools in Bear River, 3 (1.0%) attend a private institution, while the remaining 285 (99.0%) are enrolled in public schools. The age group of 3 to 4 year olds has the highest likelihood of being enrolled in private schools, with 1 (100.0% in the age bracket) enrolled. Conversely, the age group of 5 to 9 year old has the lowest likelihood of being enrolled in a private school, with 91 (100.0% in the age bracket) attending a public institution.
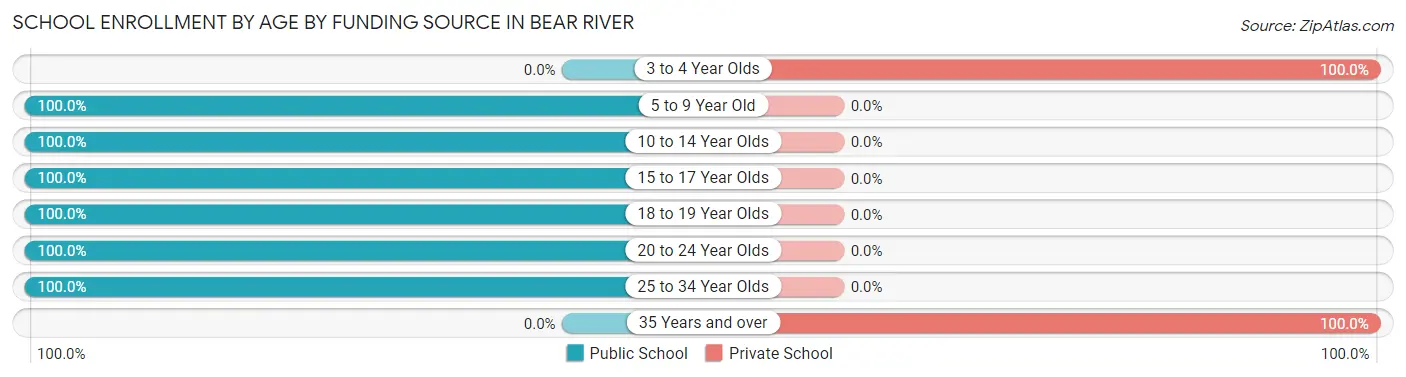
| Age Bracket | Public School | Private School |
| 3 to 4 Year Olds | 0 (0.0%) | 1 (100.0%) |
| 5 to 9 Year Old | 91 (100.0%) | 0 (0.0%) |
| 10 to 14 Year Olds | 48 (100.0%) | 0 (0.0%) |
| 15 to 17 Year Olds | 47 (100.0%) | 0 (0.0%) |
| 18 to 19 Year Olds | 45 (100.0%) | 0 (0.0%) |
| 20 to 24 Year Olds | 52 (100.0%) | 0 (0.0%) |
| 25 to 34 Year Olds | 2 (100.0%) | 0 (0.0%) |
| 35 Years and over | 0 (0.0%) | 2 (100.0%) |
| Total | 285 (99.0%) | 3 (1.0%) |
Educational Attainment by Field of Study in Bear River
Business (34 | 26.2%), literature & languages (24 | 18.5%), liberal arts & history (24 | 18.5%), education (13 | 10.0%), and science & technology (9 | 6.9%) are the most common fields of study among 130 individuals in Bear River who have obtained a bachelor's degree or higher.
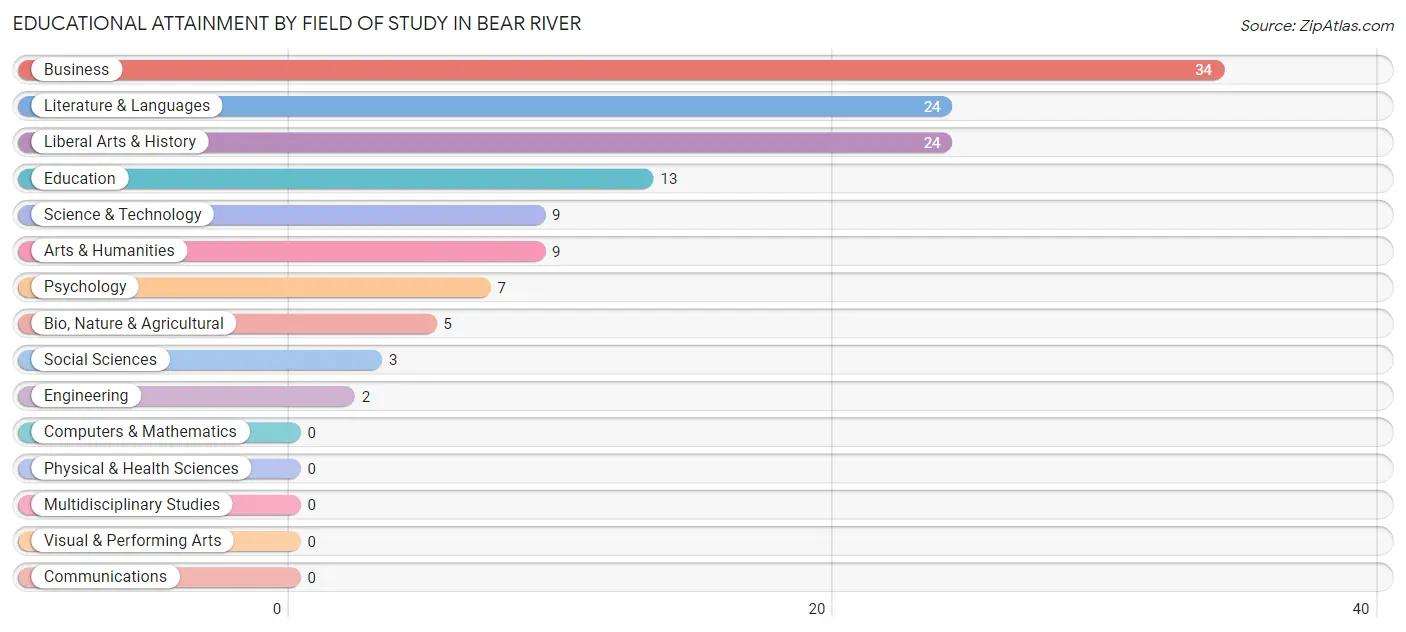
| Field of Study | # Graduates | % Graduates |
| Computers & Mathematics | 0 | 0.0% |
| Bio, Nature & Agricultural | 5 | 3.8% |
| Physical & Health Sciences | 0 | 0.0% |
| Psychology | 7 | 5.4% |
| Social Sciences | 3 | 2.3% |
| Engineering | 2 | 1.5% |
| Multidisciplinary Studies | 0 | 0.0% |
| Science & Technology | 9 | 6.9% |
| Business | 34 | 26.2% |
| Education | 13 | 10.0% |
| Literature & Languages | 24 | 18.5% |
| Liberal Arts & History | 24 | 18.5% |
| Visual & Performing Arts | 0 | 0.0% |
| Communications | 0 | 0.0% |
| Arts & Humanities | 9 | 6.9% |
| Total | 130 | 100.0% |
Transportation & Commute in Bear River
Vehicle Availability by Sex in Bear River
The most prevalent vehicle ownership categories in Bear River are males with 4 vehicles (61, accounting for 32.3%) and females with 4 vehicles (37, making up 31.6%).
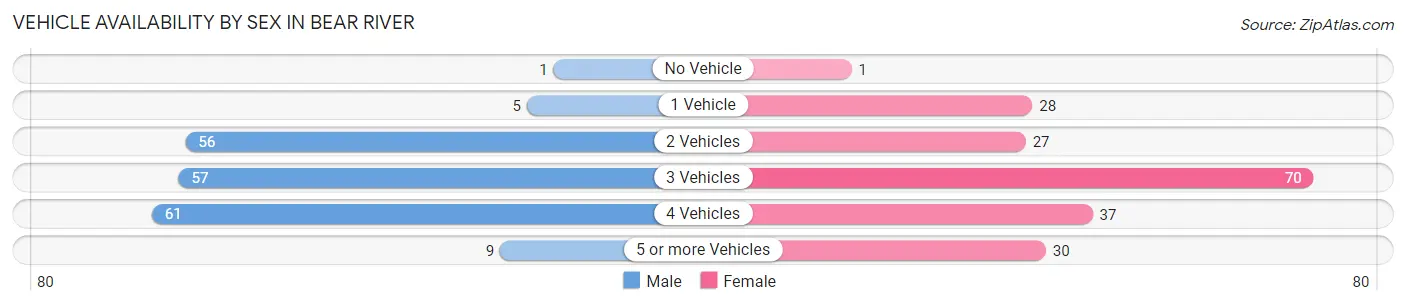
| Vehicles Available | Male | Female |
| No Vehicle | 1 (0.5%) | 1 (0.5%) |
| 1 Vehicle | 5 (2.6%) | 28 (14.5%) |
| 2 Vehicles | 56 (29.6%) | 27 (14.0%) |
| 3 Vehicles | 57 (30.2%) | 70 (36.3%) |
| 4 Vehicles | 61 (32.3%) | 37 (19.2%) |
| 5 or more Vehicles | 9 (4.8%) | 30 (15.5%) |
| Total | 189 (100.0%) | 193 (100.0%) |
Commute Time in Bear River
The most frequently occuring commute durations in Bear River are 15 to 19 minutes (126 commuters, 34.7%), 20 to 24 minutes (95 commuters, 26.2%), and 5 to 9 minutes (42 commuters, 11.6%).
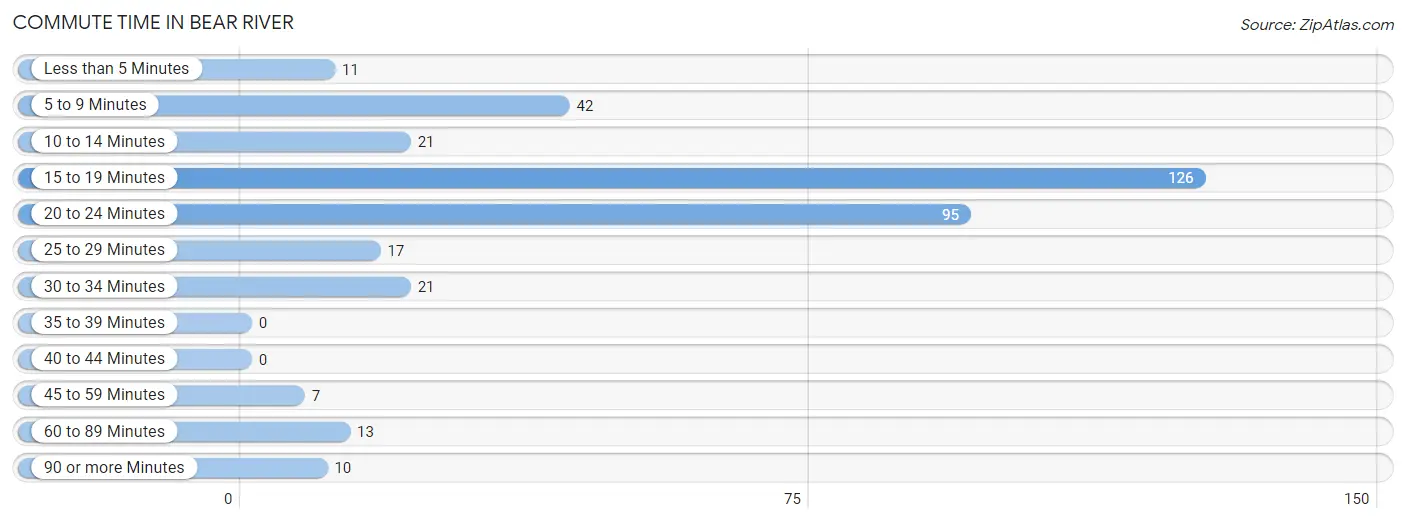
| Commute Time | # Commuters | % Commuters |
| Less than 5 Minutes | 11 | 3.0% |
| 5 to 9 Minutes | 42 | 11.6% |
| 10 to 14 Minutes | 21 | 5.8% |
| 15 to 19 Minutes | 126 | 34.7% |
| 20 to 24 Minutes | 95 | 26.2% |
| 25 to 29 Minutes | 17 | 4.7% |
| 30 to 34 Minutes | 21 | 5.8% |
| 35 to 39 Minutes | 0 | 0.0% |
| 40 to 44 Minutes | 0 | 0.0% |
| 45 to 59 Minutes | 7 | 1.9% |
| 60 to 89 Minutes | 13 | 3.6% |
| 90 or more Minutes | 10 | 2.8% |
Commute Time by Sex in Bear River
The most common commute times in Bear River are 15 to 19 minutes (73 commuters, 41.0%) for males and 20 to 24 minutes (79 commuters, 42.7%) for females.
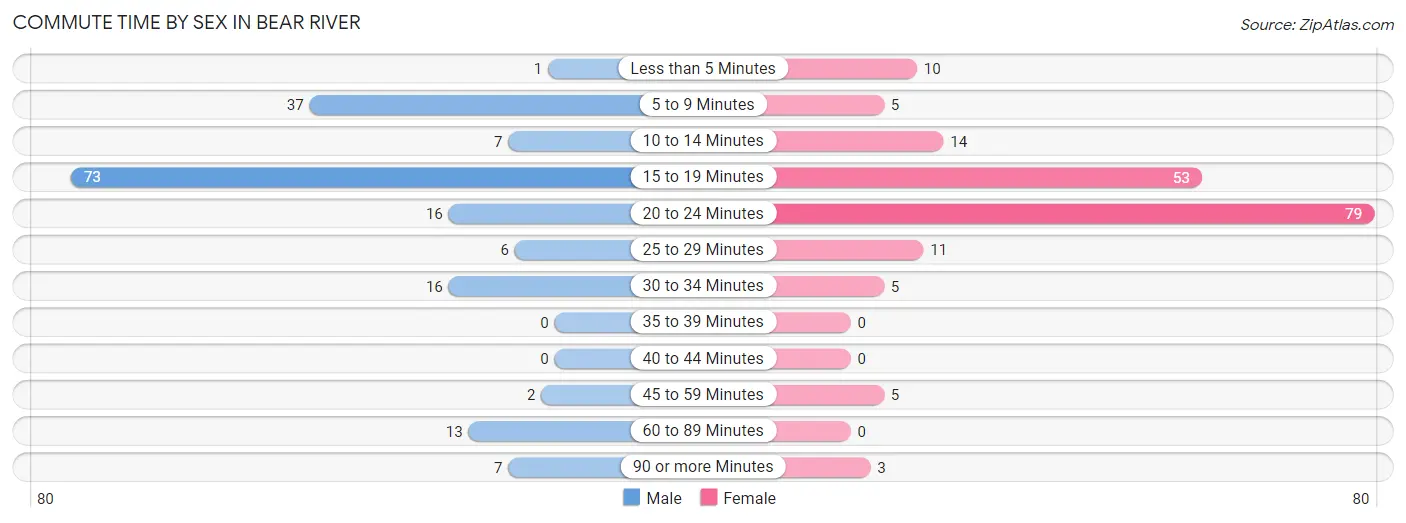
| Commute Time | Male | Female |
| Less than 5 Minutes | 1 (0.6%) | 10 (5.4%) |
| 5 to 9 Minutes | 37 (20.8%) | 5 (2.7%) |
| 10 to 14 Minutes | 7 (3.9%) | 14 (7.6%) |
| 15 to 19 Minutes | 73 (41.0%) | 53 (28.6%) |
| 20 to 24 Minutes | 16 (9.0%) | 79 (42.7%) |
| 25 to 29 Minutes | 6 (3.4%) | 11 (5.9%) |
| 30 to 34 Minutes | 16 (9.0%) | 5 (2.7%) |
| 35 to 39 Minutes | 0 (0.0%) | 0 (0.0%) |
| 40 to 44 Minutes | 0 (0.0%) | 0 (0.0%) |
| 45 to 59 Minutes | 2 (1.1%) | 5 (2.7%) |
| 60 to 89 Minutes | 13 (7.3%) | 0 (0.0%) |
| 90 or more Minutes | 7 (3.9%) | 3 (1.6%) |
Time of Departure to Work by Sex in Bear River
The most frequent times of departure to work in Bear River are 7:00 AM to 7:29 AM (36, 20.2%) for males and 7:00 AM to 7:29 AM (52, 28.1%) for females.
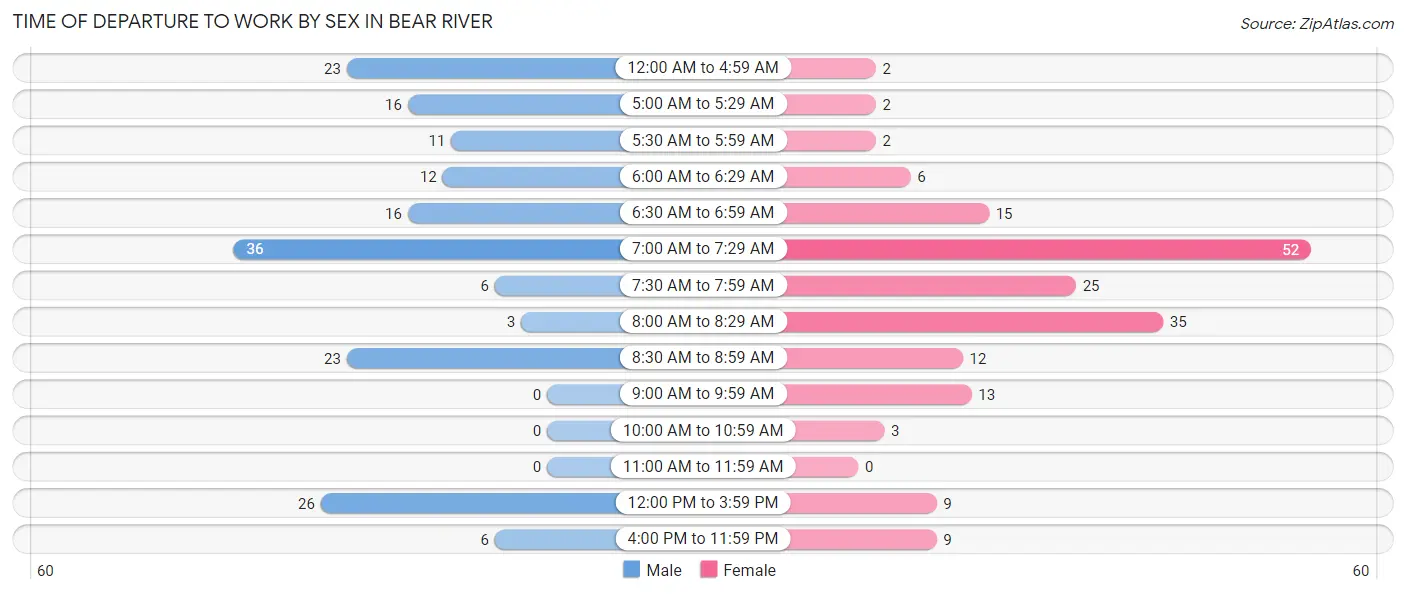
| Time of Departure | Male | Female |
| 12:00 AM to 4:59 AM | 23 (12.9%) | 2 (1.1%) |
| 5:00 AM to 5:29 AM | 16 (9.0%) | 2 (1.1%) |
| 5:30 AM to 5:59 AM | 11 (6.2%) | 2 (1.1%) |
| 6:00 AM to 6:29 AM | 12 (6.7%) | 6 (3.2%) |
| 6:30 AM to 6:59 AM | 16 (9.0%) | 15 (8.1%) |
| 7:00 AM to 7:29 AM | 36 (20.2%) | 52 (28.1%) |
| 7:30 AM to 7:59 AM | 6 (3.4%) | 25 (13.5%) |
| 8:00 AM to 8:29 AM | 3 (1.7%) | 35 (18.9%) |
| 8:30 AM to 8:59 AM | 23 (12.9%) | 12 (6.5%) |
| 9:00 AM to 9:59 AM | 0 (0.0%) | 13 (7.0%) |
| 10:00 AM to 10:59 AM | 0 (0.0%) | 3 (1.6%) |
| 11:00 AM to 11:59 AM | 0 (0.0%) | 0 (0.0%) |
| 12:00 PM to 3:59 PM | 26 (14.6%) | 9 (4.9%) |
| 4:00 PM to 11:59 PM | 6 (3.4%) | 9 (4.9%) |
| Total | 178 (100.0%) | 185 (100.0%) |
Housing Occupancy in Bear River
Occupancy by Ownership in Bear River
Of the total 291 dwellings in Bear River, owner-occupied units account for 275 (94.5%), while renter-occupied units make up 16 (5.5%).
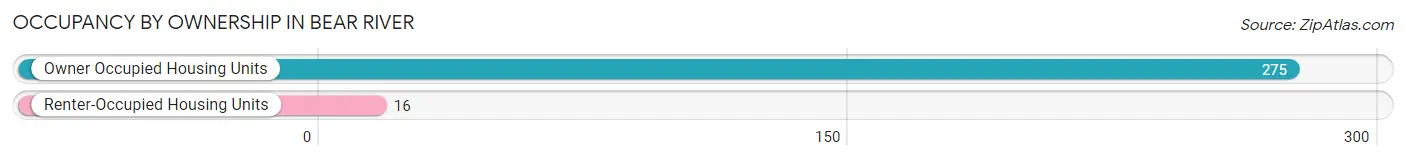
| Occupancy | # Housing Units | % Housing Units |
| Owner Occupied Housing Units | 275 | 94.5% |
| Renter-Occupied Housing Units | 16 | 5.5% |
| Total Occupied Housing Units | 291 | 100.0% |
Occupancy by Household Size in Bear River
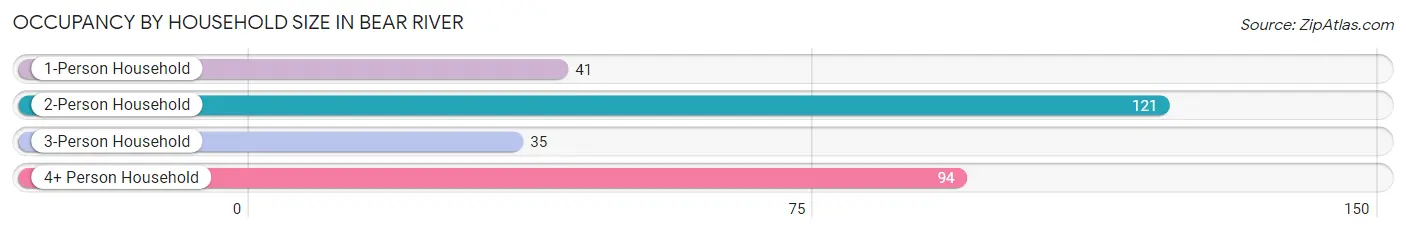
| Household Size | # Housing Units | % Housing Units |
| 1-Person Household | 41 | 14.1% |
| 2-Person Household | 121 | 41.6% |
| 3-Person Household | 35 | 12.0% |
| 4+ Person Household | 94 | 32.3% |
| Total Housing Units | 291 | 100.0% |
Occupancy by Ownership by Household Size in Bear River
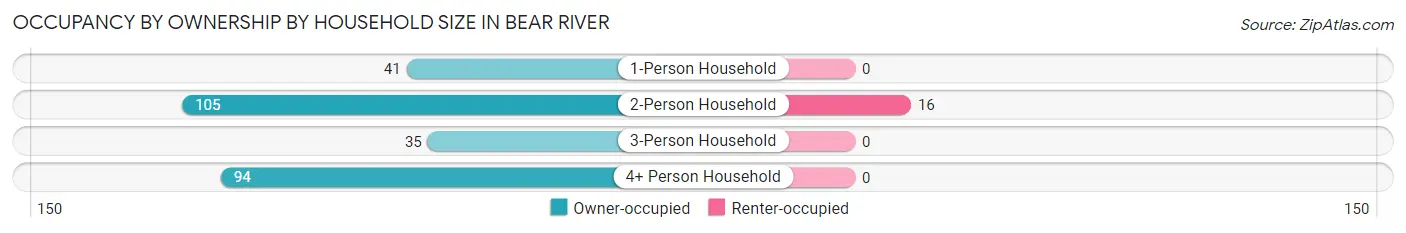
| Household Size | Owner-occupied | Renter-occupied |
| 1-Person Household | 41 (100.0%) | 0 (0.0%) |
| 2-Person Household | 105 (86.8%) | 16 (13.2%) |
| 3-Person Household | 35 (100.0%) | 0 (0.0%) |
| 4+ Person Household | 94 (100.0%) | 0 (0.0%) |
| Total Housing Units | 275 (94.5%) | 16 (5.5%) |
Occupancy by Educational Attainment in Bear River
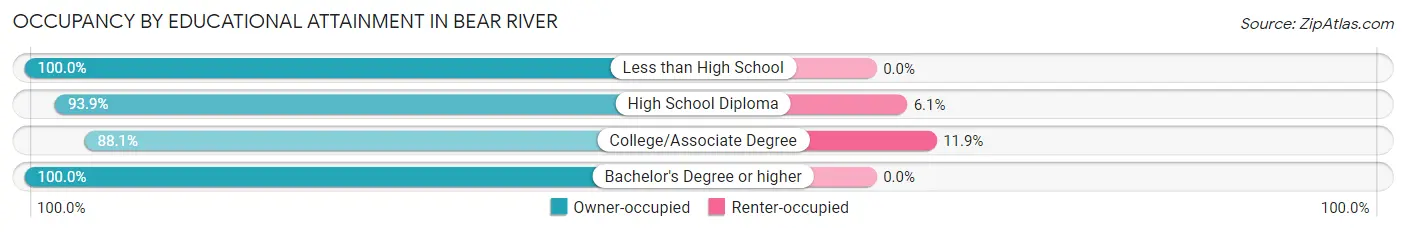
| Household Size | Owner-occupied | Renter-occupied |
| Less than High School | 7 (100.0%) | 0 (0.0%) |
| High School Diploma | 93 (93.9%) | 6 (6.1%) |
| College/Associate Degree | 74 (88.1%) | 10 (11.9%) |
| Bachelor's Degree or higher | 101 (100.0%) | 0 (0.0%) |
Occupancy by Age of Householder in Bear River
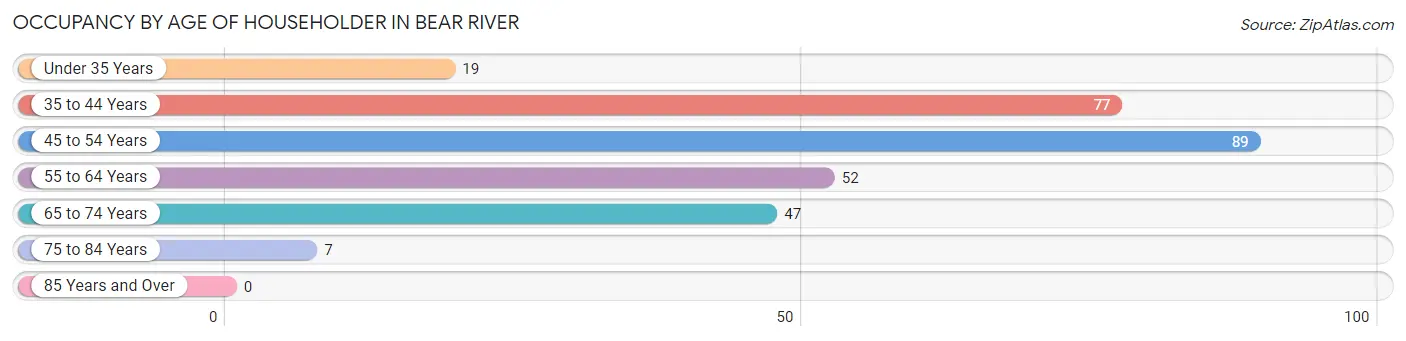
| Age Bracket | # Households | % Households |
| Under 35 Years | 19 | 6.5% |
| 35 to 44 Years | 77 | 26.5% |
| 45 to 54 Years | 89 | 30.6% |
| 55 to 64 Years | 52 | 17.9% |
| 65 to 74 Years | 47 | 16.2% |
| 75 to 84 Years | 7 | 2.4% |
| 85 Years and Over | 0 | 0.0% |
| Total | 291 | 100.0% |
Housing Finances in Bear River
Median Income by Occupancy in Bear River
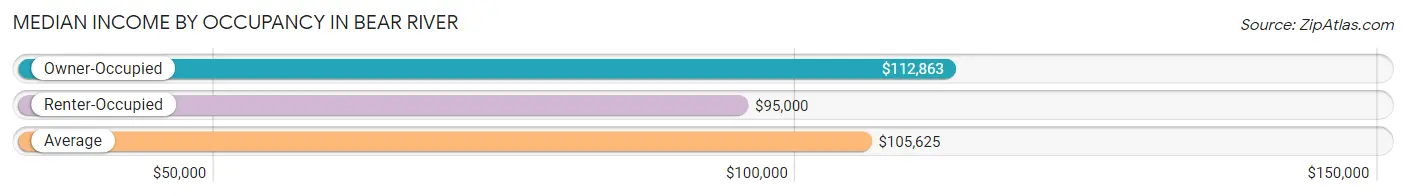
| Occupancy Type | # Households | Median Income |
| Owner-Occupied | 275 (94.5%) | $112,863 |
| Renter-Occupied | 16 (5.5%) | $95,000 |
| Average | 291 (100.0%) | $105,625 |
Occupancy by Householder Income Bracket in Bear River
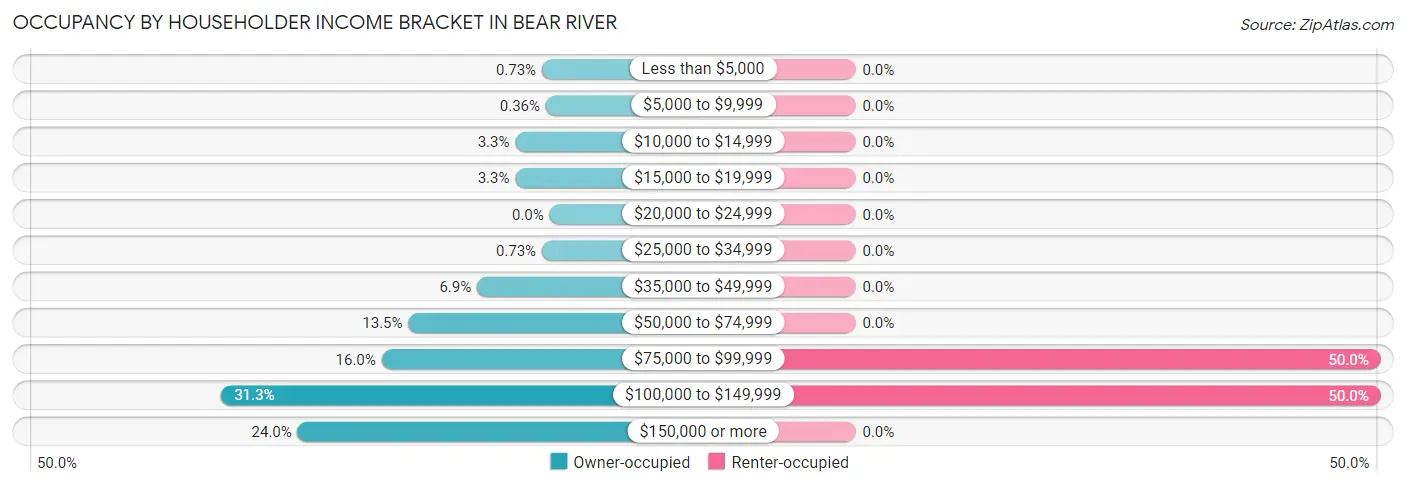
| Income Bracket | Owner-occupied | Renter-occupied |
| Less than $5,000 | 2 (0.7%) | 0 (0.0%) |
| $5,000 to $9,999 | 1 (0.4%) | 0 (0.0%) |
| $10,000 to $14,999 | 9 (3.3%) | 0 (0.0%) |
| $15,000 to $19,999 | 9 (3.3%) | 0 (0.0%) |
| $20,000 to $24,999 | 0 (0.0%) | 0 (0.0%) |
| $25,000 to $34,999 | 2 (0.7%) | 0 (0.0%) |
| $35,000 to $49,999 | 19 (6.9%) | 0 (0.0%) |
| $50,000 to $74,999 | 37 (13.5%) | 0 (0.0%) |
| $75,000 to $99,999 | 44 (16.0%) | 8 (50.0%) |
| $100,000 to $149,999 | 86 (31.3%) | 8 (50.0%) |
| $150,000 or more | 66 (24.0%) | 0 (0.0%) |
| Total | 275 (100.0%) | 16 (100.0%) |
Monthly Housing Cost Tiers in Bear River
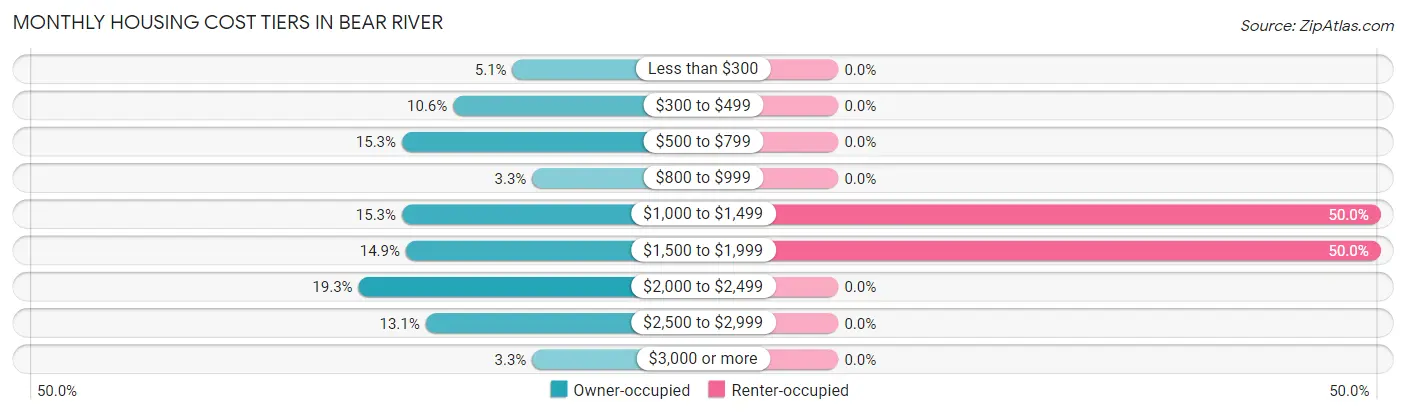
| Monthly Cost | Owner-occupied | Renter-occupied |
| Less than $300 | 14 (5.1%) | 0 (0.0%) |
| $300 to $499 | 29 (10.5%) | 0 (0.0%) |
| $500 to $799 | 42 (15.3%) | 0 (0.0%) |
| $800 to $999 | 9 (3.3%) | 0 (0.0%) |
| $1,000 to $1,499 | 42 (15.3%) | 8 (50.0%) |
| $1,500 to $1,999 | 41 (14.9%) | 8 (50.0%) |
| $2,000 to $2,499 | 53 (19.3%) | 0 (0.0%) |
| $2,500 to $2,999 | 36 (13.1%) | 0 (0.0%) |
| $3,000 or more | 9 (3.3%) | 0 (0.0%) |
| Total | 275 (100.0%) | 16 (100.0%) |
Physical Housing Characteristics in Bear River
Housing Structures in Bear River
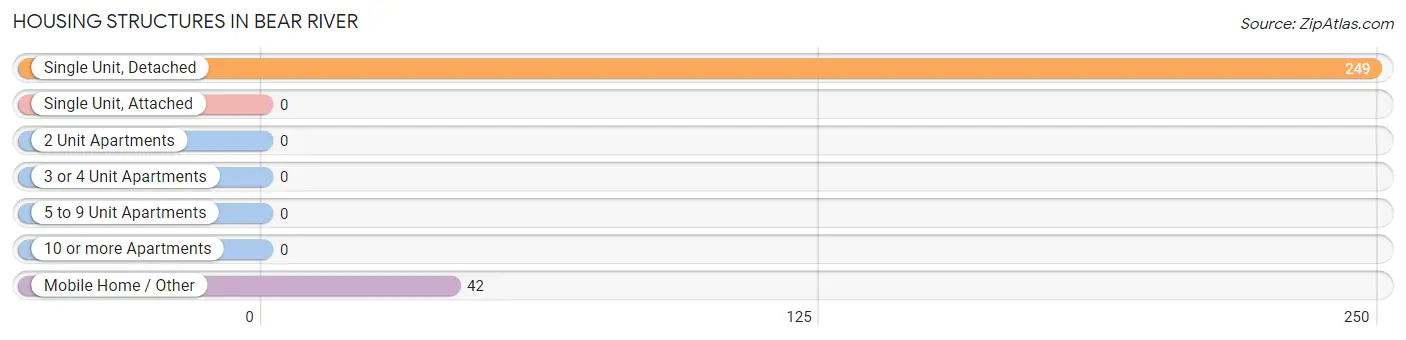
| Structure Type | # Housing Units | % Housing Units |
| Single Unit, Detached | 249 | 85.6% |
| Single Unit, Attached | 0 | 0.0% |
| 2 Unit Apartments | 0 | 0.0% |
| 3 or 4 Unit Apartments | 0 | 0.0% |
| 5 to 9 Unit Apartments | 0 | 0.0% |
| 10 or more Apartments | 0 | 0.0% |
| Mobile Home / Other | 42 | 14.4% |
| Total | 291 | 100.0% |
Housing Structures by Occupancy in Bear River
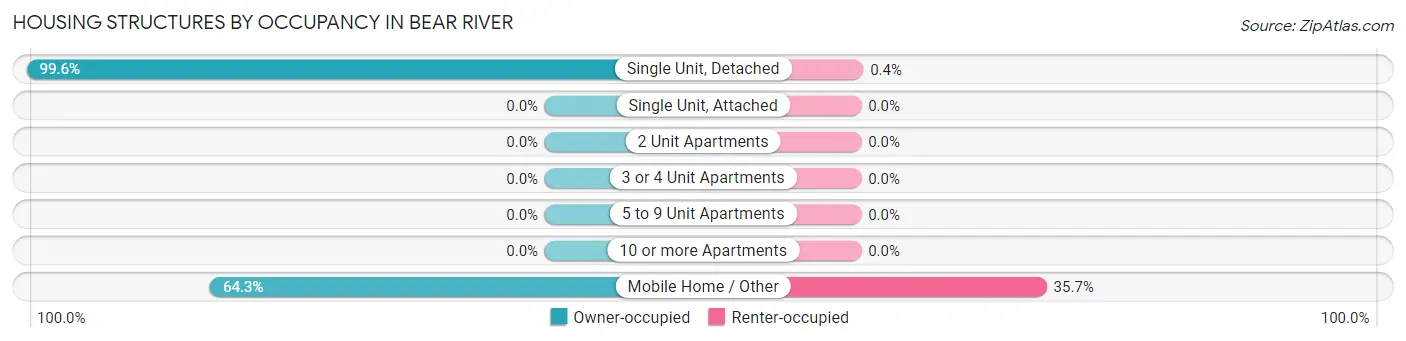
| Structure Type | Owner-occupied | Renter-occupied |
| Single Unit, Detached | 248 (99.6%) | 1 (0.4%) |
| Single Unit, Attached | 0 (0.0%) | 0 (0.0%) |
| 2 Unit Apartments | 0 (0.0%) | 0 (0.0%) |
| 3 or 4 Unit Apartments | 0 (0.0%) | 0 (0.0%) |
| 5 to 9 Unit Apartments | 0 (0.0%) | 0 (0.0%) |
| 10 or more Apartments | 0 (0.0%) | 0 (0.0%) |
| Mobile Home / Other | 27 (64.3%) | 15 (35.7%) |
| Total | 275 (94.5%) | 16 (5.5%) |
Housing Structures by Number of Rooms in Bear River
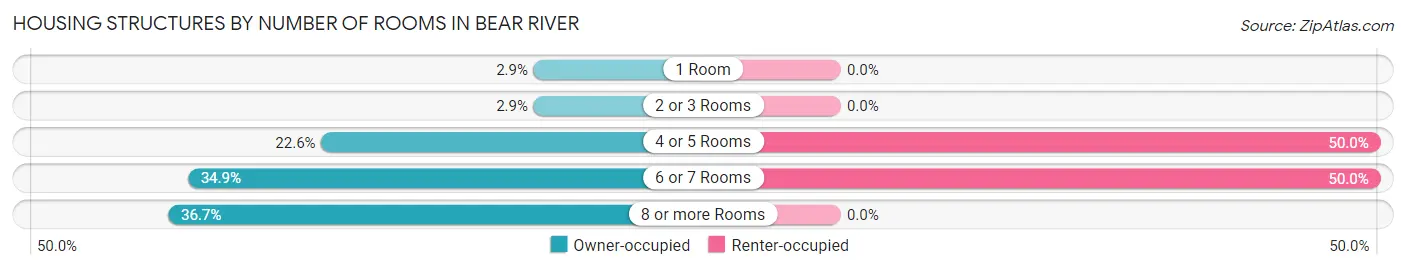
| Number of Rooms | Owner-occupied | Renter-occupied |
| 1 Room | 8 (2.9%) | 0 (0.0%) |
| 2 or 3 Rooms | 8 (2.9%) | 0 (0.0%) |
| 4 or 5 Rooms | 62 (22.6%) | 8 (50.0%) |
| 6 or 7 Rooms | 96 (34.9%) | 8 (50.0%) |
| 8 or more Rooms | 101 (36.7%) | 0 (0.0%) |
| Total | 275 (100.0%) | 16 (100.0%) |
Housing Structure by Heating Type in Bear River
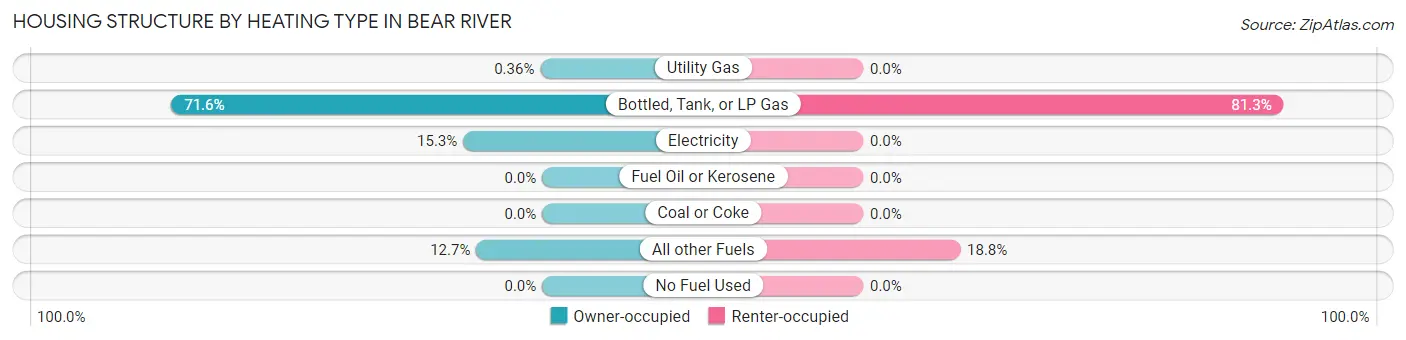
| Heating Type | Owner-occupied | Renter-occupied |
| Utility Gas | 1 (0.4%) | 0 (0.0%) |
| Bottled, Tank, or LP Gas | 197 (71.6%) | 13 (81.2%) |
| Electricity | 42 (15.3%) | 0 (0.0%) |
| Fuel Oil or Kerosene | 0 (0.0%) | 0 (0.0%) |
| Coal or Coke | 0 (0.0%) | 0 (0.0%) |
| All other Fuels | 35 (12.7%) | 3 (18.8%) |
| No Fuel Used | 0 (0.0%) | 0 (0.0%) |
| Total | 275 (100.0%) | 16 (100.0%) |
Household Vehicle Usage in Bear River
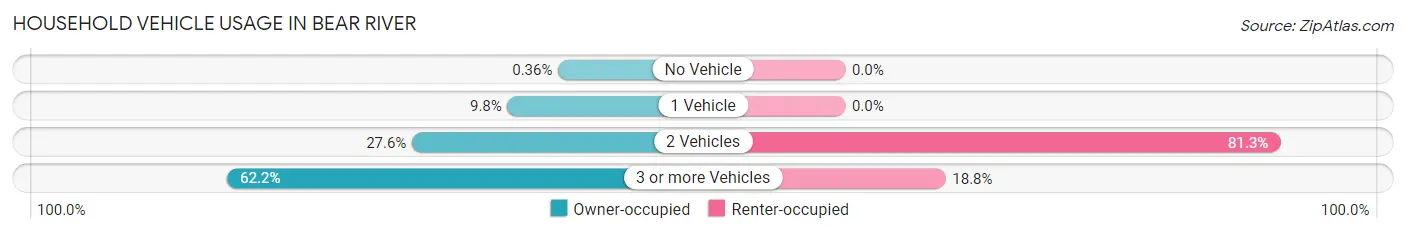
| Vehicles per Household | Owner-occupied | Renter-occupied |
| No Vehicle | 1 (0.4%) | 0 (0.0%) |
| 1 Vehicle | 27 (9.8%) | 0 (0.0%) |
| 2 Vehicles | 76 (27.6%) | 13 (81.2%) |
| 3 or more Vehicles | 171 (62.2%) | 3 (18.8%) |
| Total | 275 (100.0%) | 16 (100.0%) |
Real Estate & Mortgages in Bear River
Real Estate and Mortgage Overview in Bear River
| Characteristic | Without Mortgage | With Mortgage |
| Housing Units | 89 | 186 |
| Median Property Value | $303,900 | $339,100 |
| Median Household Income | $87,750 | $60 |
| Monthly Housing Costs | $519 | $9 |
| Real Estate Taxes | $1,649 | $0 |
Property Value by Mortgage Status in Bear River
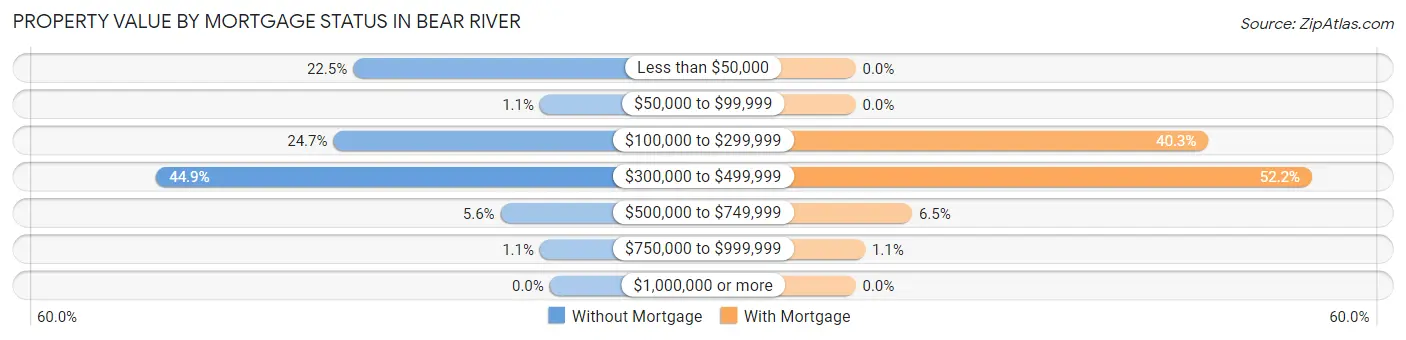
| Property Value | Without Mortgage | With Mortgage |
| Less than $50,000 | 20 (22.5%) | 0 (0.0%) |
| $50,000 to $99,999 | 1 (1.1%) | 0 (0.0%) |
| $100,000 to $299,999 | 22 (24.7%) | 75 (40.3%) |
| $300,000 to $499,999 | 40 (44.9%) | 97 (52.1%) |
| $500,000 to $749,999 | 5 (5.6%) | 12 (6.5%) |
| $750,000 to $999,999 | 1 (1.1%) | 2 (1.1%) |
| $1,000,000 or more | 0 (0.0%) | 0 (0.0%) |
| Total | 89 (100.0%) | 186 (100.0%) |
Household Income by Mortgage Status in Bear River
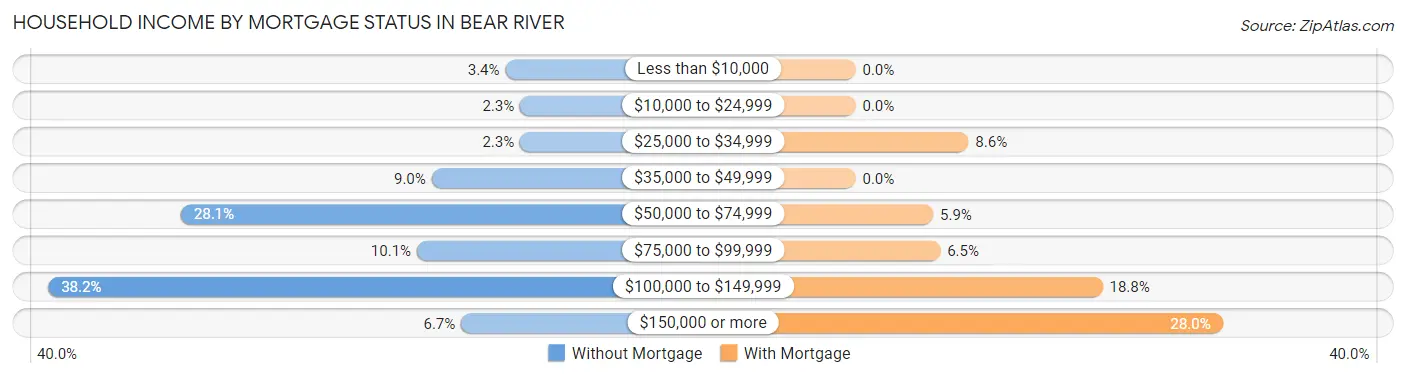
| Household Income | Without Mortgage | With Mortgage |
| Less than $10,000 | 3 (3.4%) | 0 (0.0%) |
| $10,000 to $24,999 | 2 (2.2%) | 0 (0.0%) |
| $25,000 to $34,999 | 2 (2.2%) | 16 (8.6%) |
| $35,000 to $49,999 | 8 (9.0%) | 0 (0.0%) |
| $50,000 to $74,999 | 25 (28.1%) | 11 (5.9%) |
| $75,000 to $99,999 | 9 (10.1%) | 12 (6.5%) |
| $100,000 to $149,999 | 34 (38.2%) | 35 (18.8%) |
| $150,000 or more | 6 (6.7%) | 52 (28.0%) |
| Total | 89 (100.0%) | 186 (100.0%) |
Property Value to Household Income Ratio in Bear River
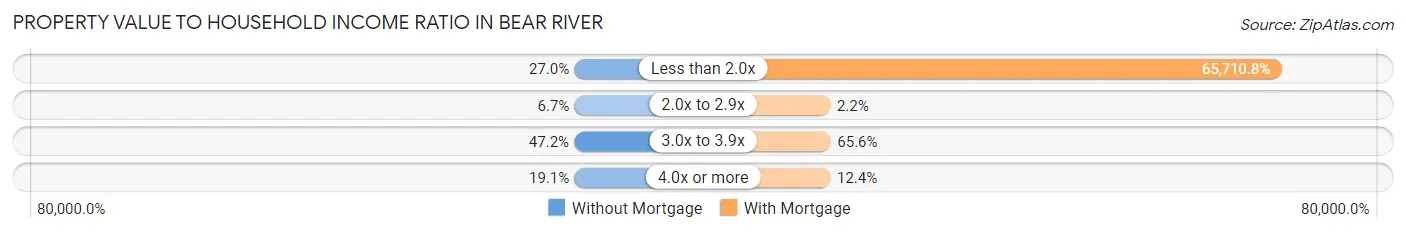
| Value-to-Income Ratio | Without Mortgage | With Mortgage |
| Less than 2.0x | 24 (27.0%) | 122,222 (65,710.7%) |
| 2.0x to 2.9x | 6 (6.7%) | 4 (2.1%) |
| 3.0x to 3.9x | 42 (47.2%) | 122 (65.6%) |
| 4.0x or more | 17 (19.1%) | 23 (12.4%) |
| Total | 89 (100.0%) | 186 (100.0%) |
Real Estate Taxes by Mortgage Status in Bear River
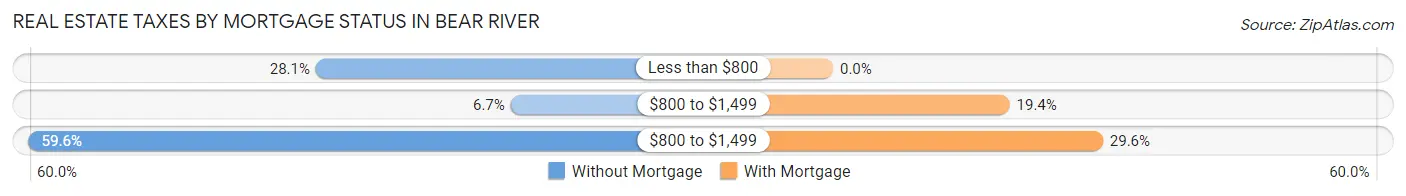
| Property Taxes | Without Mortgage | With Mortgage |
| Less than $800 | 25 (28.1%) | 0 (0.0%) |
| $800 to $1,499 | 6 (6.7%) | 36 (19.4%) |
| $800 to $1,499 | 53 (59.6%) | 55 (29.6%) |
| Total | 89 (100.0%) | 186 (100.0%) |
Health & Disability in Bear River
Health Insurance Coverage by Age in Bear River
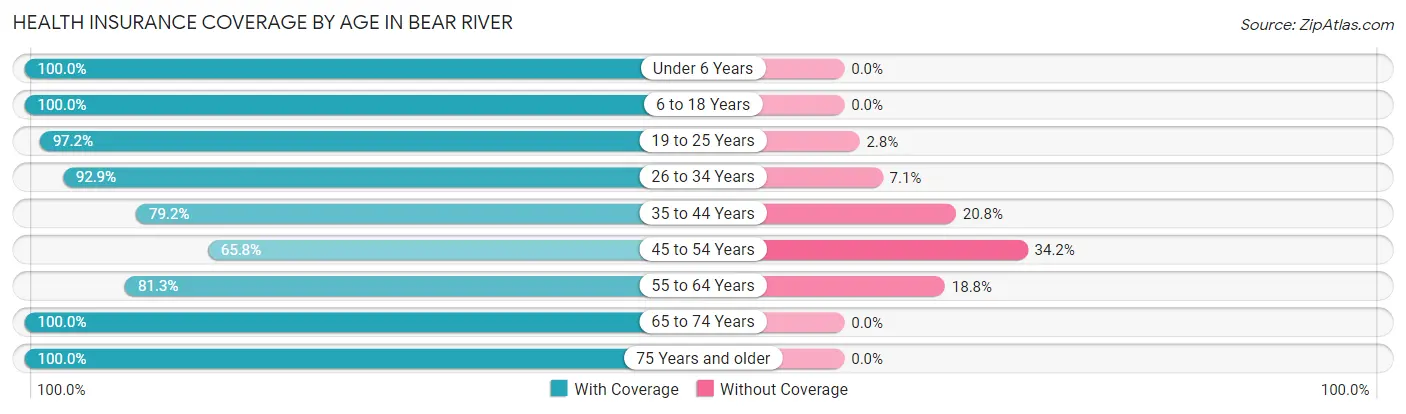
| Age Bracket | With Coverage | Without Coverage |
| Under 6 Years | 69 (100.0%) | 0 (0.0%) |
| 6 to 18 Years | 219 (100.0%) | 0 (0.0%) |
| 19 to 25 Years | 103 (97.2%) | 3 (2.8%) |
| 26 to 34 Years | 39 (92.9%) | 3 (7.1%) |
| 35 to 44 Years | 80 (79.2%) | 21 (20.8%) |
| 45 to 54 Years | 104 (65.8%) | 54 (34.2%) |
| 55 to 64 Years | 65 (81.2%) | 15 (18.8%) |
| 65 to 74 Years | 88 (100.0%) | 0 (0.0%) |
| 75 Years and older | 10 (100.0%) | 0 (0.0%) |
| Total | 777 (89.0%) | 96 (11.0%) |
Health Insurance Coverage by Citizenship Status in Bear River
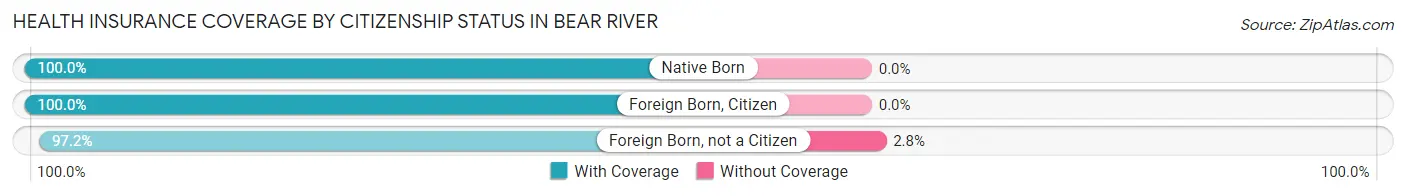
| Citizenship Status | With Coverage | Without Coverage |
| Native Born | 69 (100.0%) | 0 (0.0%) |
| Foreign Born, Citizen | 219 (100.0%) | 0 (0.0%) |
| Foreign Born, not a Citizen | 103 (97.2%) | 3 (2.8%) |
Health Insurance Coverage by Household Income in Bear River
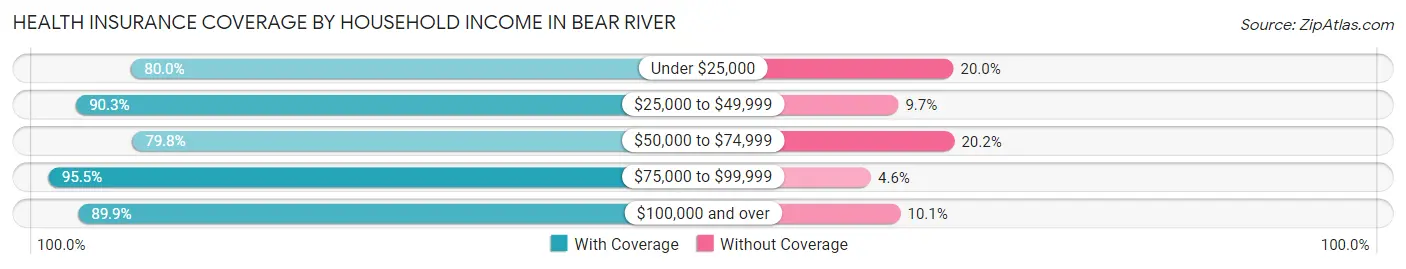
| Household Income | With Coverage | Without Coverage |
| Under $25,000 | 32 (80.0%) | 8 (20.0%) |
| $25,000 to $49,999 | 28 (90.3%) | 3 (9.7%) |
| $50,000 to $74,999 | 91 (79.8%) | 23 (20.2%) |
| $75,000 to $99,999 | 126 (95.5%) | 6 (4.5%) |
| $100,000 and over | 500 (89.9%) | 56 (10.1%) |
Public vs Private Health Insurance Coverage by Age in Bear River
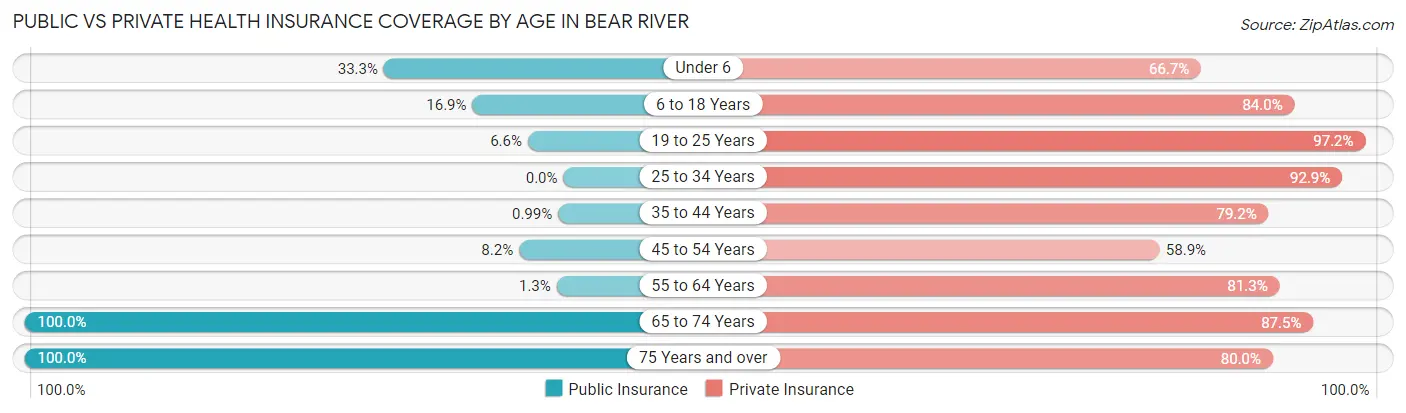
| Age Bracket | Public Insurance | Private Insurance |
| Under 6 | 23 (33.3%) | 46 (66.7%) |
| 6 to 18 Years | 37 (16.9%) | 184 (84.0%) |
| 19 to 25 Years | 7 (6.6%) | 103 (97.2%) |
| 25 to 34 Years | 0 (0.0%) | 39 (92.9%) |
| 35 to 44 Years | 1 (1.0%) | 80 (79.2%) |
| 45 to 54 Years | 13 (8.2%) | 93 (58.9%) |
| 55 to 64 Years | 1 (1.3%) | 65 (81.2%) |
| 65 to 74 Years | 88 (100.0%) | 77 (87.5%) |
| 75 Years and over | 10 (100.0%) | 8 (80.0%) |
| Total | 180 (20.6%) | 695 (79.6%) |
Disability Status by Sex by Age in Bear River
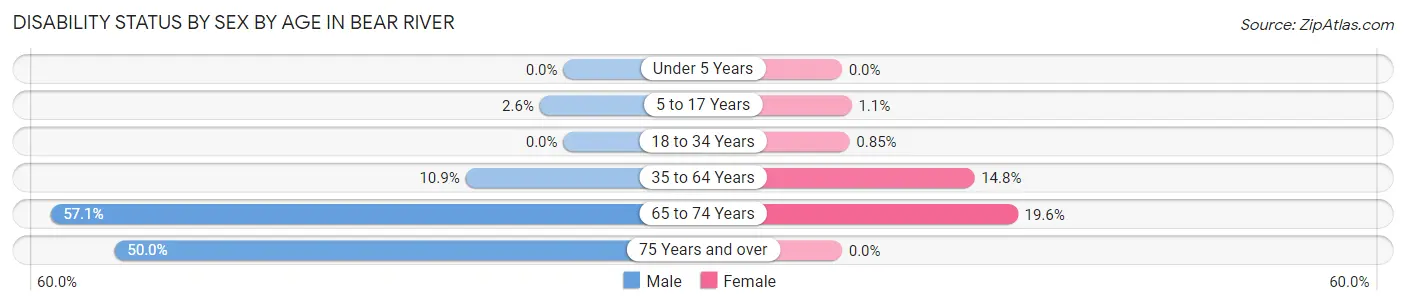
| Age Bracket | Male | Female |
| Under 5 Years | 0 (0.0%) | 0 (0.0%) |
| 5 to 17 Years | 4 (2.6%) | 1 (1.1%) |
| 18 to 34 Years | 0 (0.0%) | 1 (0.9%) |
| 35 to 64 Years | 17 (10.9%) | 27 (14.7%) |
| 65 to 74 Years | 24 (57.1%) | 9 (19.6%) |
| 75 Years and over | 3 (50.0%) | 0 (0.0%) |
Disability Class by Sex by Age in Bear River
Disability Class: Hearing Difficulty
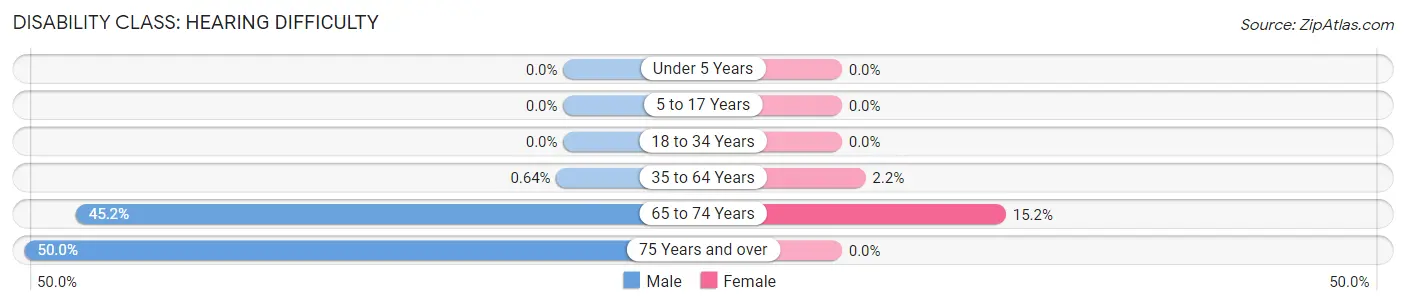
| Age Bracket | Male | Female |
| Under 5 Years | 0 (0.0%) | 0 (0.0%) |
| 5 to 17 Years | 0 (0.0%) | 0 (0.0%) |
| 18 to 34 Years | 0 (0.0%) | 0 (0.0%) |
| 35 to 64 Years | 1 (0.6%) | 4 (2.2%) |
| 65 to 74 Years | 19 (45.2%) | 7 (15.2%) |
| 75 Years and over | 3 (50.0%) | 0 (0.0%) |
Disability Class: Vision Difficulty
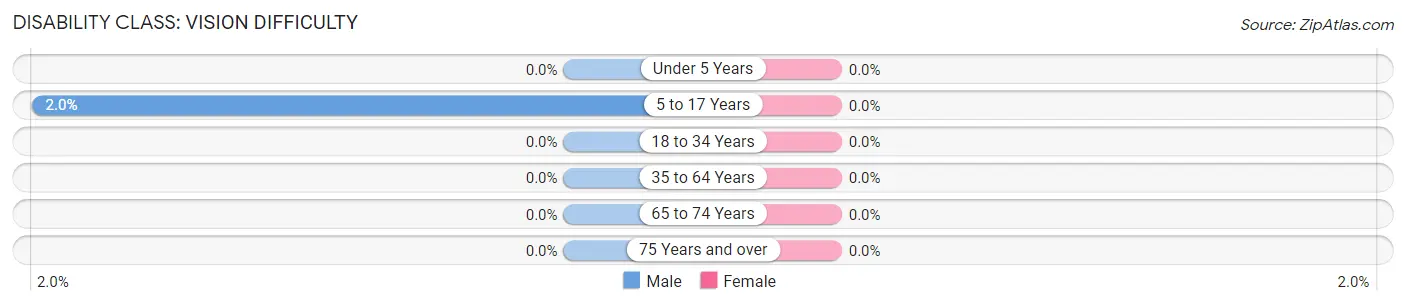
| Age Bracket | Male | Female |
| Under 5 Years | 0 (0.0%) | 0 (0.0%) |
| 5 to 17 Years | 3 (2.0%) | 0 (0.0%) |
| 18 to 34 Years | 0 (0.0%) | 0 (0.0%) |
| 35 to 64 Years | 0 (0.0%) | 0 (0.0%) |
| 65 to 74 Years | 0 (0.0%) | 0 (0.0%) |
| 75 Years and over | 0 (0.0%) | 0 (0.0%) |
Disability Class: Cognitive Difficulty
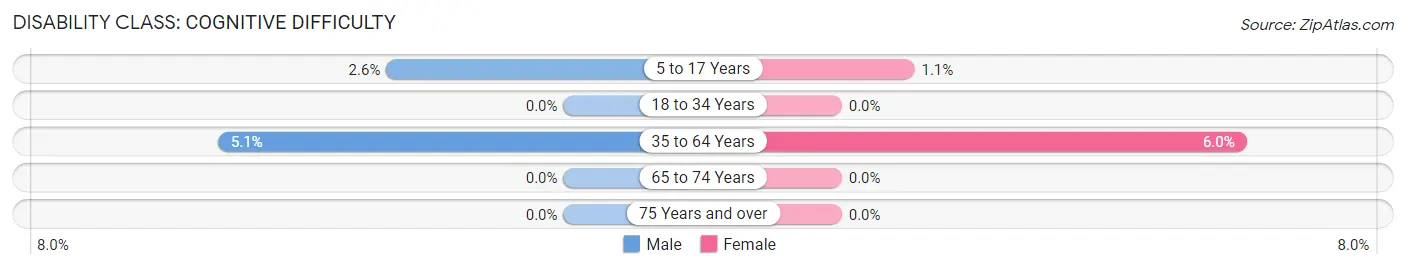
| Age Bracket | Male | Female |
| 5 to 17 Years | 4 (2.6%) | 1 (1.1%) |
| 18 to 34 Years | 0 (0.0%) | 0 (0.0%) |
| 35 to 64 Years | 8 (5.1%) | 11 (6.0%) |
| 65 to 74 Years | 0 (0.0%) | 0 (0.0%) |
| 75 Years and over | 0 (0.0%) | 0 (0.0%) |
Disability Class: Ambulatory Difficulty
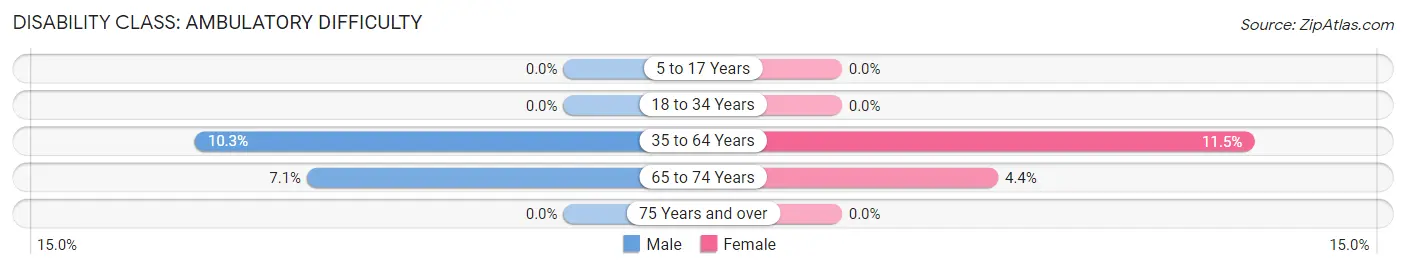
| Age Bracket | Male | Female |
| 5 to 17 Years | 0 (0.0%) | 0 (0.0%) |
| 18 to 34 Years | 0 (0.0%) | 0 (0.0%) |
| 35 to 64 Years | 16 (10.3%) | 21 (11.5%) |
| 65 to 74 Years | 3 (7.1%) | 2 (4.3%) |
| 75 Years and over | 0 (0.0%) | 0 (0.0%) |
Disability Class: Self-Care Difficulty
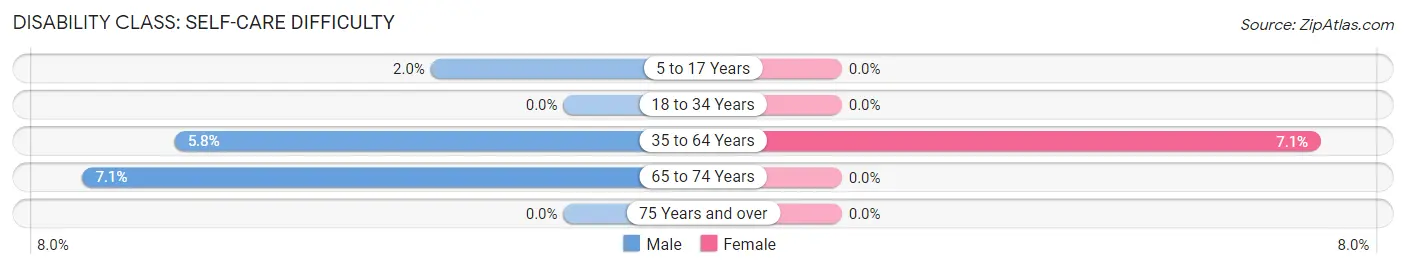
| Age Bracket | Male | Female |
| 5 to 17 Years | 3 (2.0%) | 0 (0.0%) |
| 18 to 34 Years | 0 (0.0%) | 0 (0.0%) |
| 35 to 64 Years | 9 (5.8%) | 13 (7.1%) |
| 65 to 74 Years | 3 (7.1%) | 0 (0.0%) |
| 75 Years and over | 0 (0.0%) | 0 (0.0%) |
Technology Access in Bear River
Computing Device Access in Bear River
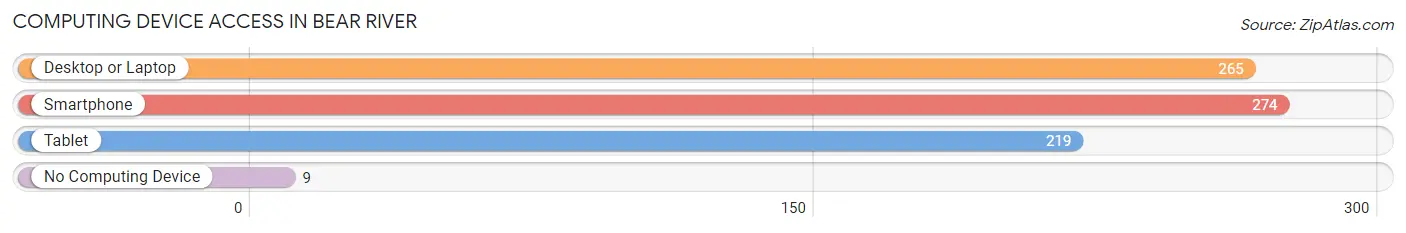
| Device Type | # Households | % Households |
| Desktop or Laptop | 265 | 91.1% |
| Smartphone | 274 | 94.2% |
| Tablet | 219 | 75.3% |
| No Computing Device | 9 | 3.1% |
| Total | 291 | 100.0% |
Internet Access in Bear River
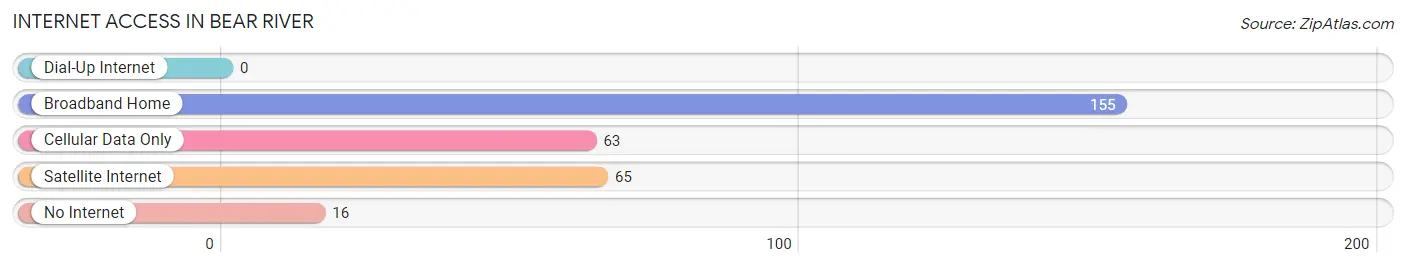
| Internet Type | # Households | % Households |
| Dial-Up Internet | 0 | 0.0% |
| Broadband Home | 155 | 53.3% |
| Cellular Data Only | 63 | 21.6% |
| Satellite Internet | 65 | 22.3% |
| No Internet | 16 | 5.5% |
| Total | 291 | 100.0% |
Bear River Summary
River, Wyoming is a small town located in the western part of the state, near the border of Utah. It is situated in the Bear River Valley, which is part of the larger Great Basin region. The town is located at the confluence of the Bear River and the Green River, and is the county seat of Lincoln County. The population of the town was estimated to be 1,072 in 2020.
History
The area around Bear River was first inhabited by the Shoshone people, who lived in the area for centuries before the arrival of European settlers. The first recorded European exploration of the area was in 1811, when the Lewis and Clark Expedition passed through the area. The first permanent settlement in the area was established in 1864, when a group of Mormon settlers arrived and established a trading post. The town was officially founded in 1868, and was named after the nearby Bear River.
Geography
Bear River is located in the western part of Wyoming, near the border of Utah. It is situated in the Bear River Valley, which is part of the larger Great Basin region. The town is located at the confluence of the Bear River and the Green River, and is the county seat of Lincoln County. The town is surrounded by mountains, including the Uinta Mountains to the east and the Wasatch Range to the west. The climate in the area is semi-arid, with hot summers and cold winters.
Economy
The economy of Bear River is largely based on agriculture and tourism. The town is home to several farms, which produce a variety of crops, including hay, wheat, and corn. The town is also home to several tourist attractions, including the Bear River State Park, which offers camping, fishing, and other outdoor activities. The town is also home to several small businesses, including restaurants, shops, and lodging.
Demographics
The population of Bear River was estimated to be 1,072 in 2020. The racial makeup of the town was 95.2% White, 0.7% Native American, 0.3% Asian, 0.2% African American, and 3.6% from other races. The median household income in the town was $41,250, and the median age was 39.7 years. The town is served by the Bear River School District, which includes one elementary school, one middle school, and one high school.
Common Questions
What is Per Capita Income in Bear River?
Per Capita income in Bear River is $31,421.
What is the Median Family Income in Bear River?
Median Family Income in Bear River is $114,758.
What is the Median Household income in Bear River?
Median Household Income in Bear River is $105,625.
What is Income or Wage Gap in Bear River?
Income or Wage Gap in Bear River is 56.6%.
Women in Bear River earn 43.4 cents for every dollar earned by a man.
What is Inequality or Gini Index in Bear River?
Inequality or Gini Index in Bear River is 0.25.
What is the Total Population of Bear River?
Total Population of Bear River is 873.
What is the Total Male Population of Bear River?
Total Male Population of Bear River is 414.
What is the Total Female Population of Bear River?
Total Female Population of Bear River is 459.
What is the Ratio of Males per 100 Females in Bear River?
There are 90.20 Males per 100 Females in Bear River.
What is the Ratio of Females per 100 Males in Bear River?
There are 110.87 Females per 100 Males in Bear River.
What is the Median Population Age in Bear River?
Median Population Age in Bear River is 35.0 Years.
What is the Average Family Size in Bear River
Average Family Size in Bear River is 3.4 People.
What is the Average Household Size in Bear River
Average Household Size in Bear River is 3.0 People.
How Large is the Labor Force in Bear River?
There are 399 People in the Labor Forcein in Bear River.
What is the Percentage of People in the Labor Force in Bear River?
61.5% of People are in the Labor Force in Bear River.
What is the Unemployment Rate in Bear River?
Unemployment Rate in Bear River is 2.3%.