Boulder Flats, WY Map & Demographics
Boulder Flats Map
Boulder Flats Overview
$27,771
PER CAPITA INCOME
$68,750
AVG FAMILY INCOME
$68,333
AVG HOUSEHOLD INCOME
15.3%
WAGE / INCOME GAP [ % ]
84.7¢/ $1
WAGE / INCOME GAP [ $ ]
0.43
INEQUALITY / GINI INDEX
513
TOTAL POPULATION
259
MALE POPULATION
254
FEMALE POPULATION
101.97
MALES / 100 FEMALES
98.07
FEMALES / 100 MALES
38.1
MEDIAN AGE
4.2
AVG FAMILY SIZE
3.4
AVG HOUSEHOLD SIZE
216
LABOR FORCE [ PEOPLE ]
54.0%
PERCENT IN LABOR FORCE
15.3%
UNEMPLOYMENT RATE
Income in Boulder Flats
Income Overview in Boulder Flats
Per Capita Income in Boulder Flats is $27,771, while median incomes of families and households are $68,750 and $68,333 respectively.
| Characteristic | Number | Measure |
| Per Capita Income | 513 | $27,771 |
| Median Family Income | 98 | $68,750 |
| Mean Family Income | 98 | $88,089 |
| Median Household Income | 150 | $68,333 |
| Mean Household Income | 150 | $78,909 |
| Income Deficit | 98 | $0 |
| Wage / Income Gap (%) | 513 | 15.34% |
| Wage / Income Gap ($) | 513 | 84.66¢ per $1 |
| Gini / Inequality Index | 513 | 0.43 |
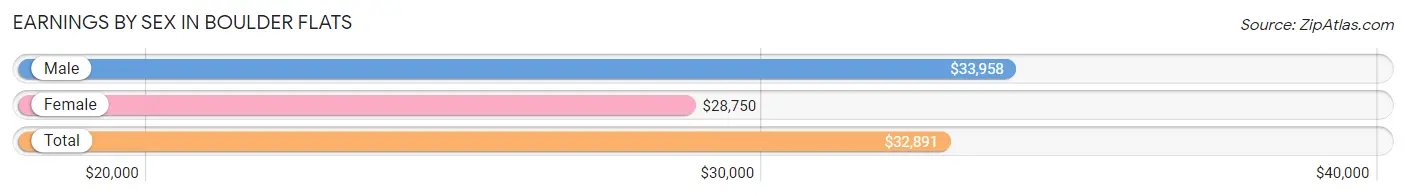
Earnings by Sex in Boulder Flats
Average Earnings in Boulder Flats are $32,891, $33,958 for men and $28,750 for women, a difference of 15.3%.
| Sex | Number | Average Earnings |
| Male | 132 (53.0%) | $33,958 |
| Female | 117 (47.0%) | $28,750 |
| Total | 249 (100.0%) | $32,891 |
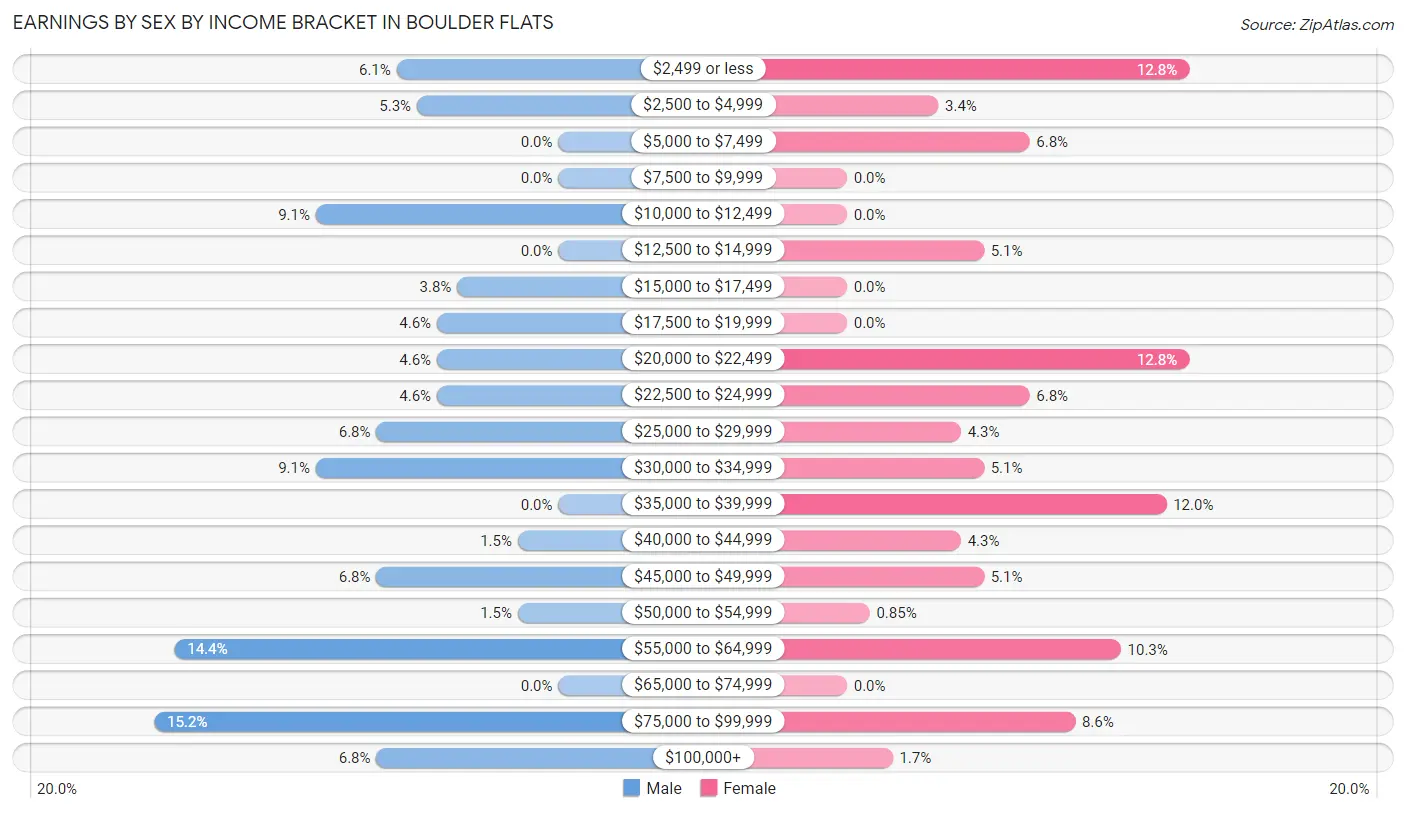
Earnings by Sex by Income Bracket in Boulder Flats
The most common earnings brackets in Boulder Flats are $75,000 to $99,999 for men (20 | 15.1%) and $2,499 or less for women (15 | 12.8%).
| Income | Male | Female |
| $2,499 or less | 8 (6.1%) | 15 (12.8%) |
| $2,500 to $4,999 | 7 (5.3%) | 4 (3.4%) |
| $5,000 to $7,499 | 0 (0.0%) | 8 (6.8%) |
| $7,500 to $9,999 | 0 (0.0%) | 0 (0.0%) |
| $10,000 to $12,499 | 12 (9.1%) | 0 (0.0%) |
| $12,500 to $14,999 | 0 (0.0%) | 6 (5.1%) |
| $15,000 to $17,499 | 5 (3.8%) | 0 (0.0%) |
| $17,500 to $19,999 | 6 (4.5%) | 0 (0.0%) |
| $20,000 to $22,499 | 6 (4.5%) | 15 (12.8%) |
| $22,500 to $24,999 | 6 (4.5%) | 8 (6.8%) |
| $25,000 to $29,999 | 9 (6.8%) | 5 (4.3%) |
| $30,000 to $34,999 | 12 (9.1%) | 6 (5.1%) |
| $35,000 to $39,999 | 0 (0.0%) | 14 (12.0%) |
| $40,000 to $44,999 | 2 (1.5%) | 5 (4.3%) |
| $45,000 to $49,999 | 9 (6.8%) | 6 (5.1%) |
| $50,000 to $54,999 | 2 (1.5%) | 1 (0.9%) |
| $55,000 to $64,999 | 19 (14.4%) | 12 (10.3%) |
| $65,000 to $74,999 | 0 (0.0%) | 0 (0.0%) |
| $75,000 to $99,999 | 20 (15.1%) | 10 (8.6%) |
| $100,000+ | 9 (6.8%) | 2 (1.7%) |
| Total | 132 (100.0%) | 117 (100.0%) |
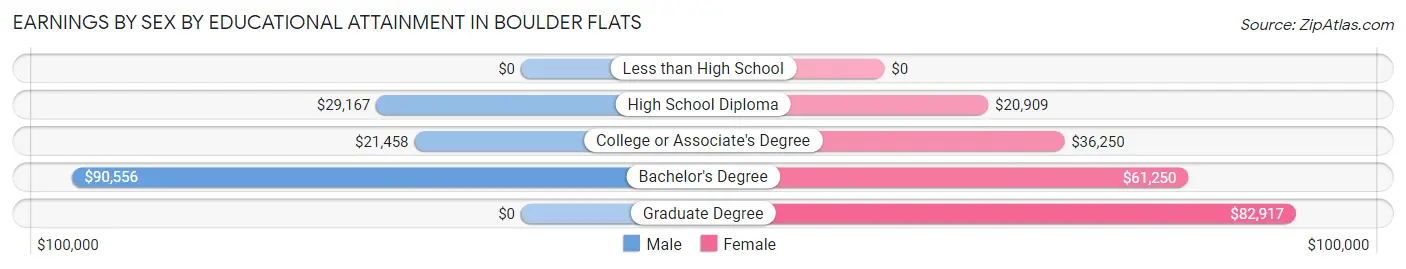
Earnings by Sex by Educational Attainment in Boulder Flats
Average earnings in Boulder Flats are $34,896 for men and $34,375 for women, a difference of 1.5%. Men with an educational attainment of bachelor's degree enjoy the highest average annual earnings of $90,556, while those with college or associate's degree education earn the least with $21,458. Women with an educational attainment of graduate degree earn the most with the average annual earnings of $82,917, while those with high school diploma education have the smallest earnings of $20,909.
| Educational Attainment | Male Income | Female Income |
| Less than High School | - | - |
| High School Diploma | $29,167 | $20,909 |
| College or Associate's Degree | $21,458 | $36,250 |
| Bachelor's Degree | $90,556 | $61,250 |
| Graduate Degree | - | - |
| Total | $34,896 | $34,375 |
Family Income in Boulder Flats
Family Income Brackets in Boulder Flats
According to the Boulder Flats family income data, there are 27 families falling into the $50,000 to $74,999 income range, which is the most common income bracket and makes up 27.6% of all families.
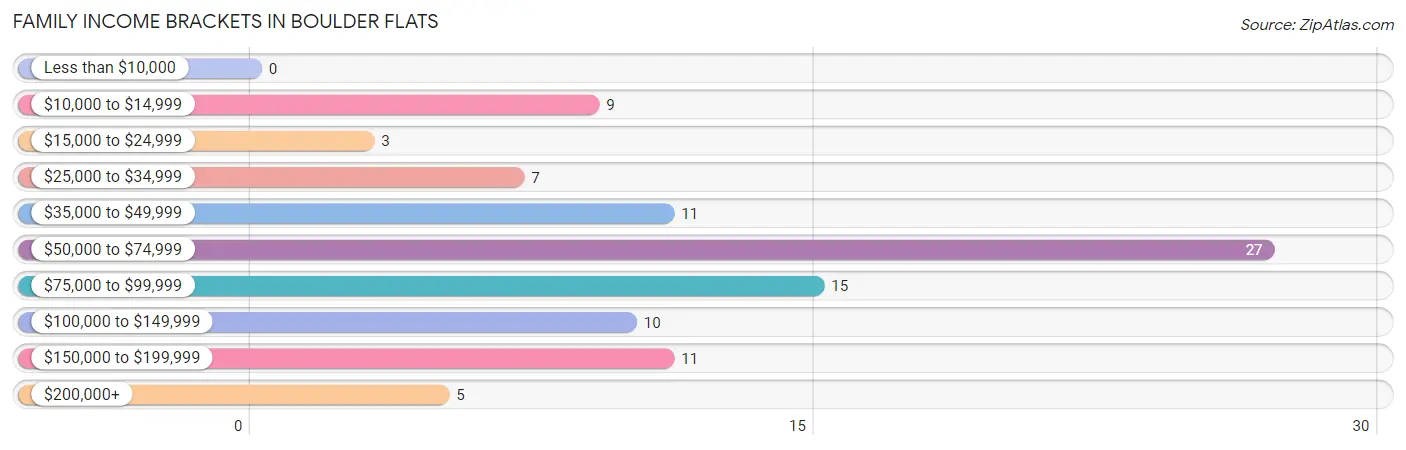
| Income Bracket | # Families | % Families |
| Less than $10,000 | 0 | 0.0% |
| $10,000 to $14,999 | 9 | 9.2% |
| $15,000 to $24,999 | 3 | 3.1% |
| $25,000 to $34,999 | 7 | 7.1% |
| $35,000 to $49,999 | 11 | 11.2% |
| $50,000 to $74,999 | 27 | 27.6% |
| $75,000 to $99,999 | 15 | 15.3% |
| $100,000 to $149,999 | 10 | 10.2% |
| $150,000 to $199,999 | 11 | 11.2% |
| $200,000+ | 5 | 5.1% |
Family Income by Famaliy Size in Boulder Flats
3-person families (20 | 20.4%) account for the highest median family income in Boulder Flats with $71,875 per family, while 3-person families (20 | 20.4%) have the highest median income of $23,958 per family member.
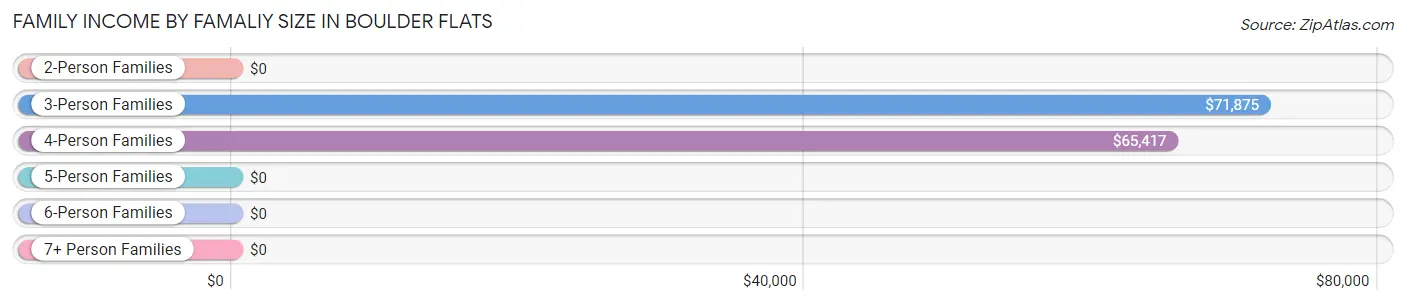
| Income Bracket | # Families | Median Income |
| 2-Person Families | 41 (41.8%) | $0 |
| 3-Person Families | 20 (20.4%) | $71,875 |
| 4-Person Families | 13 (13.3%) | $65,417 |
| 5-Person Families | 11 (11.2%) | $0 |
| 6-Person Families | 7 (7.1%) | $0 |
| 7+ Person Families | 6 (6.1%) | $0 |
| Total | 98 (100.0%) | $68,750 |
Family Income by Number of Earners in Boulder Flats
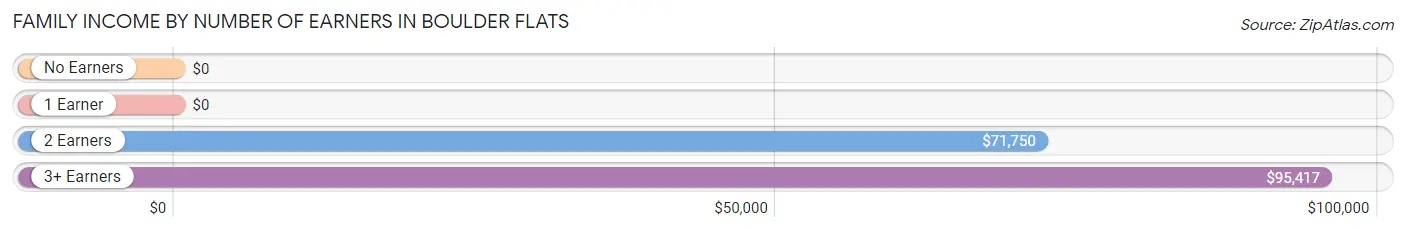
| Number of Earners | # Families | Median Income |
| No Earners | 21 (21.4%) | $0 |
| 1 Earner | 17 (17.3%) | $0 |
| 2 Earners | 47 (48.0%) | $71,750 |
| 3+ Earners | 13 (13.3%) | $95,417 |
| Total | 98 (100.0%) | $68,750 |
Household Income in Boulder Flats
Household Income Brackets in Boulder Flats
With 33 households falling in the category, the $50,000 to $74,999 income range is the most frequent in Boulder Flats, accounting for 22.0% of all households. In contrast, only 5 households (3.3%) fall into the $200,000+ income bracket, making it the least populous group.
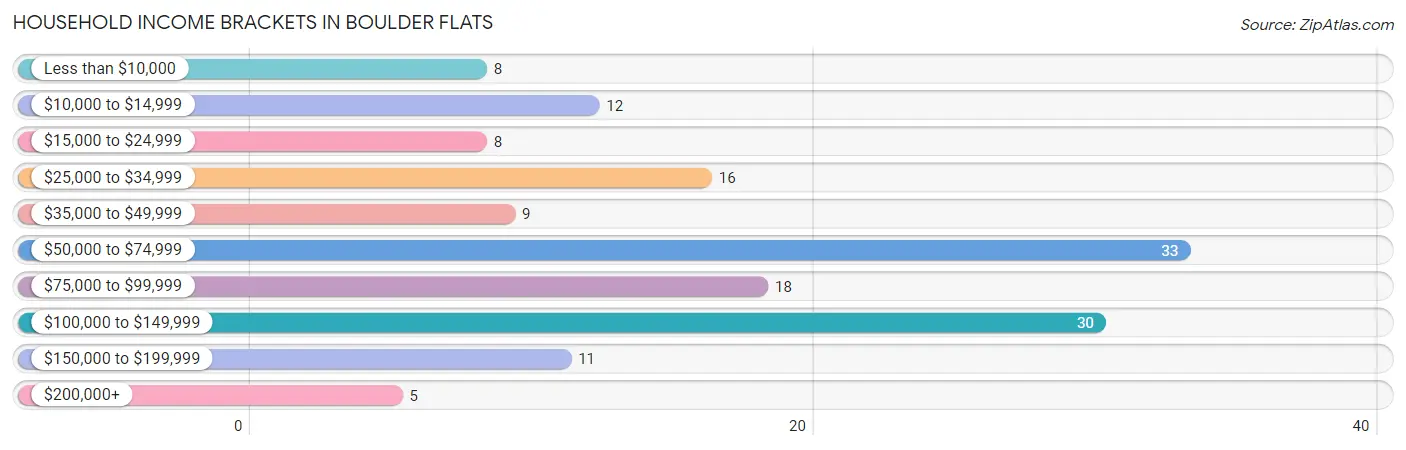
| Income Bracket | # Households | % Households |
| Less than $10,000 | 8 | 5.3% |
| $10,000 to $14,999 | 12 | 8.0% |
| $15,000 to $24,999 | 8 | 5.3% |
| $25,000 to $34,999 | 16 | 10.7% |
| $35,000 to $49,999 | 9 | 6.0% |
| $50,000 to $74,999 | 33 | 22.0% |
| $75,000 to $99,999 | 18 | 12.0% |
| $100,000 to $149,999 | 30 | 20.0% |
| $150,000 to $199,999 | 11 | 7.3% |
| $200,000+ | 5 | 3.3% |
Household Income by Householder Age in Boulder Flats
The median household income in Boulder Flats is $68,333, with the highest median household income of $71,667 found in the 25 to 44 years age bracket for the primary householder. A total of 20 households (13.3%) fall into this category. Meanwhile, the 15 to 24 years age bracket for the primary householder has the lowest median household income of $0, with 5 households (3.3%) in this group.
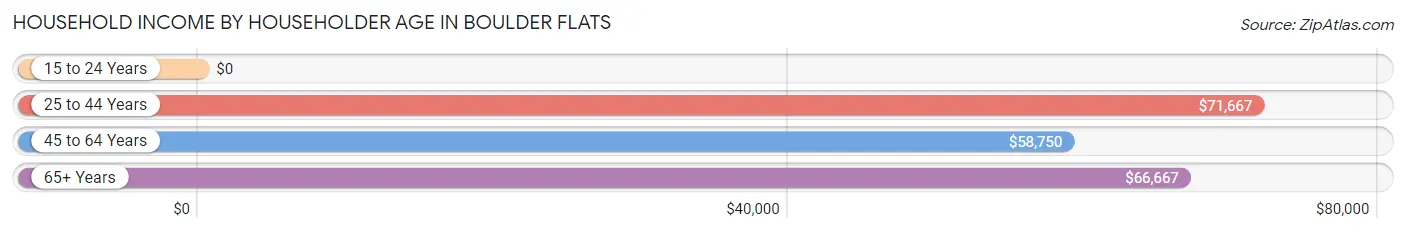
| Income Bracket | # Households | Median Income |
| 15 to 24 Years | 5 (3.3%) | $0 |
| 25 to 44 Years | 20 (13.3%) | $71,667 |
| 45 to 64 Years | 55 (36.7%) | $58,750 |
| 65+ Years | 70 (46.7%) | $66,667 |
| Total | 150 (100.0%) | $68,333 |
Poverty in Boulder Flats
Income Below Poverty by Sex and Age in Boulder Flats
With 26.3% poverty level for males and 22.0% for females among the residents of Boulder Flats, 5 year old males and under 5 year old females are the most vulnerable to poverty, with 3 males (100.0%) and 3 females (100.0%) in their respective age groups living below the poverty level.
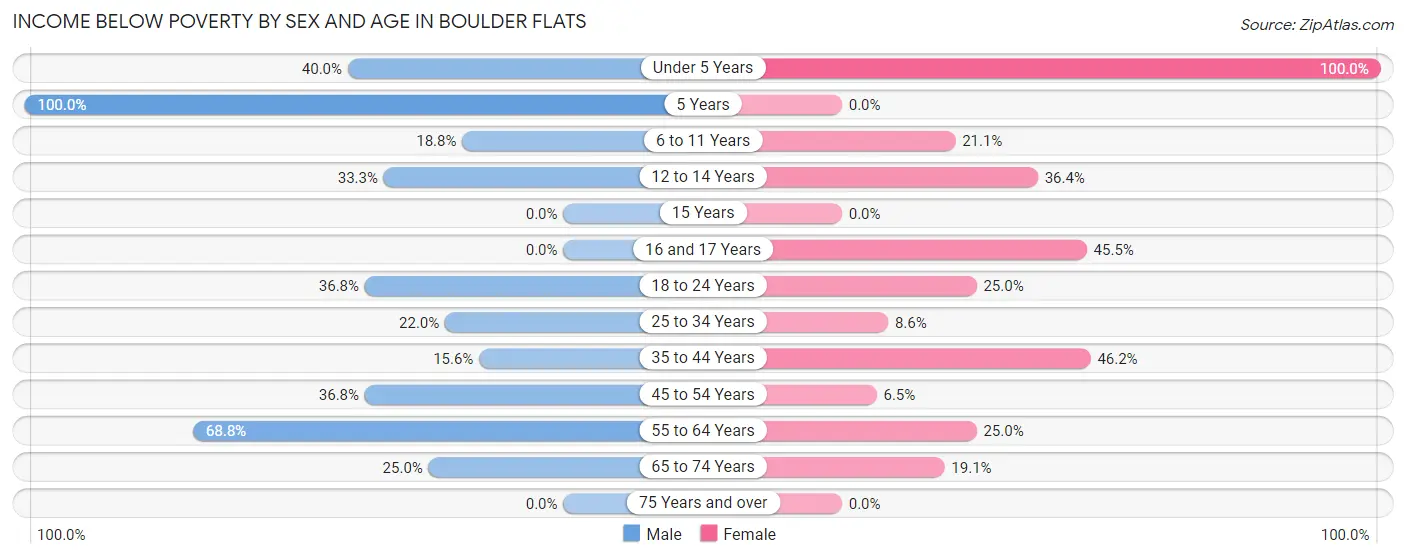
| Age Bracket | Male | Female |
| Under 5 Years | 2 (40.0%) | 3 (100.0%) |
| 5 Years | 3 (100.0%) | 0 (0.0%) |
| 6 to 11 Years | 3 (18.8%) | 8 (21.0%) |
| 12 to 14 Years | 9 (33.3%) | 4 (36.4%) |
| 15 Years | 0 (0.0%) | 0 (0.0%) |
| 16 and 17 Years | 0 (0.0%) | 5 (45.5%) |
| 18 to 24 Years | 7 (36.8%) | 3 (25.0%) |
| 25 to 34 Years | 9 (22.0%) | 3 (8.6%) |
| 35 to 44 Years | 5 (15.6%) | 12 (46.2%) |
| 45 to 54 Years | 7 (36.8%) | 2 (6.5%) |
| 55 to 64 Years | 11 (68.8%) | 11 (25.0%) |
| 65 to 74 Years | 12 (25.0%) | 4 (19.1%) |
| 75 Years and over | 0 (0.0%) | 0 (0.0%) |
| Total | 68 (26.3%) | 55 (22.0%) |
Income Above Poverty by Sex and Age in Boulder Flats
According to the poverty statistics in Boulder Flats, males aged 15 years and females aged 15 years are the age groups that are most secure financially, with 100.0% of males and 100.0% of females in these age groups living above the poverty line.
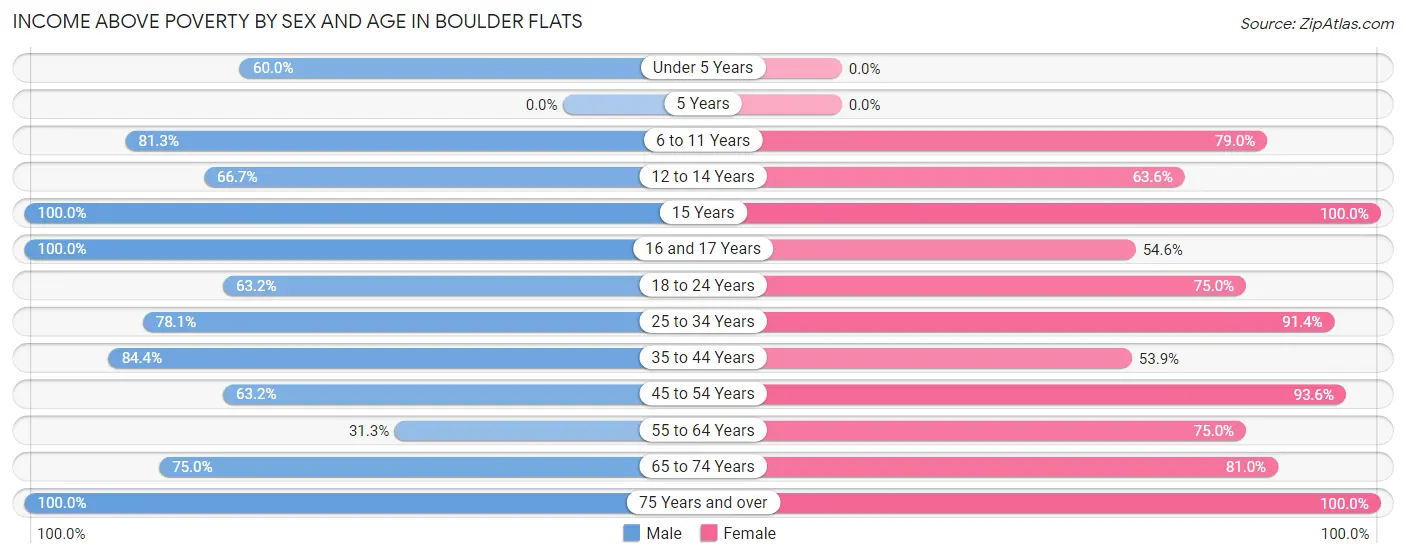
| Age Bracket | Male | Female |
| Under 5 Years | 3 (60.0%) | 0 (0.0%) |
| 5 Years | 0 (0.0%) | 0 (0.0%) |
| 6 to 11 Years | 13 (81.2%) | 30 (78.9%) |
| 12 to 14 Years | 18 (66.7%) | 7 (63.6%) |
| 15 Years | 3 (100.0%) | 3 (100.0%) |
| 16 and 17 Years | 14 (100.0%) | 6 (54.5%) |
| 18 to 24 Years | 12 (63.2%) | 9 (75.0%) |
| 25 to 34 Years | 32 (78.0%) | 32 (91.4%) |
| 35 to 44 Years | 27 (84.4%) | 14 (53.8%) |
| 45 to 54 Years | 12 (63.2%) | 29 (93.5%) |
| 55 to 64 Years | 5 (31.2%) | 33 (75.0%) |
| 65 to 74 Years | 36 (75.0%) | 17 (80.9%) |
| 75 Years and over | 16 (100.0%) | 15 (100.0%) |
| Total | 191 (73.8%) | 195 (78.0%) |
Income Below Poverty Among Married-Couple Families in Boulder Flats
The poverty statistics for married-couple families in Boulder Flats show that 18.0% or 9 of the total 50 families live below the poverty line. Families with no children have the highest poverty rate of 25.7%, comprising of 9 families. On the other hand, families with 1 or 2 children have the lowest poverty rate of 0.0%, which includes 0 families.
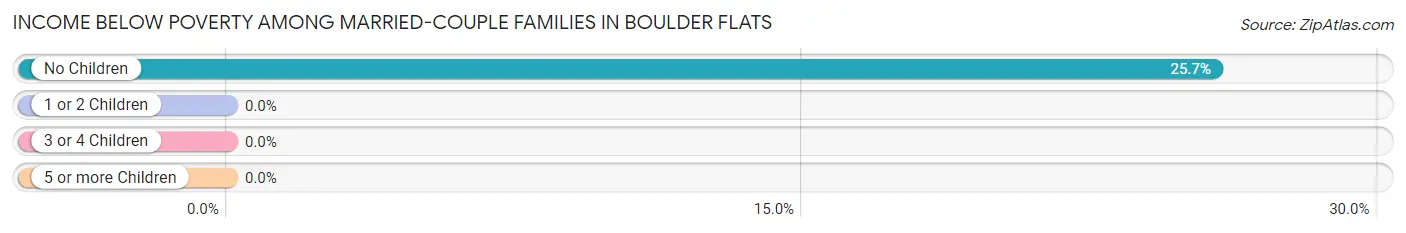
| Children | Above Poverty | Below Poverty |
| No Children | 26 (74.3%) | 9 (25.7%) |
| 1 or 2 Children | 11 (100.0%) | 0 (0.0%) |
| 3 or 4 Children | 4 (100.0%) | 0 (0.0%) |
| 5 or more Children | 0 (0.0%) | 0 (0.0%) |
| Total | 41 (82.0%) | 9 (18.0%) |
Income Below Poverty Among Single-Parent Households in Boulder Flats
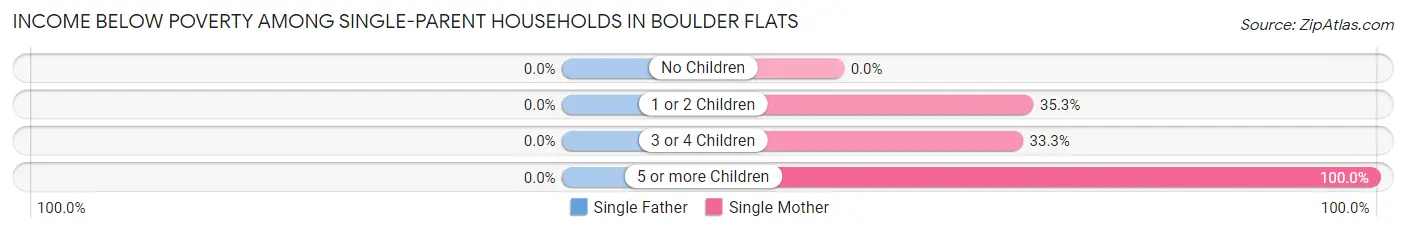
| Children | Single Father | Single Mother |
| No Children | 0 (0.0%) | 0 (0.0%) |
| 1 or 2 Children | 0 (0.0%) | 6 (35.3%) |
| 3 or 4 Children | 0 (0.0%) | 2 (33.3%) |
| 5 or more Children | 0 (0.0%) | 4 (100.0%) |
| Total | 0 (0.0%) | 12 (30.8%) |
Income Below Poverty Among Married-Couple vs Single-Parent Households in Boulder Flats
The poverty data for Boulder Flats shows that 9 of the married-couple family households (18.0%) and 12 of the single-parent households (25.0%) are living below the poverty level. Within the married-couple family households, those with no children have the highest poverty rate, with 9 households (25.7%) falling below the poverty line. Among the single-parent households, those with 5 or more children have the highest poverty rate, with 4 household (100.0%) living below poverty.
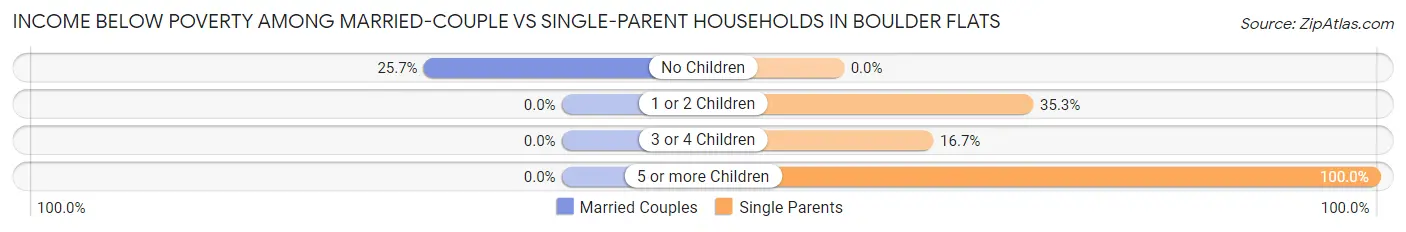
| Children | Married-Couple Families | Single-Parent Households |
| No Children | 9 (25.7%) | 0 (0.0%) |
| 1 or 2 Children | 0 (0.0%) | 6 (35.3%) |
| 3 or 4 Children | 0 (0.0%) | 2 (16.7%) |
| 5 or more Children | 0 (0.0%) | 4 (100.0%) |
| Total | 9 (18.0%) | 12 (25.0%) |
Race in Boulder Flats
The most populous races in Boulder Flats are Native / Alaskan (366 | 71.4%), White / Caucasian (118 | 23.0%), and Hispanic or Latino (29 | 5.7%).
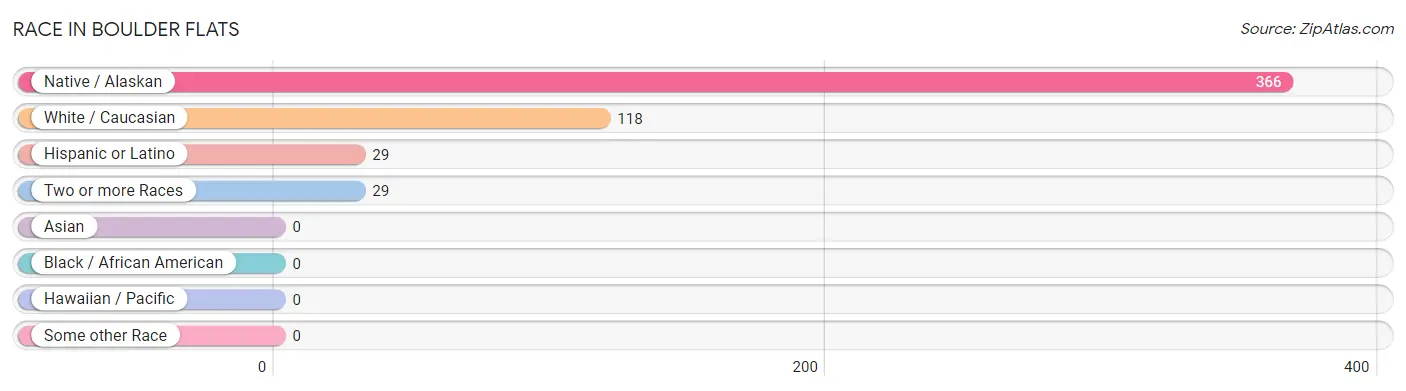
| Race | # Population | % Population |
| Asian | 0 | 0.0% |
| Black / African American | 0 | 0.0% |
| Hawaiian / Pacific | 0 | 0.0% |
| Hispanic or Latino | 29 | 5.7% |
| Native / Alaskan | 366 | 71.4% |
| White / Caucasian | 118 | 23.0% |
| Two or more Races | 29 | 5.7% |
| Some other Race | 0 | 0.0% |
| Total | 513 | 100.0% |
Ancestry in Boulder Flats
The most populous ancestries reported in Boulder Flats are Shoshone (216 | 42.1%), Arapaho (73 | 14.2%), German (52 | 10.1%), Irish (28 | 5.5%), and Apache (26 | 5.1%), together accounting for 77.0% of all Boulder Flats residents.
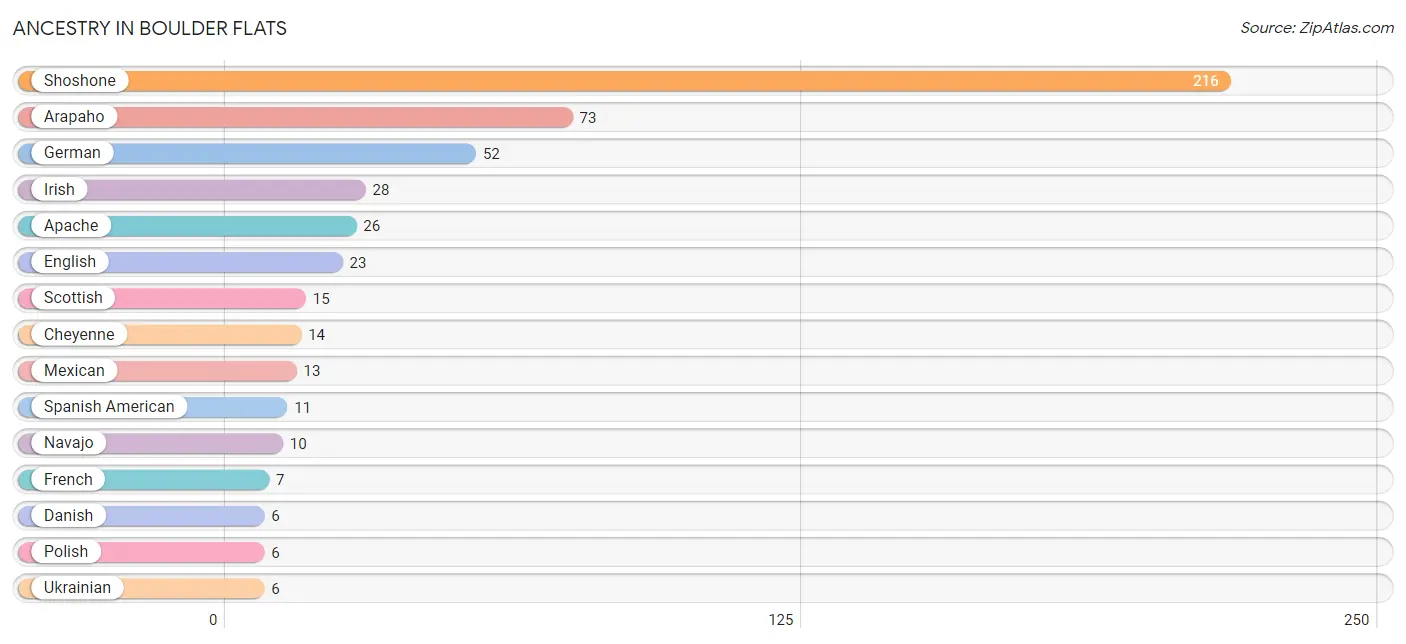
| Ancestry | # Population | % Population |
| Apache | 26 | 5.1% |
| Arapaho | 73 | 14.2% |
| Cherokee | 3 | 0.6% |
| Cheyenne | 14 | 2.7% |
| Danish | 6 | 1.2% |
| English | 23 | 4.5% |
| French | 7 | 1.4% |
| German | 52 | 10.1% |
| Irish | 28 | 5.5% |
| Mexican | 13 | 2.5% |
| Navajo | 10 | 1.9% |
| Norwegian | 4 | 0.8% |
| Polish | 6 | 1.2% |
| Scottish | 15 | 2.9% |
| Shoshone | 216 | 42.1% |
| Sioux | 5 | 1.0% |
| Spanish American | 11 | 2.1% |
| Ukrainian | 6 | 1.2% | View All 18 Rows |
Immigrants in Boulder Flats

| Immigration Origin | # Population | % Population | View All 0 Rows |
Sex and Age in Boulder Flats
Sex and Age in Boulder Flats
The most populous age groups in Boulder Flats are 10 to 14 Years (39 | 15.1%) for men and 5 to 9 Years (34 | 13.4%) for women.
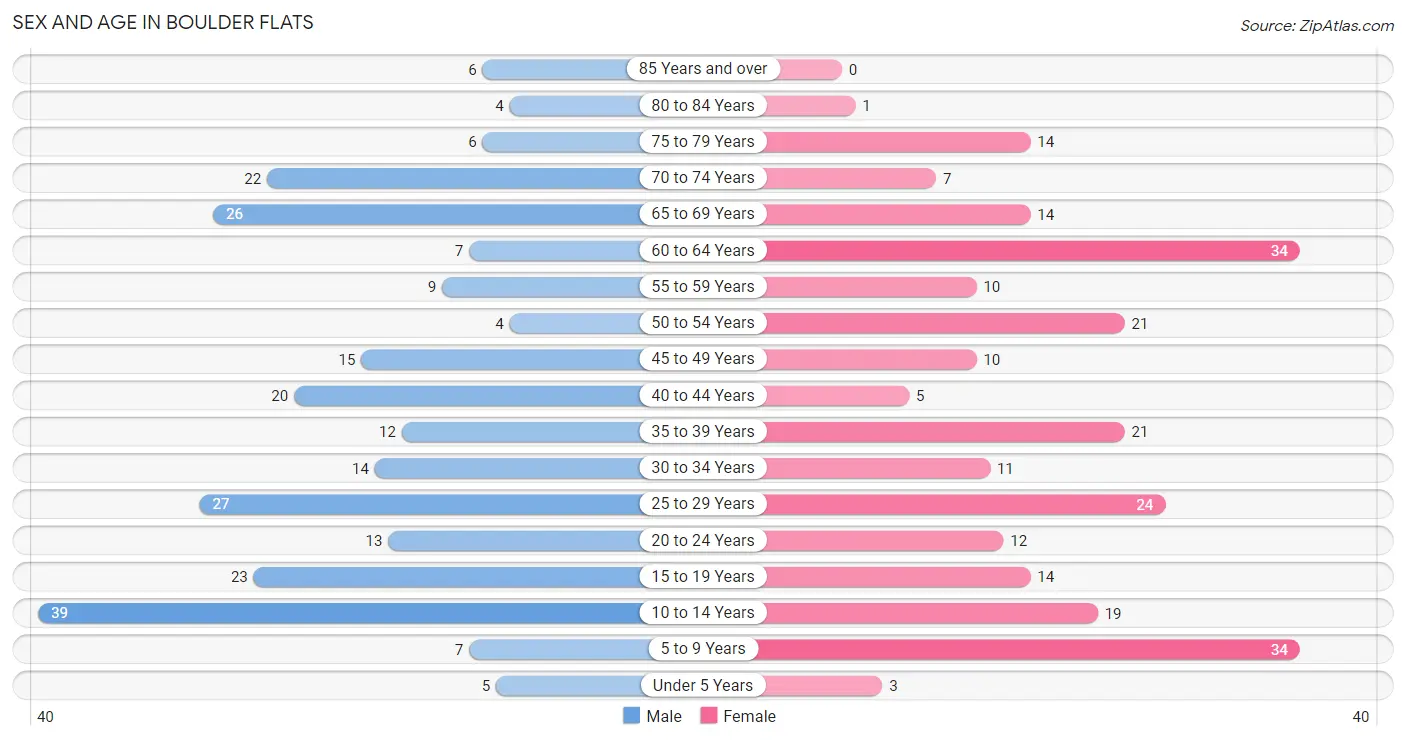
| Age Bracket | Male | Female |
| Under 5 Years | 5 (1.9%) | 3 (1.2%) |
| 5 to 9 Years | 7 (2.7%) | 34 (13.4%) |
| 10 to 14 Years | 39 (15.1%) | 19 (7.5%) |
| 15 to 19 Years | 23 (8.9%) | 14 (5.5%) |
| 20 to 24 Years | 13 (5.0%) | 12 (4.7%) |
| 25 to 29 Years | 27 (10.4%) | 24 (9.5%) |
| 30 to 34 Years | 14 (5.4%) | 11 (4.3%) |
| 35 to 39 Years | 12 (4.6%) | 21 (8.3%) |
| 40 to 44 Years | 20 (7.7%) | 5 (2.0%) |
| 45 to 49 Years | 15 (5.8%) | 10 (3.9%) |
| 50 to 54 Years | 4 (1.5%) | 21 (8.3%) |
| 55 to 59 Years | 9 (3.5%) | 10 (3.9%) |
| 60 to 64 Years | 7 (2.7%) | 34 (13.4%) |
| 65 to 69 Years | 26 (10.0%) | 14 (5.5%) |
| 70 to 74 Years | 22 (8.5%) | 7 (2.8%) |
| 75 to 79 Years | 6 (2.3%) | 14 (5.5%) |
| 80 to 84 Years | 4 (1.5%) | 1 (0.4%) |
| 85 Years and over | 6 (2.3%) | 0 (0.0%) |
| Total | 259 (100.0%) | 254 (100.0%) |
Families and Households in Boulder Flats
Median Family Size in Boulder Flats
The median family size in Boulder Flats is 4.19 persons per family, with single male/father families (9 | 9.2%) accounting for the largest median family size of 6.11 persons per family. On the other hand, married-couple families (50 | 51.0%) represent the smallest median family size with 3.46 persons per family.
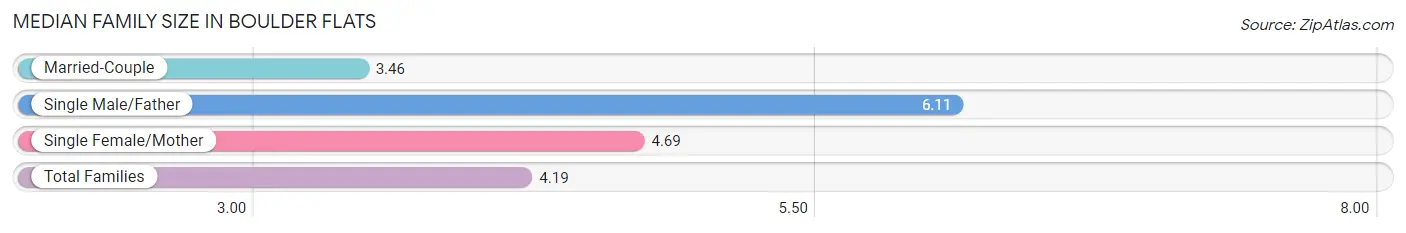
| Family Type | # Families | Family Size |
| Married-Couple | 50 (51.0%) | 3.46 |
| Single Male/Father | 9 (9.2%) | 6.11 |
| Single Female/Mother | 39 (39.8%) | 4.69 |
| Total Families | 98 (100.0%) | 4.19 |
Median Household Size in Boulder Flats
The median household size in Boulder Flats is 3.42 persons per household, with single male/father households (9 | 6.0%) accounting for the largest median household size of 7.44 persons per household. non-family households (52 | 34.7%) represent the smallest median household size with 1.52 persons per household.
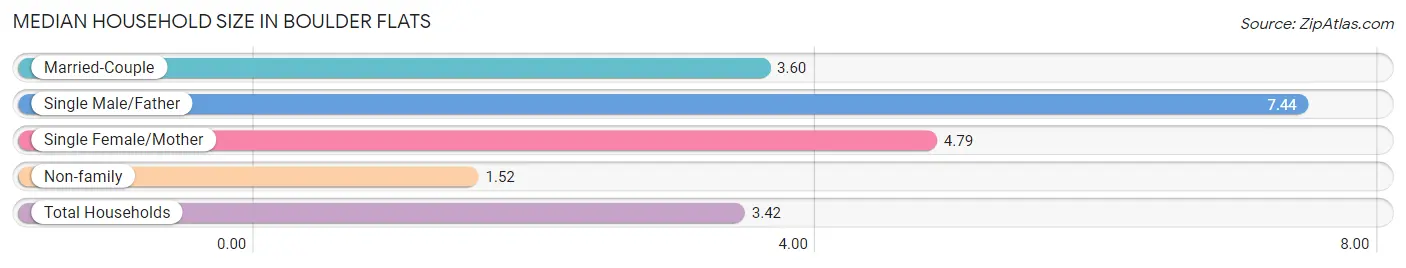
| Household Type | # Households | Household Size |
| Married-Couple | 50 (33.3%) | 3.60 |
| Single Male/Father | 9 (6.0%) | 7.44 |
| Single Female/Mother | 39 (26.0%) | 4.79 |
| Non-family | 52 (34.7%) | 1.52 |
| Total Households | 150 (100.0%) | 3.42 |
Household Size by Marriage Status in Boulder Flats
Out of a total of 150 households in Boulder Flats, 98 (65.3%) are family households, while 52 (34.7%) are nonfamily households. The most numerous type of family households are 2-person households, comprising 41, and the most common type of nonfamily households are 1-person households, comprising 44.
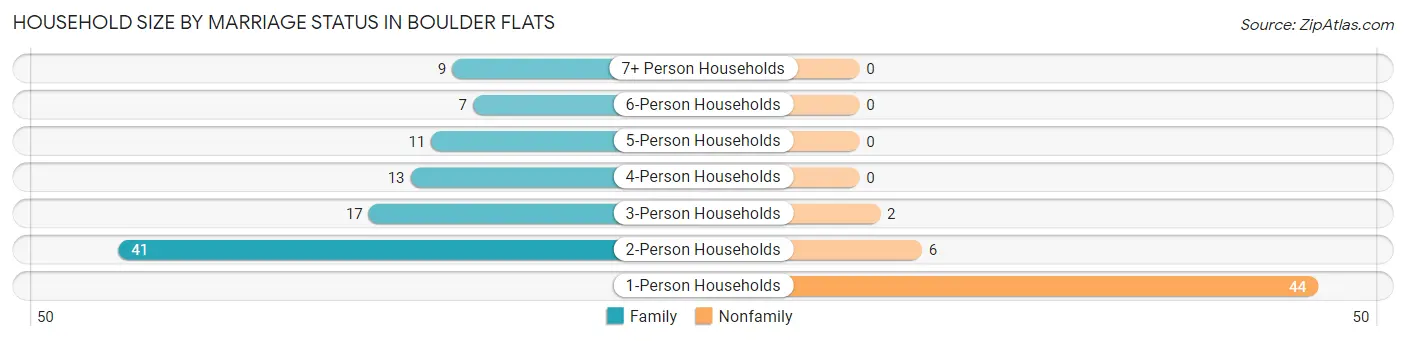
| Household Size | Family Households | Nonfamily Households |
| 1-Person Households | - | 44 (29.3%) |
| 2-Person Households | 41 (27.3%) | 6 (4.0%) |
| 3-Person Households | 17 (11.3%) | 2 (1.3%) |
| 4-Person Households | 13 (8.7%) | 0 (0.0%) |
| 5-Person Households | 11 (7.3%) | 0 (0.0%) |
| 6-Person Households | 7 (4.7%) | 0 (0.0%) |
| 7+ Person Households | 9 (6.0%) | 0 (0.0%) |
| Total | 98 (65.3%) | 52 (34.7%) |
Female Fertility in Boulder Flats
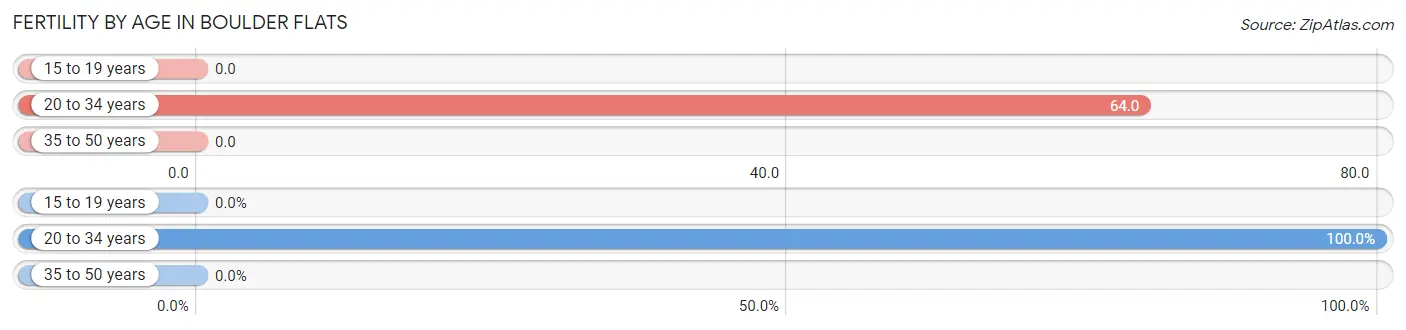
Fertility by Age in Boulder Flats
Average fertility rate in Boulder Flats is 28.0 births per 1,000 women. Women in the age bracket of 20 to 34 years have the highest fertility rate with 64.0 births per 1,000 women. Women in the age bracket of 20 to 34 years acount for 100.0% of all women with births.
| Age Bracket | Women with Births | Births / 1,000 Women |
| 15 to 19 years | 0 (0.0%) | 0.0 |
| 20 to 34 years | 3 (100.0%) | 64.0 |
| 35 to 50 years | 0 (0.0%) | 0.0 |
| Total | 3 (100.0%) | 28.0 |
Fertility by Age by Marriage Status in Boulder Flats
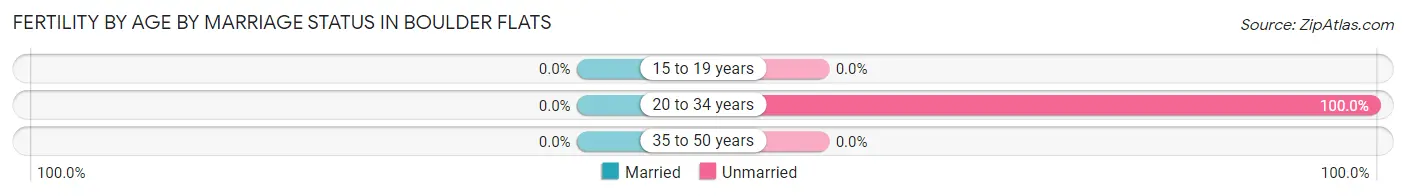
| Age Bracket | Married | Unmarried |
| 15 to 19 years | 0 (0.0%) | 0 (0.0%) |
| 20 to 34 years | 0 (0.0%) | 3 (100.0%) |
| 35 to 50 years | 0 (0.0%) | 0 (0.0%) |
| Total | 0 (0.0%) | 3 (100.0%) |
Fertility by Education in Boulder Flats
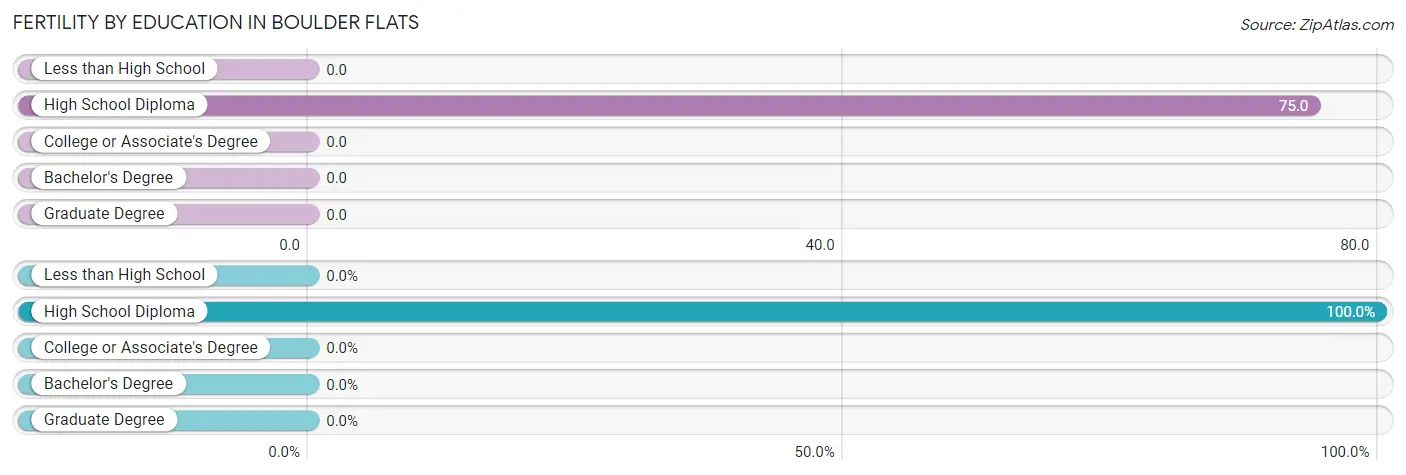
| Educational Attainment | Women with Births | Births / 1,000 Women |
| Less than High School | 0 (0.0%) | 0.0 |
| High School Diploma | 3 (100.0%) | 75.0 |
| College or Associate's Degree | 0 (0.0%) | 0.0 |
| Bachelor's Degree | 0 (0.0%) | 0.0 |
| Graduate Degree | 0 (0.0%) | 0.0 |
| Total | 3 (100.0%) | 28.0 |
Fertility by Education by Marriage Status in Boulder Flats
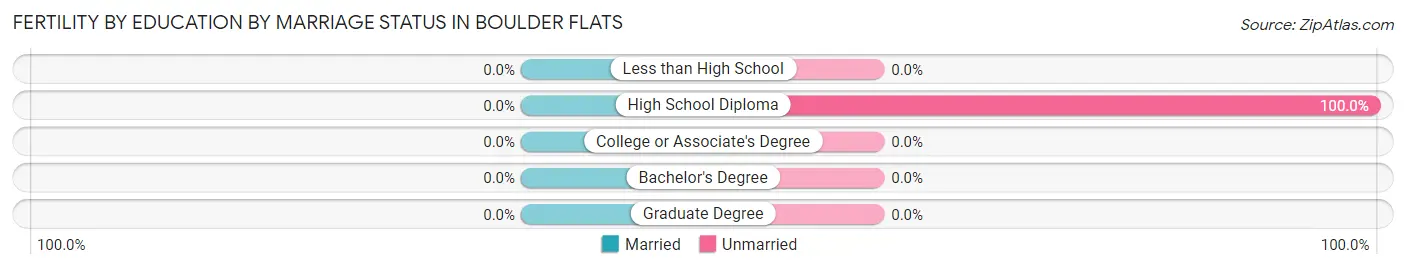
| Educational Attainment | Married | Unmarried |
| Less than High School | 0 (0.0%) | 0 (0.0%) |
| High School Diploma | 0 (0.0%) | 3 (100.0%) |
| College or Associate's Degree | 0 (0.0%) | 0 (0.0%) |
| Bachelor's Degree | 0 (0.0%) | 0 (0.0%) |
| Graduate Degree | 0 (0.0%) | 0 (0.0%) |
| Total | 0 (0.0%) | 3 (100.0%) |
Employment Characteristics in Boulder Flats
Employment by Class of Employer in Boulder Flats
Among the 166 employed individuals in Boulder Flats, local government employees (60 | 36.1%), private company employees (46 | 27.7%), and self-employed (not incorporated) (21 | 12.7%) make up the most common classes of employment.
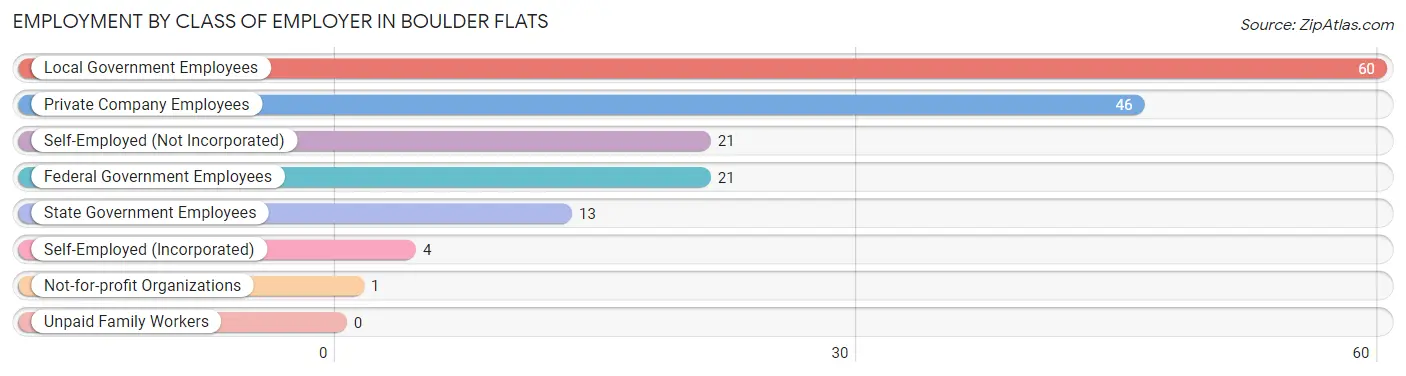
| Employer Class | # Employees | % Employees |
| Private Company Employees | 46 | 27.7% |
| Self-Employed (Incorporated) | 4 | 2.4% |
| Self-Employed (Not Incorporated) | 21 | 12.7% |
| Not-for-profit Organizations | 1 | 0.6% |
| Local Government Employees | 60 | 36.1% |
| State Government Employees | 13 | 7.8% |
| Federal Government Employees | 21 | 12.7% |
| Unpaid Family Workers | 0 | 0.0% |
| Total | 166 | 100.0% |
Employment Status by Age in Boulder Flats
According to the labor force statistics for Boulder Flats, out of the total population over 16 years of age (400), 54.0% or 216 individuals are in the labor force, with 15.3% or 33 of them unemployed. The age group with the highest labor force participation rate is 55 to 59 years, with 100.0% or 19 individuals in the labor force. Within the labor force, the 16 to 19 years age range has the highest percentage of unemployed individuals, with 47.1% or 8 of them being unemployed.
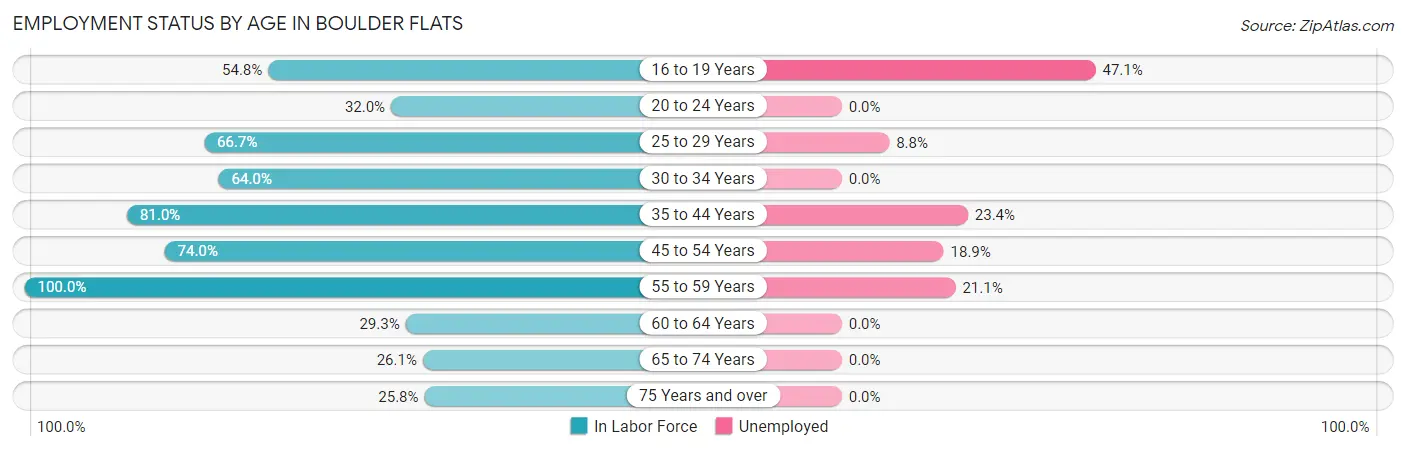
| Age Bracket | In Labor Force | Unemployed |
| 16 to 19 Years | 17 (54.8%) | 8 (47.1%) |
| 20 to 24 Years | 8 (32.0%) | 0 (0.0%) |
| 25 to 29 Years | 34 (66.7%) | 3 (8.8%) |
| 30 to 34 Years | 16 (64.0%) | 0 (0.0%) |
| 35 to 44 Years | 47 (81.0%) | 11 (23.4%) |
| 45 to 54 Years | 37 (74.0%) | 7 (18.9%) |
| 55 to 59 Years | 19 (100.0%) | 4 (21.1%) |
| 60 to 64 Years | 12 (29.3%) | 0 (0.0%) |
| 65 to 74 Years | 18 (26.1%) | 0 (0.0%) |
| 75 Years and over | 8 (25.8%) | 0 (0.0%) |
| Total | 216 (54.0%) | 33 (15.3%) |
Employment Status by Educational Attainment in Boulder Flats
According to labor force statistics for Boulder Flats, 67.6% of individuals (165) out of the total population between 25 and 64 years of age (244) are in the labor force, with 15.2% or 25 of them being unemployed. The group with the highest labor force participation rate are those with the educational attainment of bachelor's degree or higher, with 75.5% or 40 individuals in the labor force. Within the labor force, individuals with less than high school education have the highest percentage of unemployment, with 23.1% or 3 of them being unemployed.
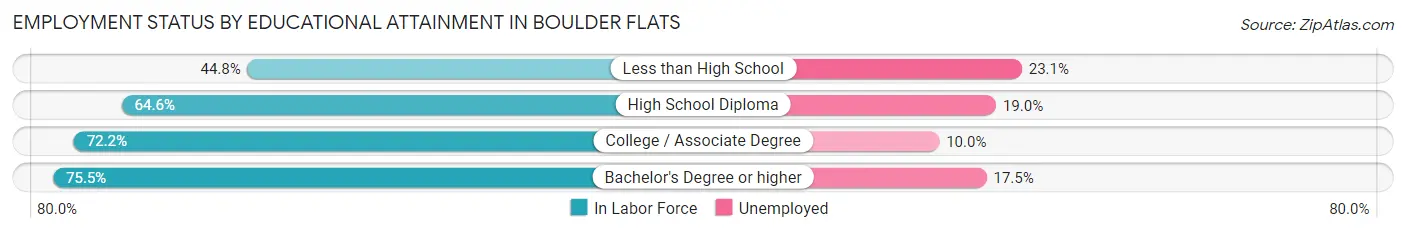
| Educational Attainment | In Labor Force | Unemployed |
| Less than High School | 13 (44.8%) | 7 (23.1%) |
| High School Diploma | 42 (64.6%) | 12 (19.0%) |
| College / Associate Degree | 70 (72.2%) | 10 (10.0%) |
| Bachelor's Degree or higher | 40 (75.5%) | 9 (17.5%) |
| Total | 165 (67.6%) | 37 (15.2%) |
Employment Occupations by Sex in Boulder Flats
Management, Business, Science and Arts Occupations
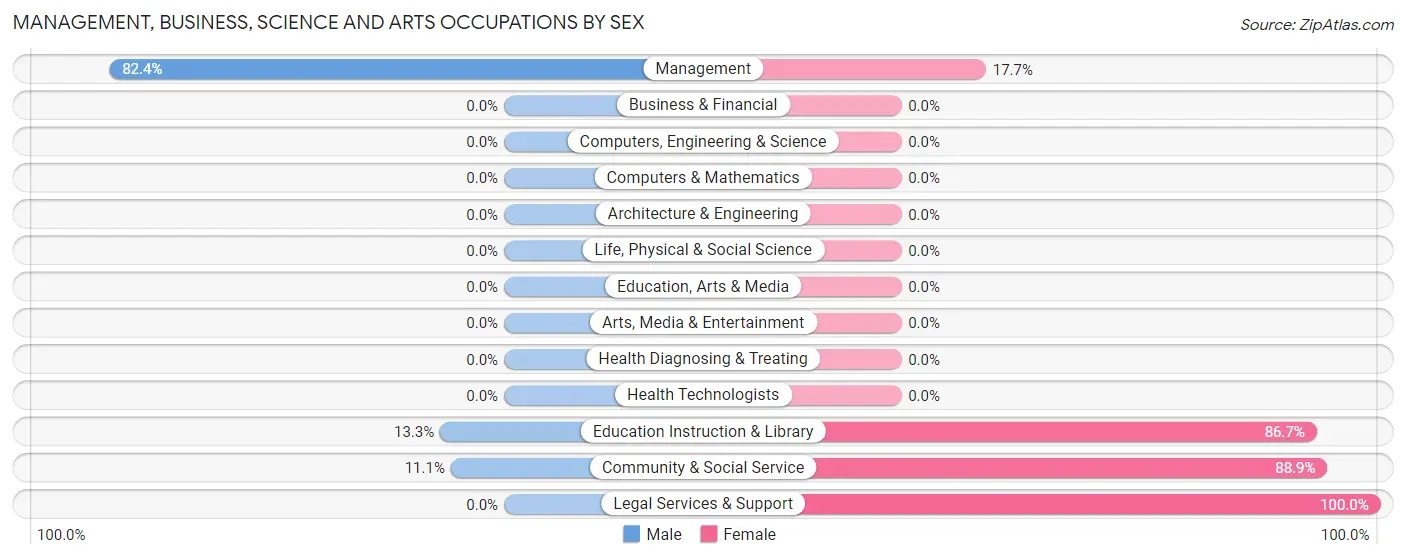
The most common Management, Business, Science and Arts occupations in Boulder Flats are Management (34 | 18.6%), Community & Social Service (18 | 9.8%), Education Instruction & Library (15 | 8.2%), and Legal Services & Support (3 | 1.6%).
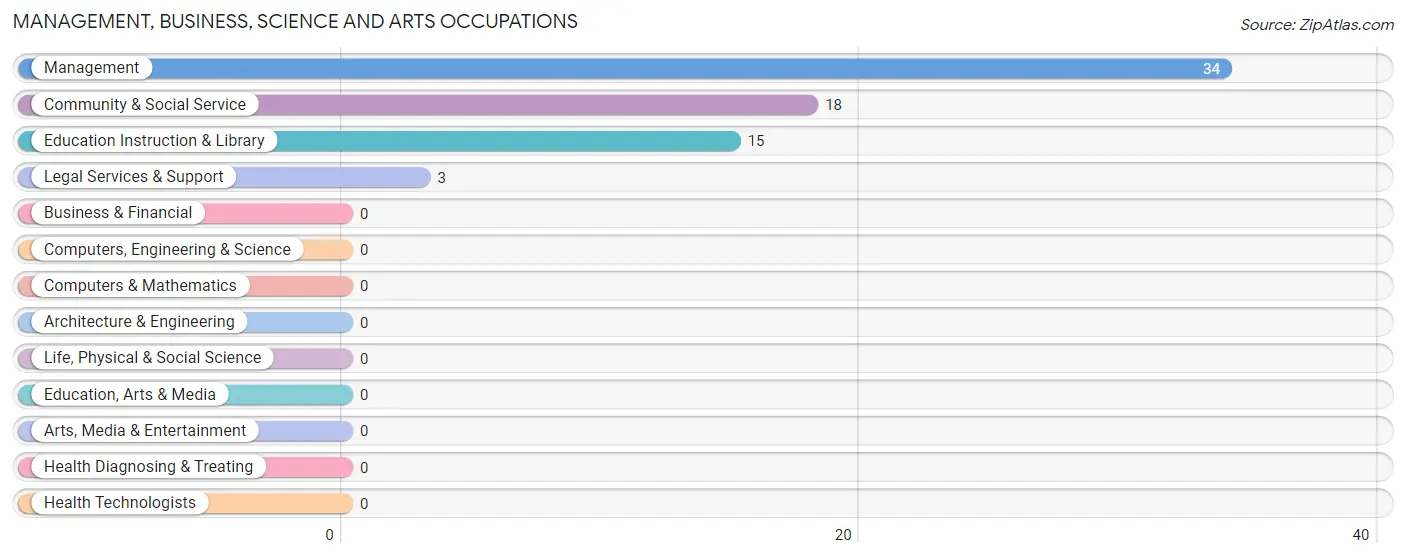
Management, Business, Science and Arts Occupations by Sex
Within the Management, Business, Science and Arts occupations in Boulder Flats, the most male-oriented occupations are Management (82.4%), Education Instruction & Library (13.3%), and Community & Social Service (11.1%), while the most female-oriented occupations are Legal Services & Support (100.0%), Community & Social Service (88.9%), and Education Instruction & Library (86.7%).
| Occupation | Male | Female |
| Management | 28 (82.4%) | 6 (17.6%) |
| Business & Financial | 0 (0.0%) | 0 (0.0%) |
| Computers, Engineering & Science | 0 (0.0%) | 0 (0.0%) |
| Computers & Mathematics | 0 (0.0%) | 0 (0.0%) |
| Architecture & Engineering | 0 (0.0%) | 0 (0.0%) |
| Life, Physical & Social Science | 0 (0.0%) | 0 (0.0%) |
| Community & Social Service | 2 (11.1%) | 16 (88.9%) |
| Education, Arts & Media | 0 (0.0%) | 0 (0.0%) |
| Legal Services & Support | 0 (0.0%) | 3 (100.0%) |
| Education Instruction & Library | 2 (13.3%) | 13 (86.7%) |
| Arts, Media & Entertainment | 0 (0.0%) | 0 (0.0%) |
| Health Diagnosing & Treating | 0 (0.0%) | 0 (0.0%) |
| Health Technologists | 0 (0.0%) | 0 (0.0%) |
| Total (Category) | 30 (57.7%) | 22 (42.3%) |
| Total (Overall) | 84 (45.9%) | 99 (54.1%) |
Services Occupations
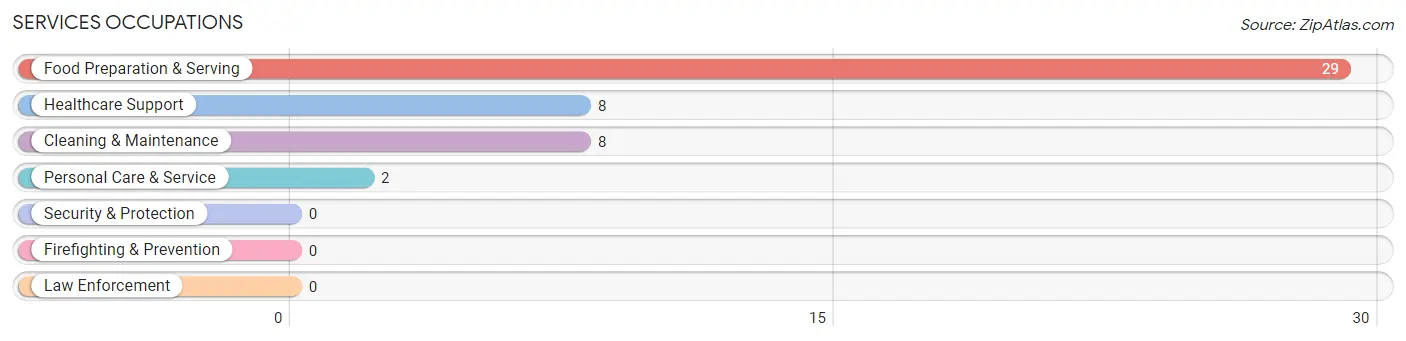
The most common Services occupations in Boulder Flats are Food Preparation & Serving (29 | 15.9%), Healthcare Support (8 | 4.4%), Cleaning & Maintenance (8 | 4.4%), and Personal Care & Service (2 | 1.1%).
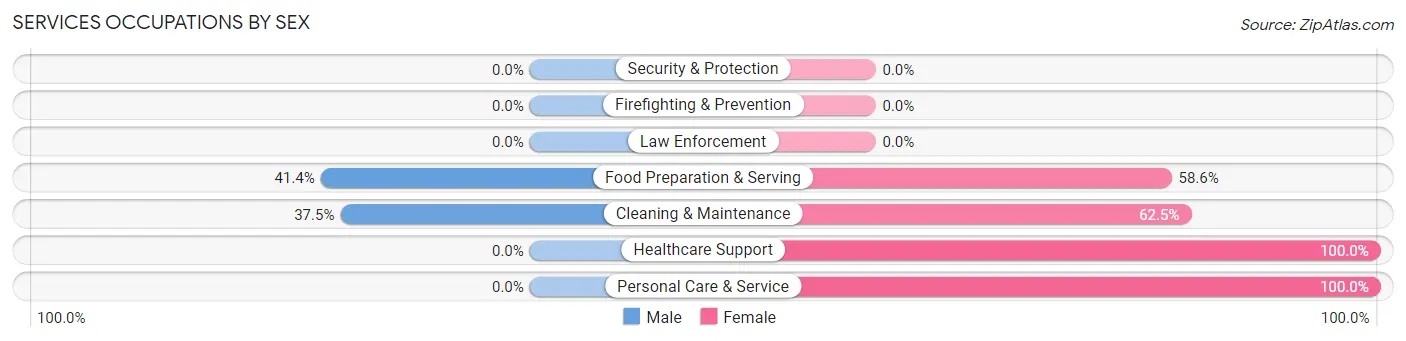
Services Occupations by Sex
Within the Services occupations in Boulder Flats, the most male-oriented occupations are Food Preparation & Serving (41.4%), and Cleaning & Maintenance (37.5%), while the most female-oriented occupations are Healthcare Support (100.0%), Personal Care & Service (100.0%), and Cleaning & Maintenance (62.5%).
| Occupation | Male | Female |
| Healthcare Support | 0 (0.0%) | 8 (100.0%) |
| Security & Protection | 0 (0.0%) | 0 (0.0%) |
| Firefighting & Prevention | 0 (0.0%) | 0 (0.0%) |
| Law Enforcement | 0 (0.0%) | 0 (0.0%) |
| Food Preparation & Serving | 12 (41.4%) | 17 (58.6%) |
| Cleaning & Maintenance | 3 (37.5%) | 5 (62.5%) |
| Personal Care & Service | 0 (0.0%) | 2 (100.0%) |
| Total (Category) | 15 (31.9%) | 32 (68.1%) |
| Total (Overall) | 84 (45.9%) | 99 (54.1%) |
Sales and Office Occupations
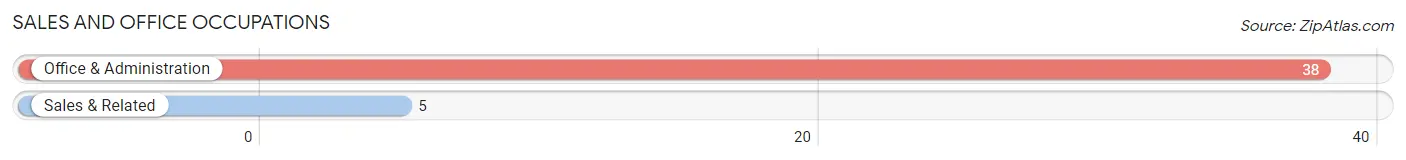
The most common Sales and Office occupations in Boulder Flats are Office & Administration (38 | 20.8%), and Sales & Related (5 | 2.7%).
Sales and Office Occupations by Sex
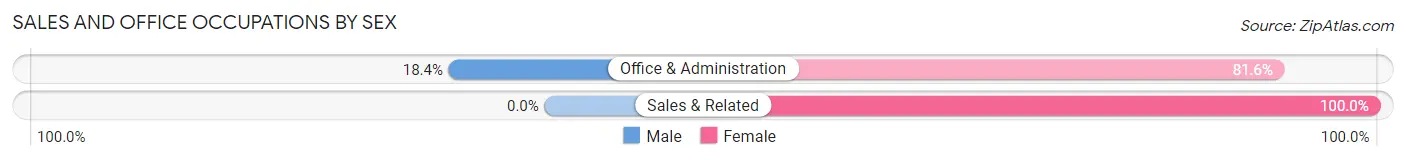
| Occupation | Male | Female |
| Sales & Related | 0 (0.0%) | 5 (100.0%) |
| Office & Administration | 7 (18.4%) | 31 (81.6%) |
| Total (Category) | 7 (16.3%) | 36 (83.7%) |
| Total (Overall) | 84 (45.9%) | 99 (54.1%) |
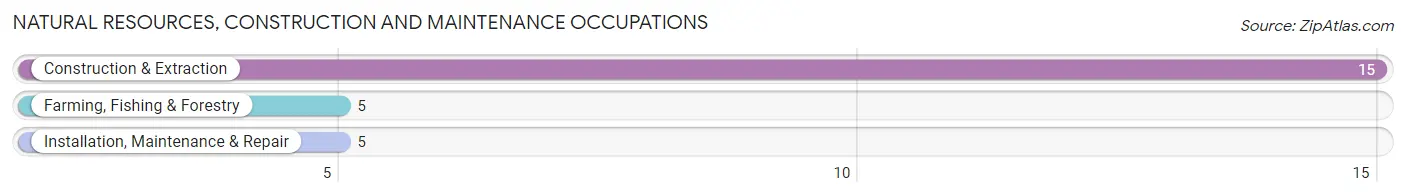
Natural Resources, Construction and Maintenance Occupations
The most common Natural Resources, Construction and Maintenance occupations in Boulder Flats are Construction & Extraction (15 | 8.2%), Farming, Fishing & Forestry (5 | 2.7%), and Installation, Maintenance & Repair (5 | 2.7%).
Natural Resources, Construction and Maintenance Occupations by Sex
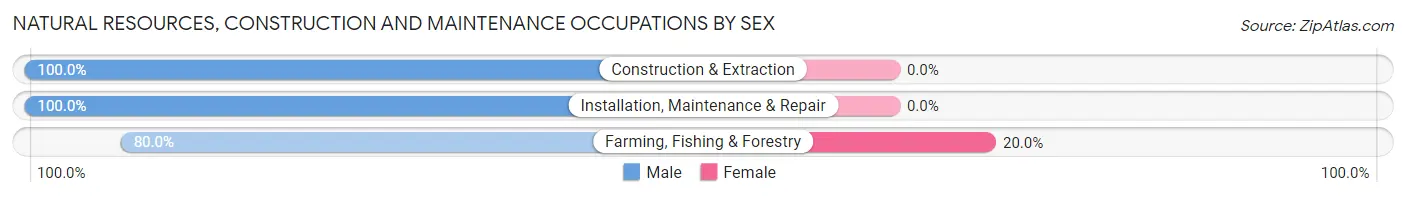
| Occupation | Male | Female |
| Farming, Fishing & Forestry | 4 (80.0%) | 1 (20.0%) |
| Construction & Extraction | 15 (100.0%) | 0 (0.0%) |
| Installation, Maintenance & Repair | 5 (100.0%) | 0 (0.0%) |
| Total (Category) | 24 (96.0%) | 1 (4.0%) |
| Total (Overall) | 84 (45.9%) | 99 (54.1%) |
Production, Transportation and Moving Occupations
The most common Production, Transportation and Moving occupations in Boulder Flats are Transportation (10 | 5.5%), and Production (6 | 3.3%).
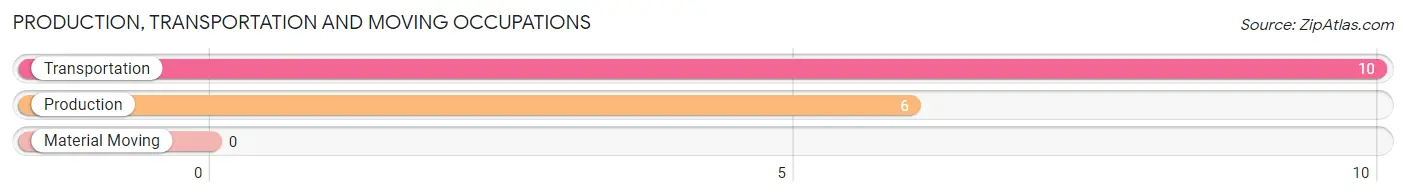
Production, Transportation and Moving Occupations by Sex
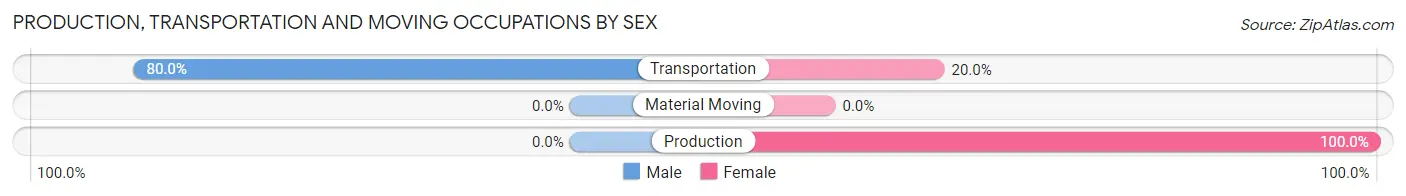
| Occupation | Male | Female |
| Production | 0 (0.0%) | 6 (100.0%) |
| Transportation | 8 (80.0%) | 2 (20.0%) |
| Material Moving | 0 (0.0%) | 0 (0.0%) |
| Total (Category) | 8 (50.0%) | 8 (50.0%) |
| Total (Overall) | 84 (45.9%) | 99 (54.1%) |
Employment Industries by Sex in Boulder Flats
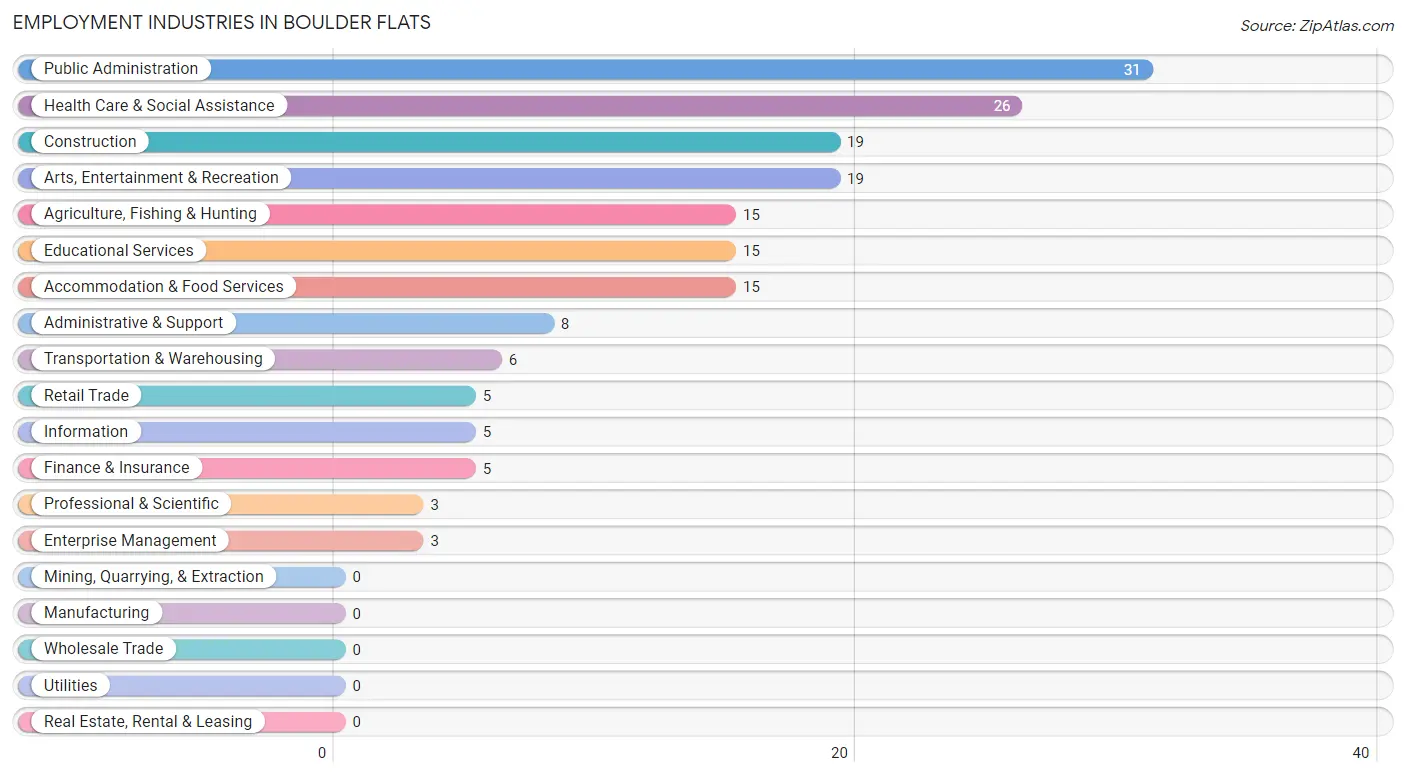
Employment Industries in Boulder Flats
The major employment industries in Boulder Flats include Public Administration (31 | 16.9%), Health Care & Social Assistance (26 | 14.2%), Construction (19 | 10.4%), Arts, Entertainment & Recreation (19 | 10.4%), and Agriculture, Fishing & Hunting (15 | 8.2%).
Employment Industries by Sex in Boulder Flats
The Boulder Flats industries that see more men than women are Construction (100.0%), Transportation & Warehousing (100.0%), and Information (100.0%), whereas the industries that tend to have a higher number of women are Retail Trade (100.0%), Finance & Insurance (100.0%), and Professional & Scientific (100.0%).
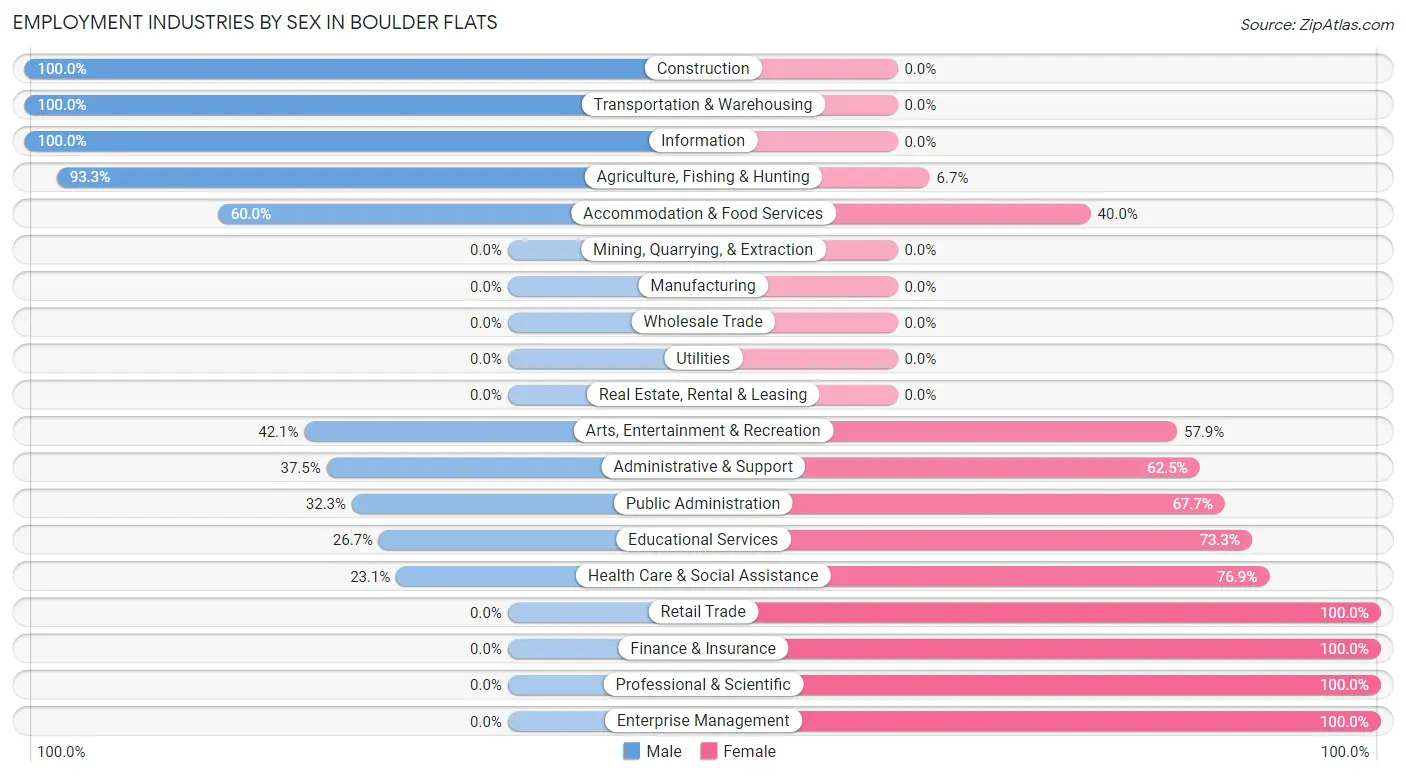
| Industry | Male | Female |
| Agriculture, Fishing & Hunting | 14 (93.3%) | 1 (6.7%) |
| Mining, Quarrying, & Extraction | 0 (0.0%) | 0 (0.0%) |
| Construction | 19 (100.0%) | 0 (0.0%) |
| Manufacturing | 0 (0.0%) | 0 (0.0%) |
| Wholesale Trade | 0 (0.0%) | 0 (0.0%) |
| Retail Trade | 0 (0.0%) | 5 (100.0%) |
| Transportation & Warehousing | 6 (100.0%) | 0 (0.0%) |
| Utilities | 0 (0.0%) | 0 (0.0%) |
| Information | 5 (100.0%) | 0 (0.0%) |
| Finance & Insurance | 0 (0.0%) | 5 (100.0%) |
| Real Estate, Rental & Leasing | 0 (0.0%) | 0 (0.0%) |
| Professional & Scientific | 0 (0.0%) | 3 (100.0%) |
| Enterprise Management | 0 (0.0%) | 3 (100.0%) |
| Administrative & Support | 3 (37.5%) | 5 (62.5%) |
| Educational Services | 4 (26.7%) | 11 (73.3%) |
| Health Care & Social Assistance | 6 (23.1%) | 20 (76.9%) |
| Arts, Entertainment & Recreation | 8 (42.1%) | 11 (57.9%) |
| Accommodation & Food Services | 9 (60.0%) | 6 (40.0%) |
| Public Administration | 10 (32.3%) | 21 (67.7%) |
| Total | 84 (45.9%) | 99 (54.1%) |
Education in Boulder Flats
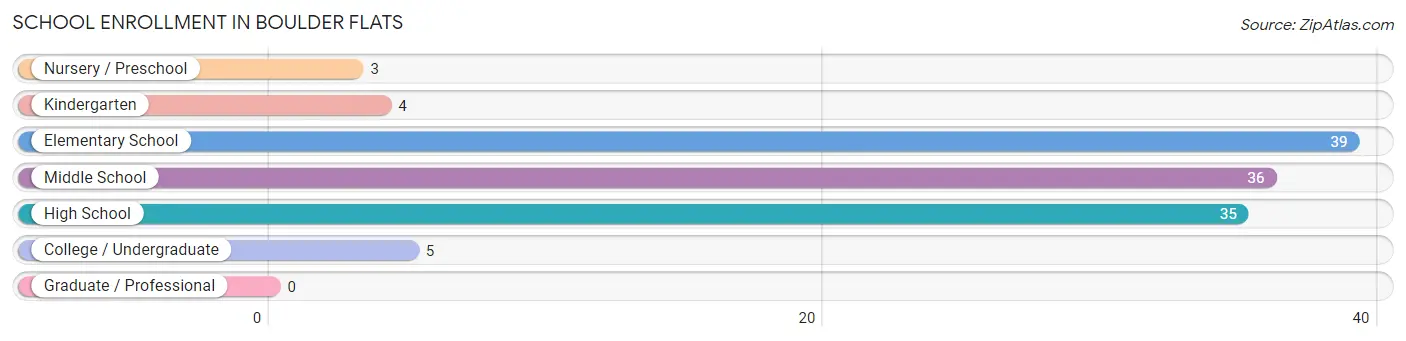
School Enrollment in Boulder Flats
The most common levels of schooling among the 122 students in Boulder Flats are elementary school (39 | 32.0%), middle school (36 | 29.5%), and high school (35 | 28.7%).
| School Level | # Students | % Students |
| Nursery / Preschool | 3 | 2.5% |
| Kindergarten | 4 | 3.3% |
| Elementary School | 39 | 32.0% |
| Middle School | 36 | 29.5% |
| High School | 35 | 28.7% |
| College / Undergraduate | 5 | 4.1% |
| Graduate / Professional | 0 | 0.0% |
| Total | 122 | 100.0% |
School Enrollment by Age by Funding Source in Boulder Flats
Out of a total of 122 students who are enrolled in schools in Boulder Flats, 8 (6.6%) attend a private institution, while the remaining 114 (93.4%) are enrolled in public schools. The age group of 18 to 19 year olds has the highest likelihood of being enrolled in private schools, with 3 (100.0% in the age bracket) enrolled. Conversely, the age group of 3 to 4 year olds has the lowest likelihood of being enrolled in a private school, with 3 (100.0% in the age bracket) attending a public institution.
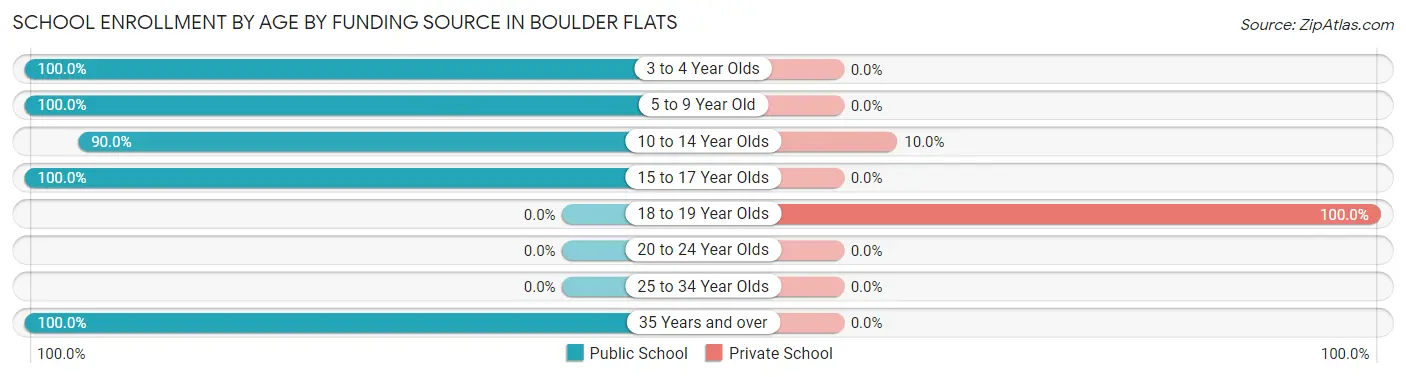
| Age Bracket | Public School | Private School |
| 3 to 4 Year Olds | 3 (100.0%) | 0 (0.0%) |
| 5 to 9 Year Old | 36 (100.0%) | 0 (0.0%) |
| 10 to 14 Year Olds | 45 (90.0%) | 5 (10.0%) |
| 15 to 17 Year Olds | 28 (100.0%) | 0 (0.0%) |
| 18 to 19 Year Olds | 0 (0.0%) | 3 (100.0%) |
| 20 to 24 Year Olds | 0 (0.0%) | 0 (0.0%) |
| 25 to 34 Year Olds | 0 (0.0%) | 0 (0.0%) |
| 35 Years and over | 2 (100.0%) | 0 (0.0%) |
| Total | 114 (93.4%) | 8 (6.6%) |
Educational Attainment by Field of Study in Boulder Flats
Bio, nature & agricultural (45 | 45.0%), social sciences (12 | 12.0%), business (11 | 11.0%), liberal arts & history (8 | 8.0%), and computers & mathematics (7 | 7.0%) are the most common fields of study among 100 individuals in Boulder Flats who have obtained a bachelor's degree or higher.
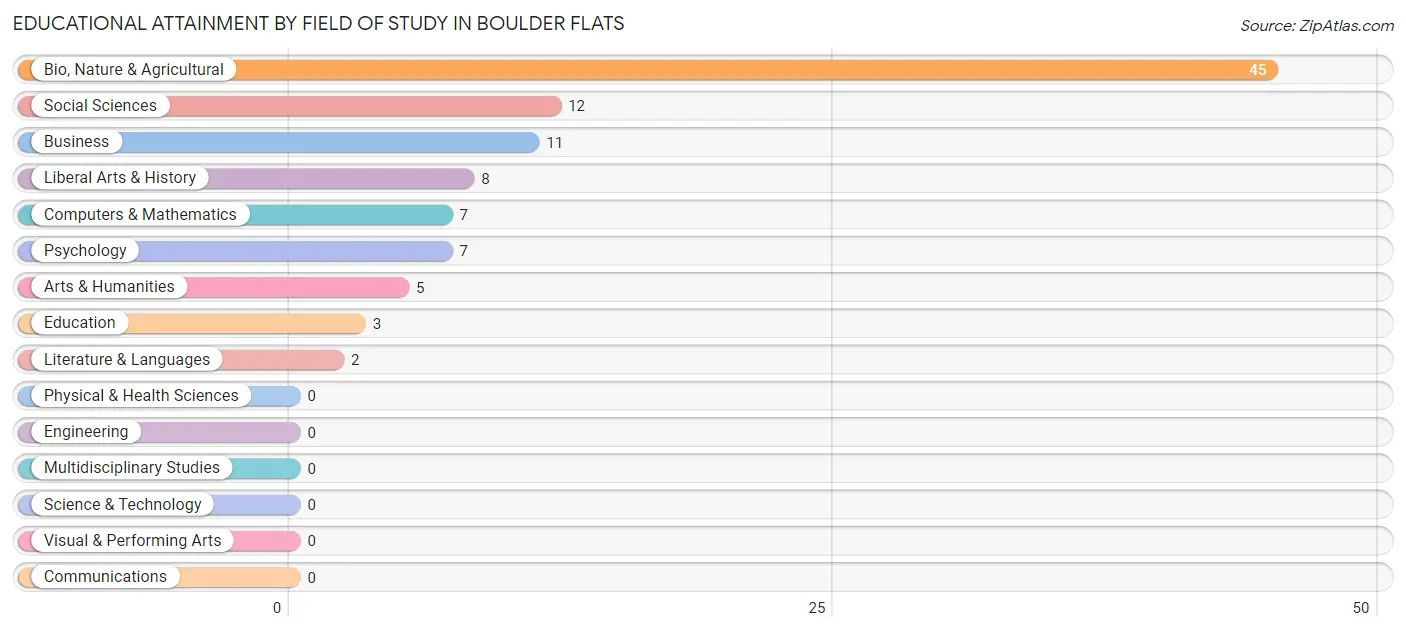
| Field of Study | # Graduates | % Graduates |
| Computers & Mathematics | 7 | 7.0% |
| Bio, Nature & Agricultural | 45 | 45.0% |
| Physical & Health Sciences | 0 | 0.0% |
| Psychology | 7 | 7.0% |
| Social Sciences | 12 | 12.0% |
| Engineering | 0 | 0.0% |
| Multidisciplinary Studies | 0 | 0.0% |
| Science & Technology | 0 | 0.0% |
| Business | 11 | 11.0% |
| Education | 3 | 3.0% |
| Literature & Languages | 2 | 2.0% |
| Liberal Arts & History | 8 | 8.0% |
| Visual & Performing Arts | 0 | 0.0% |
| Communications | 0 | 0.0% |
| Arts & Humanities | 5 | 5.0% |
| Total | 100 | 100.0% |
Transportation & Commute in Boulder Flats
Vehicle Availability by Sex in Boulder Flats
The most prevalent vehicle ownership categories in Boulder Flats are males with 4 vehicles (31, accounting for 39.2%) and females with 4 vehicles (17, making up 35.6%).
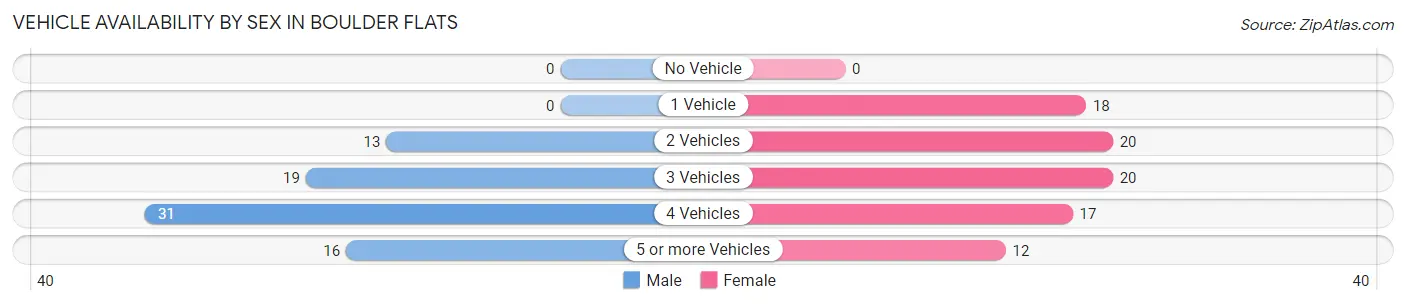
| Vehicles Available | Male | Female |
| No Vehicle | 0 (0.0%) | 0 (0.0%) |
| 1 Vehicle | 0 (0.0%) | 18 (20.7%) |
| 2 Vehicles | 13 (16.5%) | 20 (23.0%) |
| 3 Vehicles | 19 (24.0%) | 20 (23.0%) |
| 4 Vehicles | 31 (39.2%) | 17 (19.5%) |
| 5 or more Vehicles | 16 (20.3%) | 12 (13.8%) |
| Total | 79 (100.0%) | 87 (100.0%) |
Commute Time in Boulder Flats
The most frequently occuring commute durations in Boulder Flats are 10 to 14 minutes (41 commuters, 30.4%), 5 to 9 minutes (26 commuters, 19.3%), and 15 to 19 minutes (24 commuters, 17.8%).
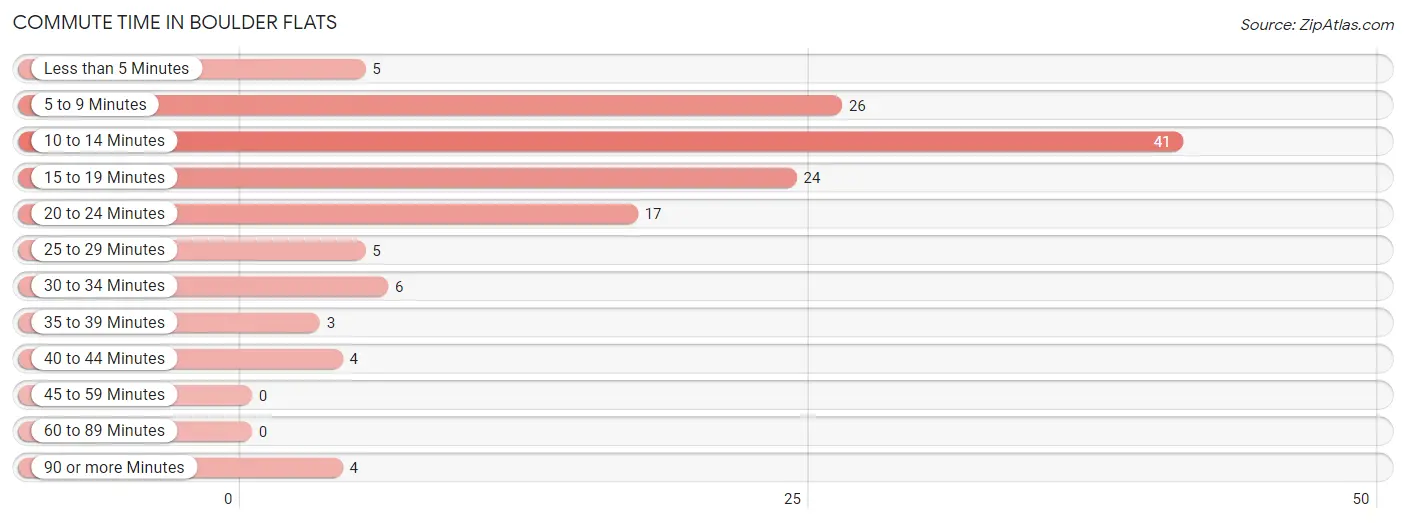
| Commute Time | # Commuters | % Commuters |
| Less than 5 Minutes | 5 | 3.7% |
| 5 to 9 Minutes | 26 | 19.3% |
| 10 to 14 Minutes | 41 | 30.4% |
| 15 to 19 Minutes | 24 | 17.8% |
| 20 to 24 Minutes | 17 | 12.6% |
| 25 to 29 Minutes | 5 | 3.7% |
| 30 to 34 Minutes | 6 | 4.4% |
| 35 to 39 Minutes | 3 | 2.2% |
| 40 to 44 Minutes | 4 | 3.0% |
| 45 to 59 Minutes | 0 | 0.0% |
| 60 to 89 Minutes | 0 | 0.0% |
| 90 or more Minutes | 4 | 3.0% |
Commute Time by Sex in Boulder Flats
The most common commute times in Boulder Flats are 10 to 14 minutes (24 commuters, 40.0%) for males and 10 to 14 minutes (17 commuters, 22.7%) for females.
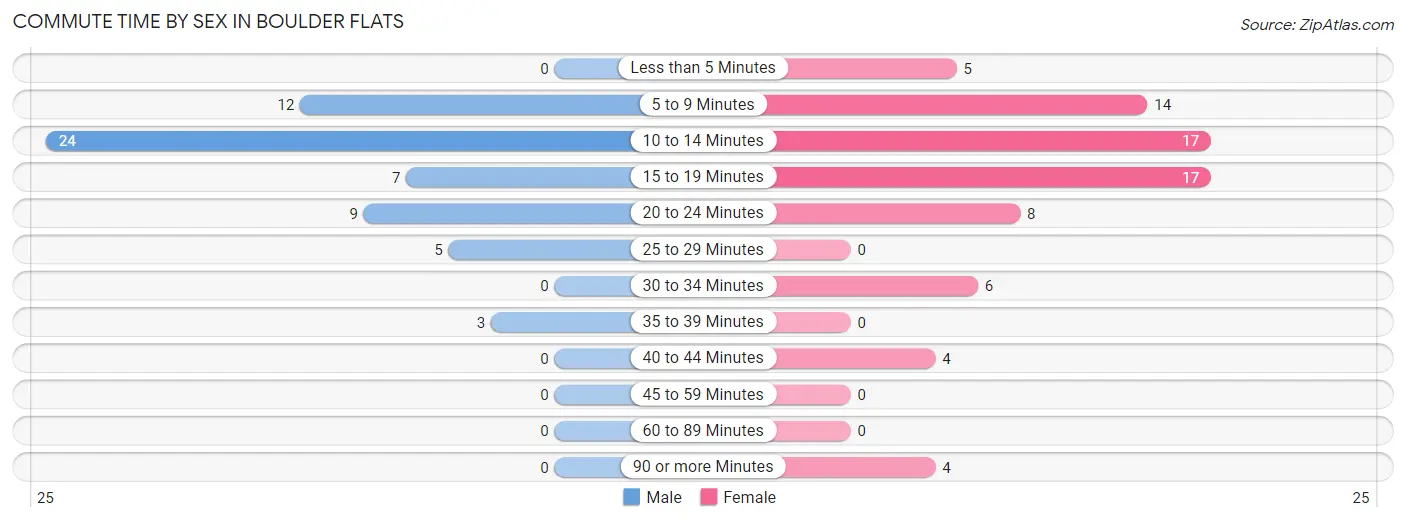
| Commute Time | Male | Female |
| Less than 5 Minutes | 0 (0.0%) | 5 (6.7%) |
| 5 to 9 Minutes | 12 (20.0%) | 14 (18.7%) |
| 10 to 14 Minutes | 24 (40.0%) | 17 (22.7%) |
| 15 to 19 Minutes | 7 (11.7%) | 17 (22.7%) |
| 20 to 24 Minutes | 9 (15.0%) | 8 (10.7%) |
| 25 to 29 Minutes | 5 (8.3%) | 0 (0.0%) |
| 30 to 34 Minutes | 0 (0.0%) | 6 (8.0%) |
| 35 to 39 Minutes | 3 (5.0%) | 0 (0.0%) |
| 40 to 44 Minutes | 0 (0.0%) | 4 (5.3%) |
| 45 to 59 Minutes | 0 (0.0%) | 0 (0.0%) |
| 60 to 89 Minutes | 0 (0.0%) | 0 (0.0%) |
| 90 or more Minutes | 0 (0.0%) | 4 (5.3%) |
Time of Departure to Work by Sex in Boulder Flats
The most frequent times of departure to work in Boulder Flats are 7:30 AM to 7:59 AM (28, 46.7%) for males and 7:30 AM to 7:59 AM (32, 42.7%) for females.
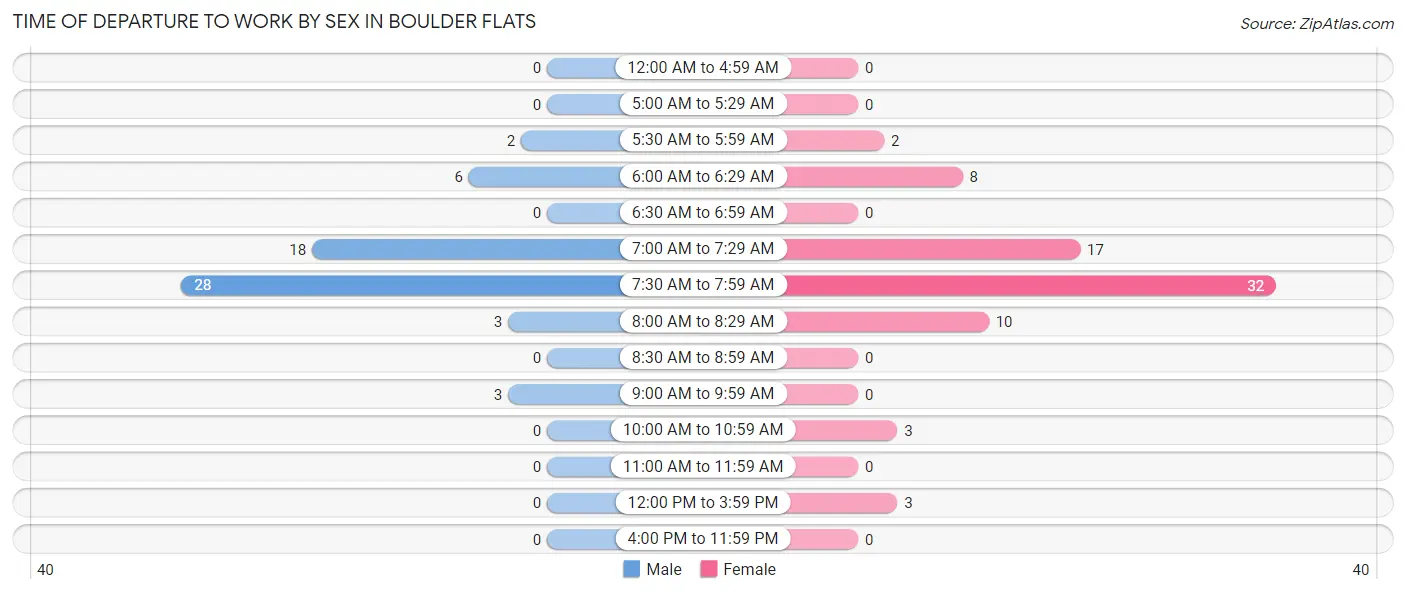
| Time of Departure | Male | Female |
| 12:00 AM to 4:59 AM | 0 (0.0%) | 0 (0.0%) |
| 5:00 AM to 5:29 AM | 0 (0.0%) | 0 (0.0%) |
| 5:30 AM to 5:59 AM | 2 (3.3%) | 2 (2.7%) |
| 6:00 AM to 6:29 AM | 6 (10.0%) | 8 (10.7%) |
| 6:30 AM to 6:59 AM | 0 (0.0%) | 0 (0.0%) |
| 7:00 AM to 7:29 AM | 18 (30.0%) | 17 (22.7%) |
| 7:30 AM to 7:59 AM | 28 (46.7%) | 32 (42.7%) |
| 8:00 AM to 8:29 AM | 3 (5.0%) | 10 (13.3%) |
| 8:30 AM to 8:59 AM | 0 (0.0%) | 0 (0.0%) |
| 9:00 AM to 9:59 AM | 3 (5.0%) | 0 (0.0%) |
| 10:00 AM to 10:59 AM | 0 (0.0%) | 3 (4.0%) |
| 11:00 AM to 11:59 AM | 0 (0.0%) | 0 (0.0%) |
| 12:00 PM to 3:59 PM | 0 (0.0%) | 3 (4.0%) |
| 4:00 PM to 11:59 PM | 0 (0.0%) | 0 (0.0%) |
| Total | 60 (100.0%) | 75 (100.0%) |
Housing Occupancy in Boulder Flats
Occupancy by Ownership in Boulder Flats
Of the total 150 dwellings in Boulder Flats, owner-occupied units account for 138 (92.0%), while renter-occupied units make up 12 (8.0%).
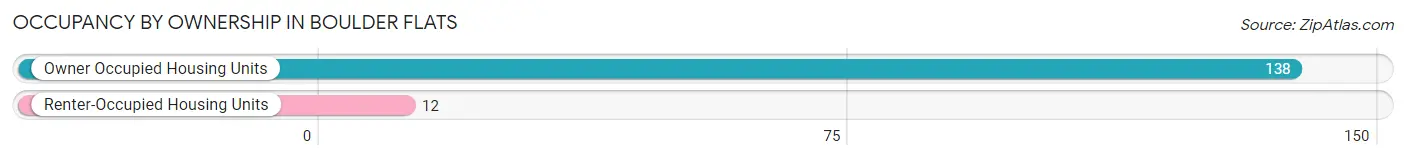
| Occupancy | # Housing Units | % Housing Units |
| Owner Occupied Housing Units | 138 | 92.0% |
| Renter-Occupied Housing Units | 12 | 8.0% |
| Total Occupied Housing Units | 150 | 100.0% |
Occupancy by Household Size in Boulder Flats
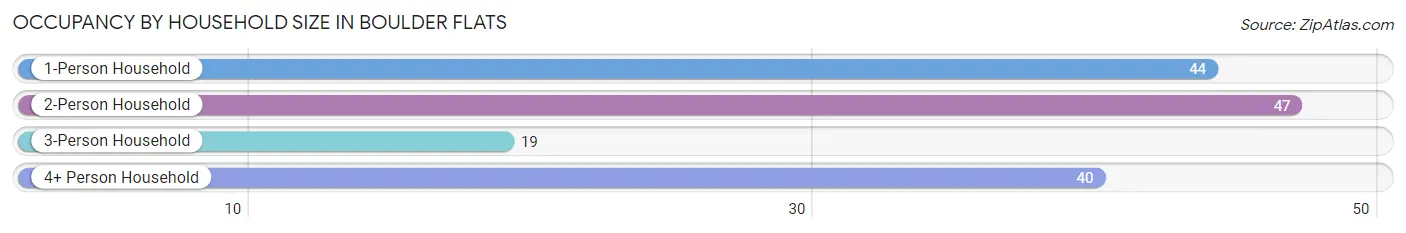
| Household Size | # Housing Units | % Housing Units |
| 1-Person Household | 44 | 29.3% |
| 2-Person Household | 47 | 31.3% |
| 3-Person Household | 19 | 12.7% |
| 4+ Person Household | 40 | 26.7% |
| Total Housing Units | 150 | 100.0% |
Occupancy by Ownership by Household Size in Boulder Flats

| Household Size | Owner-occupied | Renter-occupied |
| 1-Person Household | 41 (93.2%) | 3 (6.8%) |
| 2-Person Household | 44 (93.6%) | 3 (6.4%) |
| 3-Person Household | 13 (68.4%) | 6 (31.6%) |
| 4+ Person Household | 40 (100.0%) | 0 (0.0%) |
| Total Housing Units | 138 (92.0%) | 12 (8.0%) |
Occupancy by Educational Attainment in Boulder Flats
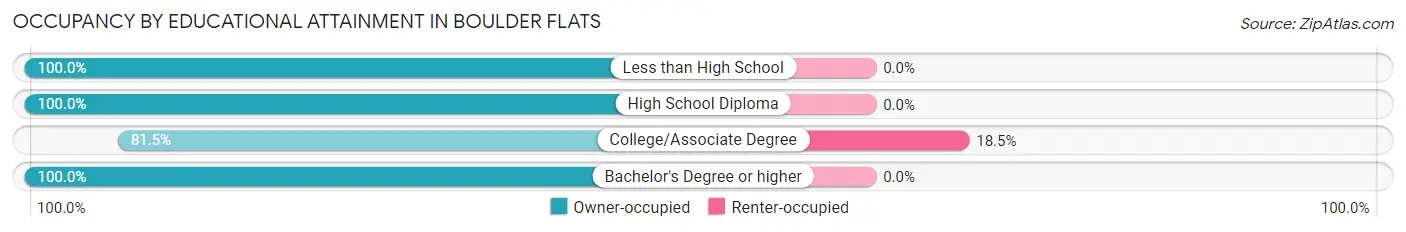
| Household Size | Owner-occupied | Renter-occupied |
| Less than High School | 9 (100.0%) | 0 (0.0%) |
| High School Diploma | 35 (100.0%) | 0 (0.0%) |
| College/Associate Degree | 53 (81.5%) | 12 (18.5%) |
| Bachelor's Degree or higher | 41 (100.0%) | 0 (0.0%) |
Occupancy by Age of Householder in Boulder Flats
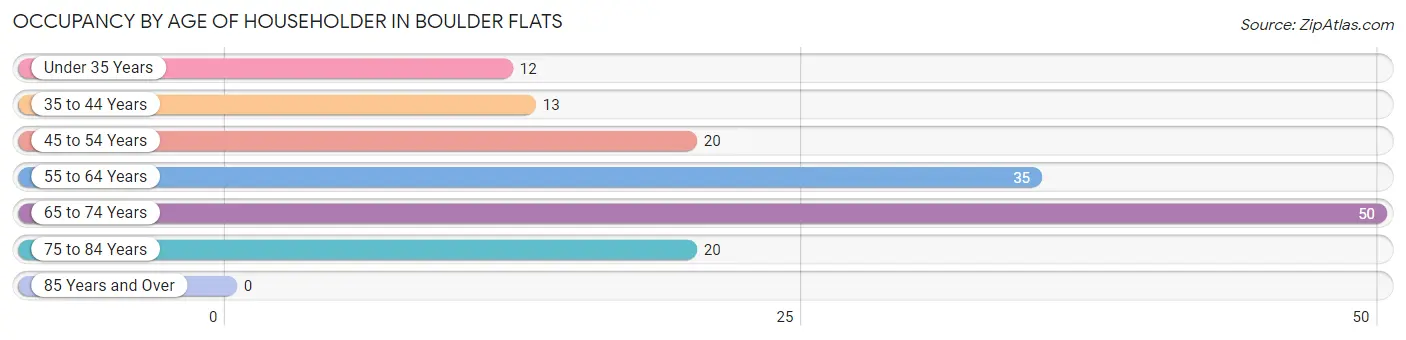
| Age Bracket | # Households | % Households |
| Under 35 Years | 12 | 8.0% |
| 35 to 44 Years | 13 | 8.7% |
| 45 to 54 Years | 20 | 13.3% |
| 55 to 64 Years | 35 | 23.3% |
| 65 to 74 Years | 50 | 33.3% |
| 75 to 84 Years | 20 | 13.3% |
| 85 Years and Over | 0 | 0.0% |
| Total | 150 | 100.0% |
Housing Finances in Boulder Flats
Median Income by Occupancy in Boulder Flats
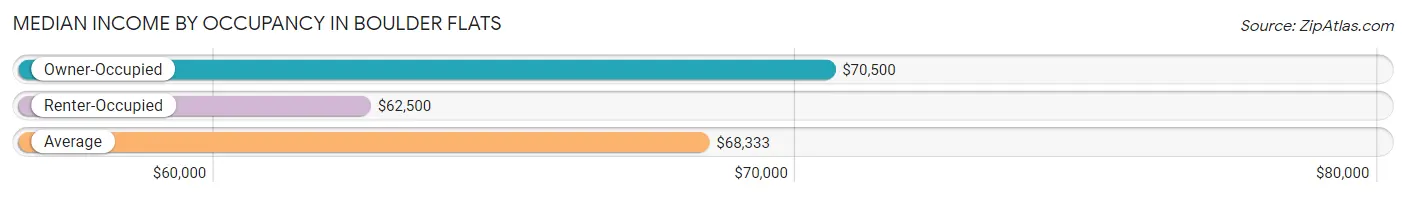
| Occupancy Type | # Households | Median Income |
| Owner-Occupied | 138 (92.0%) | $70,500 |
| Renter-Occupied | 12 (8.0%) | $62,500 |
| Average | 150 (100.0%) | $68,333 |
Occupancy by Householder Income Bracket in Boulder Flats
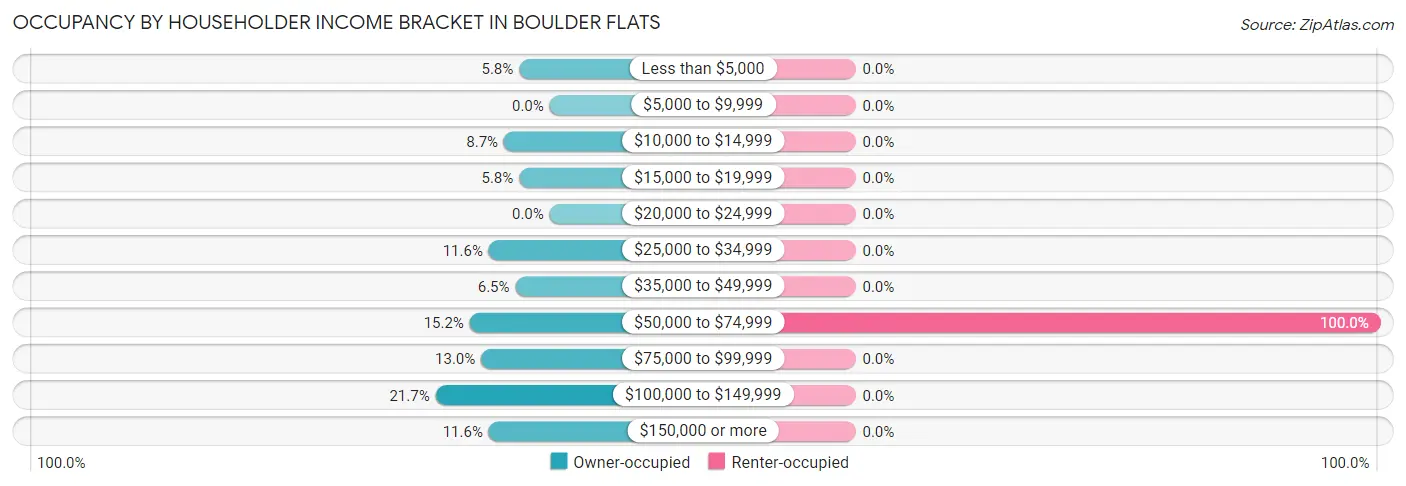
| Income Bracket | Owner-occupied | Renter-occupied |
| Less than $5,000 | 8 (5.8%) | 0 (0.0%) |
| $5,000 to $9,999 | 0 (0.0%) | 0 (0.0%) |
| $10,000 to $14,999 | 12 (8.7%) | 0 (0.0%) |
| $15,000 to $19,999 | 8 (5.8%) | 0 (0.0%) |
| $20,000 to $24,999 | 0 (0.0%) | 0 (0.0%) |
| $25,000 to $34,999 | 16 (11.6%) | 0 (0.0%) |
| $35,000 to $49,999 | 9 (6.5%) | 0 (0.0%) |
| $50,000 to $74,999 | 21 (15.2%) | 12 (100.0%) |
| $75,000 to $99,999 | 18 (13.0%) | 0 (0.0%) |
| $100,000 to $149,999 | 30 (21.7%) | 0 (0.0%) |
| $150,000 or more | 16 (11.6%) | 0 (0.0%) |
| Total | 138 (100.0%) | 12 (100.0%) |
Monthly Housing Cost Tiers in Boulder Flats
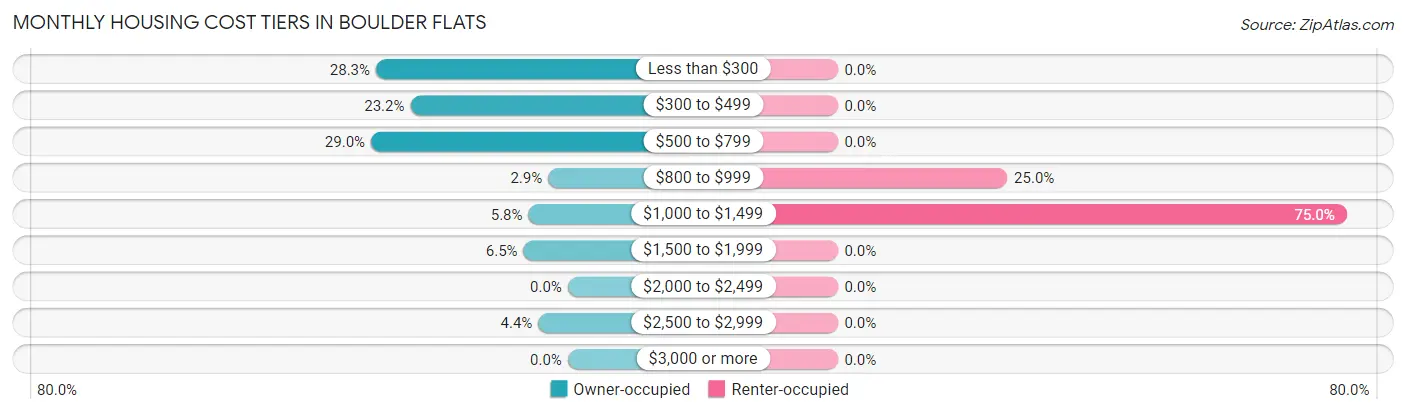
| Monthly Cost | Owner-occupied | Renter-occupied |
| Less than $300 | 39 (28.3%) | 0 (0.0%) |
| $300 to $499 | 32 (23.2%) | 0 (0.0%) |
| $500 to $799 | 40 (29.0%) | 0 (0.0%) |
| $800 to $999 | 4 (2.9%) | 3 (25.0%) |
| $1,000 to $1,499 | 8 (5.8%) | 9 (75.0%) |
| $1,500 to $1,999 | 9 (6.5%) | 0 (0.0%) |
| $2,000 to $2,499 | 0 (0.0%) | 0 (0.0%) |
| $2,500 to $2,999 | 6 (4.3%) | 0 (0.0%) |
| $3,000 or more | 0 (0.0%) | 0 (0.0%) |
| Total | 138 (100.0%) | 12 (100.0%) |
Physical Housing Characteristics in Boulder Flats
Housing Structures in Boulder Flats
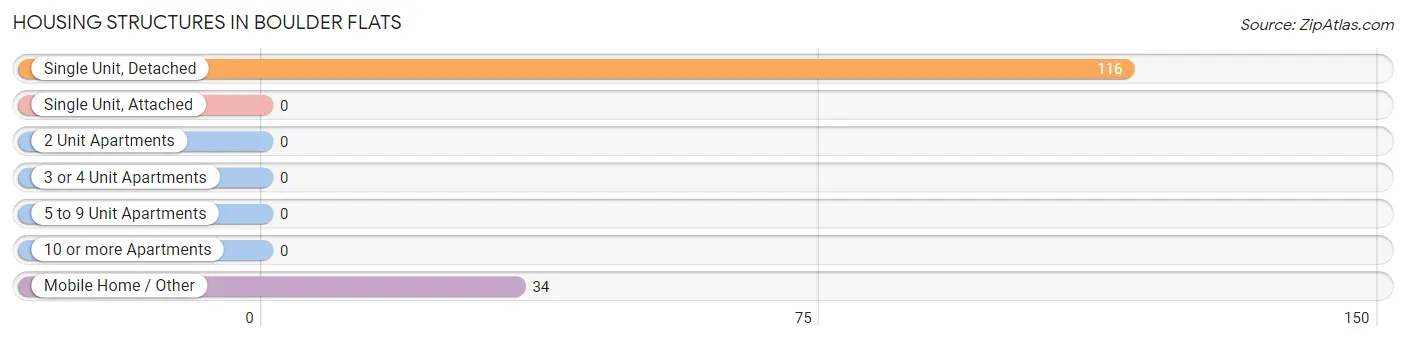
| Structure Type | # Housing Units | % Housing Units |
| Single Unit, Detached | 116 | 77.3% |
| Single Unit, Attached | 0 | 0.0% |
| 2 Unit Apartments | 0 | 0.0% |
| 3 or 4 Unit Apartments | 0 | 0.0% |
| 5 to 9 Unit Apartments | 0 | 0.0% |
| 10 or more Apartments | 0 | 0.0% |
| Mobile Home / Other | 34 | 22.7% |
| Total | 150 | 100.0% |
Housing Structures by Occupancy in Boulder Flats
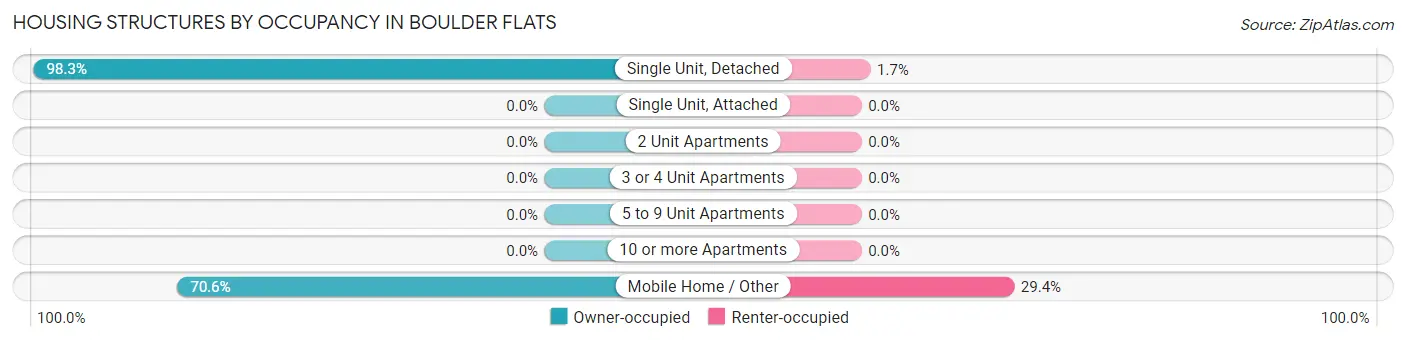
| Structure Type | Owner-occupied | Renter-occupied |
| Single Unit, Detached | 114 (98.3%) | 2 (1.7%) |
| Single Unit, Attached | 0 (0.0%) | 0 (0.0%) |
| 2 Unit Apartments | 0 (0.0%) | 0 (0.0%) |
| 3 or 4 Unit Apartments | 0 (0.0%) | 0 (0.0%) |
| 5 to 9 Unit Apartments | 0 (0.0%) | 0 (0.0%) |
| 10 or more Apartments | 0 (0.0%) | 0 (0.0%) |
| Mobile Home / Other | 24 (70.6%) | 10 (29.4%) |
| Total | 138 (92.0%) | 12 (8.0%) |
Housing Structures by Number of Rooms in Boulder Flats
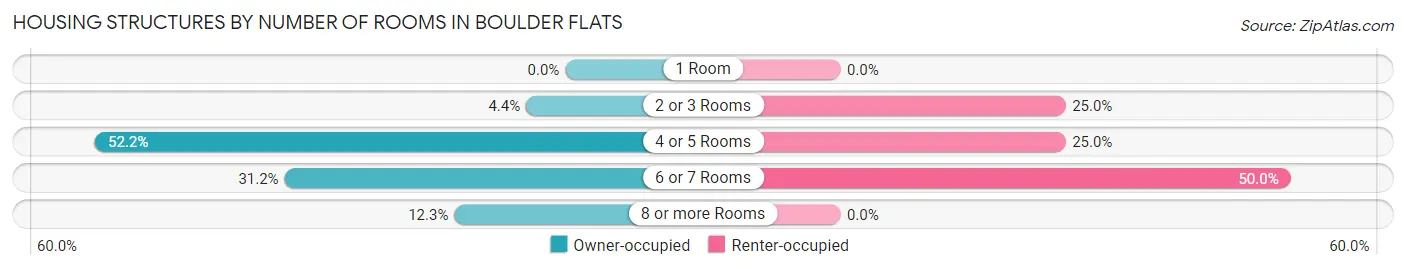
| Number of Rooms | Owner-occupied | Renter-occupied |
| 1 Room | 0 (0.0%) | 0 (0.0%) |
| 2 or 3 Rooms | 6 (4.3%) | 3 (25.0%) |
| 4 or 5 Rooms | 72 (52.2%) | 3 (25.0%) |
| 6 or 7 Rooms | 43 (31.2%) | 6 (50.0%) |
| 8 or more Rooms | 17 (12.3%) | 0 (0.0%) |
| Total | 138 (100.0%) | 12 (100.0%) |
Housing Structure by Heating Type in Boulder Flats
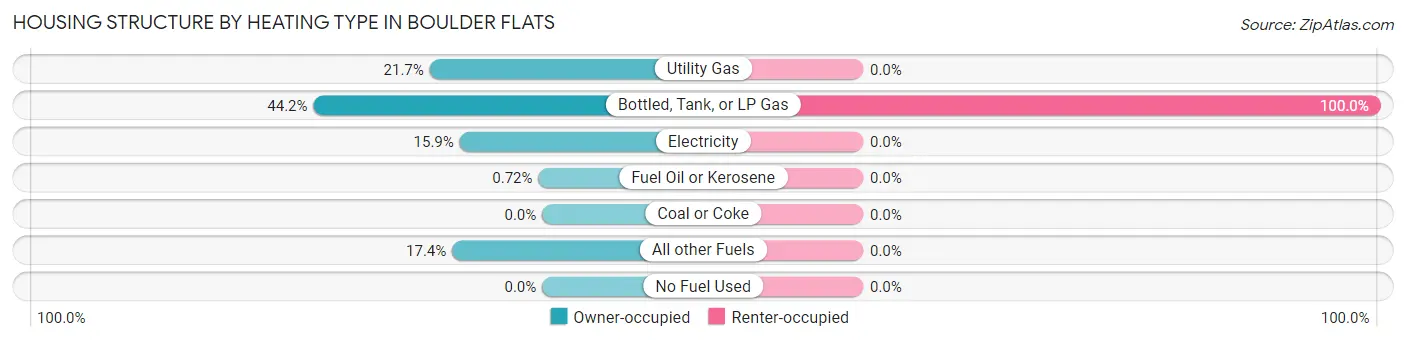
| Heating Type | Owner-occupied | Renter-occupied |
| Utility Gas | 30 (21.7%) | 0 (0.0%) |
| Bottled, Tank, or LP Gas | 61 (44.2%) | 12 (100.0%) |
| Electricity | 22 (15.9%) | 0 (0.0%) |
| Fuel Oil or Kerosene | 1 (0.7%) | 0 (0.0%) |
| Coal or Coke | 0 (0.0%) | 0 (0.0%) |
| All other Fuels | 24 (17.4%) | 0 (0.0%) |
| No Fuel Used | 0 (0.0%) | 0 (0.0%) |
| Total | 138 (100.0%) | 12 (100.0%) |
Household Vehicle Usage in Boulder Flats
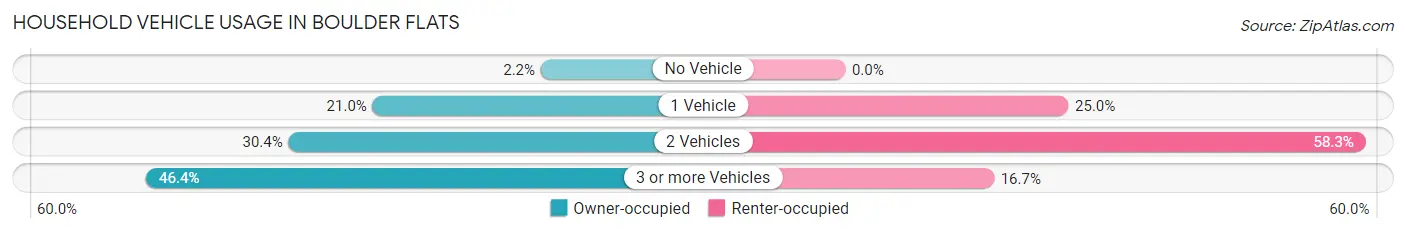
| Vehicles per Household | Owner-occupied | Renter-occupied |
| No Vehicle | 3 (2.2%) | 0 (0.0%) |
| 1 Vehicle | 29 (21.0%) | 3 (25.0%) |
| 2 Vehicles | 42 (30.4%) | 7 (58.3%) |
| 3 or more Vehicles | 64 (46.4%) | 2 (16.7%) |
| Total | 138 (100.0%) | 12 (100.0%) |
Real Estate & Mortgages in Boulder Flats
Real Estate and Mortgage Overview in Boulder Flats
| Characteristic | Without Mortgage | With Mortgage |
| Housing Units | 108 | 30 |
| Median Property Value | $166,700 | $230,000 |
| Median Household Income | $54,375 | $9 |
| Monthly Housing Costs | $393 | $0 |
| Real Estate Taxes | $1,362 | $9 |
Property Value by Mortgage Status in Boulder Flats
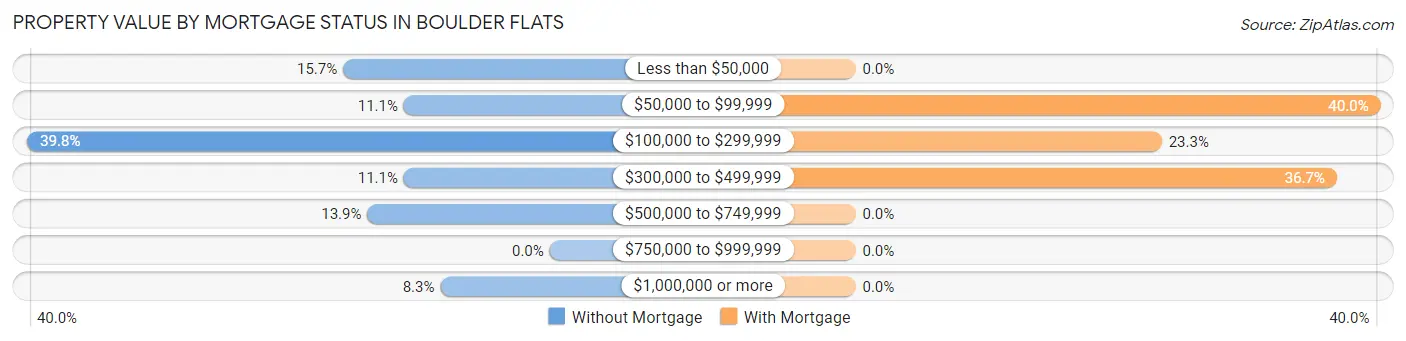
| Property Value | Without Mortgage | With Mortgage |
| Less than $50,000 | 17 (15.7%) | 0 (0.0%) |
| $50,000 to $99,999 | 12 (11.1%) | 12 (40.0%) |
| $100,000 to $299,999 | 43 (39.8%) | 7 (23.3%) |
| $300,000 to $499,999 | 12 (11.1%) | 11 (36.7%) |
| $500,000 to $749,999 | 15 (13.9%) | 0 (0.0%) |
| $750,000 to $999,999 | 0 (0.0%) | 0 (0.0%) |
| $1,000,000 or more | 9 (8.3%) | 0 (0.0%) |
| Total | 108 (100.0%) | 30 (100.0%) |
Household Income by Mortgage Status in Boulder Flats
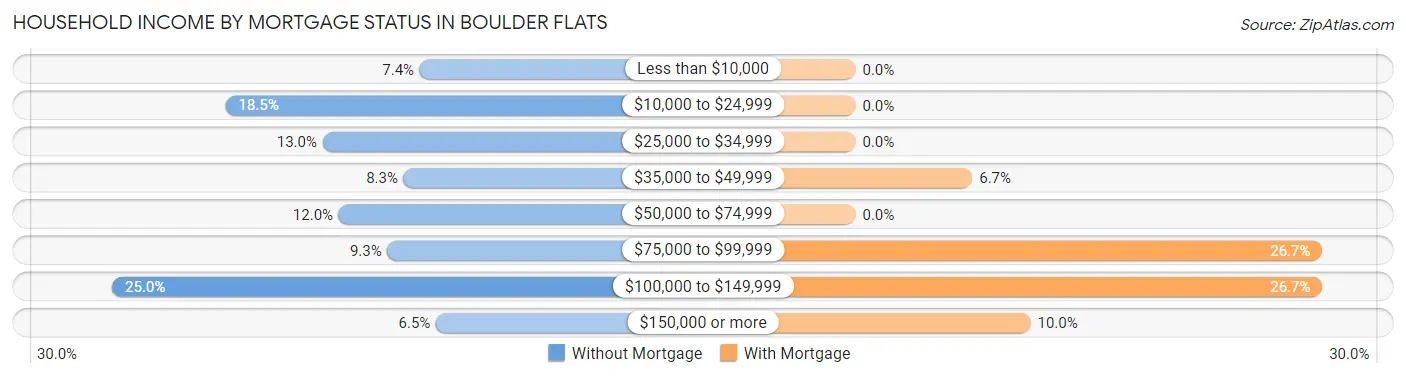
| Household Income | Without Mortgage | With Mortgage |
| Less than $10,000 | 8 (7.4%) | 0 (0.0%) |
| $10,000 to $24,999 | 20 (18.5%) | 0 (0.0%) |
| $25,000 to $34,999 | 14 (13.0%) | 0 (0.0%) |
| $35,000 to $49,999 | 9 (8.3%) | 2 (6.7%) |
| $50,000 to $74,999 | 13 (12.0%) | 0 (0.0%) |
| $75,000 to $99,999 | 10 (9.3%) | 8 (26.7%) |
| $100,000 to $149,999 | 27 (25.0%) | 8 (26.7%) |
| $150,000 or more | 7 (6.5%) | 3 (10.0%) |
| Total | 108 (100.0%) | 30 (100.0%) |
Property Value to Household Income Ratio in Boulder Flats
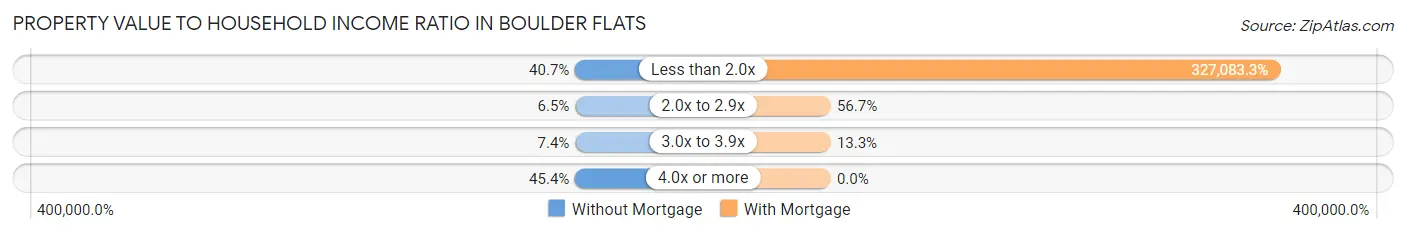
| Value-to-Income Ratio | Without Mortgage | With Mortgage |
| Less than 2.0x | 44 (40.7%) | 98,125 (327,083.3%) |
| 2.0x to 2.9x | 7 (6.5%) | 17 (56.7%) |
| 3.0x to 3.9x | 8 (7.4%) | 4 (13.3%) |
| 4.0x or more | 49 (45.4%) | 0 (0.0%) |
| Total | 108 (100.0%) | 30 (100.0%) |
Real Estate Taxes by Mortgage Status in Boulder Flats
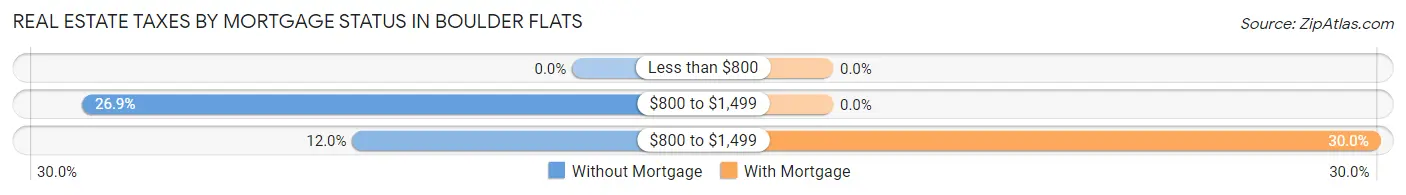
| Property Taxes | Without Mortgage | With Mortgage |
| Less than $800 | 0 (0.0%) | 0 (0.0%) |
| $800 to $1,499 | 29 (26.9%) | 0 (0.0%) |
| $800 to $1,499 | 13 (12.0%) | 9 (30.0%) |
| Total | 108 (100.0%) | 30 (100.0%) |
Health & Disability in Boulder Flats
Health Insurance Coverage by Age in Boulder Flats
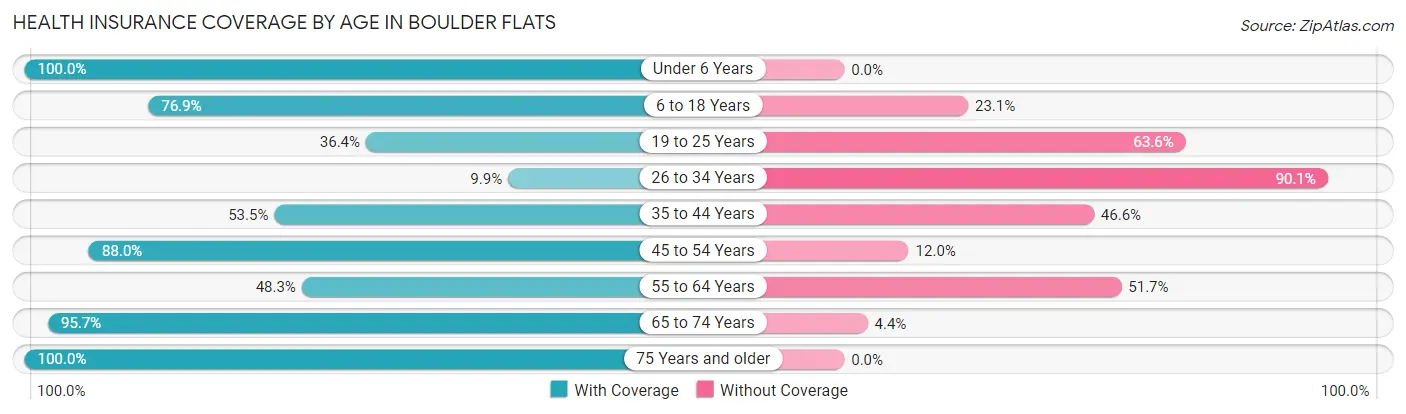
| Age Bracket | With Coverage | Without Coverage |
| Under 6 Years | 11 (100.0%) | 0 (0.0%) |
| 6 to 18 Years | 100 (76.9%) | 30 (23.1%) |
| 19 to 25 Years | 12 (36.4%) | 21 (63.6%) |
| 26 to 34 Years | 7 (9.9%) | 64 (90.1%) |
| 35 to 44 Years | 31 (53.4%) | 27 (46.6%) |
| 45 to 54 Years | 44 (88.0%) | 6 (12.0%) |
| 55 to 64 Years | 29 (48.3%) | 31 (51.7%) |
| 65 to 74 Years | 66 (95.7%) | 3 (4.3%) |
| 75 Years and older | 31 (100.0%) | 0 (0.0%) |
| Total | 331 (64.5%) | 182 (35.5%) |
Health Insurance Coverage by Citizenship Status in Boulder Flats
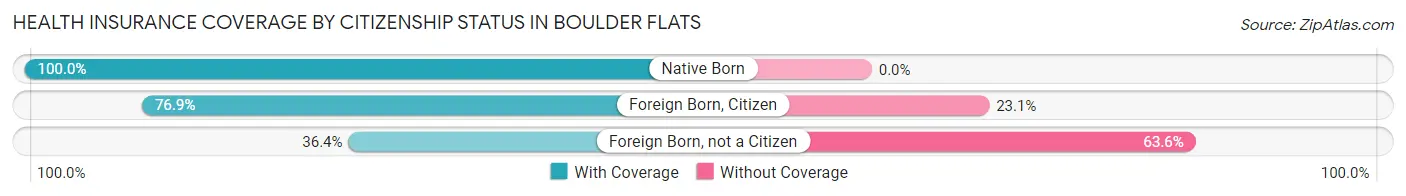
| Citizenship Status | With Coverage | Without Coverage |
| Native Born | 11 (100.0%) | 0 (0.0%) |
| Foreign Born, Citizen | 100 (76.9%) | 30 (23.1%) |
| Foreign Born, not a Citizen | 12 (36.4%) | 21 (63.6%) |
Health Insurance Coverage by Household Income in Boulder Flats
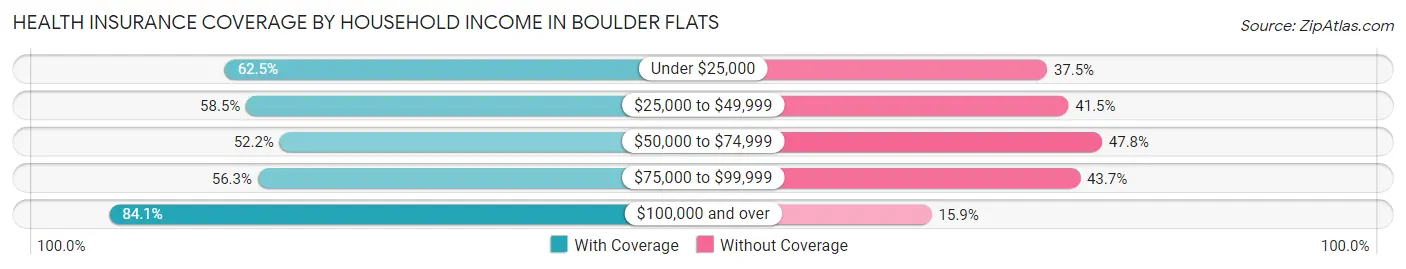
| Household Income | With Coverage | Without Coverage |
| Under $25,000 | 25 (62.5%) | 15 (37.5%) |
| $25,000 to $49,999 | 62 (58.5%) | 44 (41.5%) |
| $50,000 to $74,999 | 59 (52.2%) | 54 (47.8%) |
| $75,000 to $99,999 | 58 (56.3%) | 45 (43.7%) |
| $100,000 and over | 127 (84.1%) | 24 (15.9%) |
Public vs Private Health Insurance Coverage by Age in Boulder Flats
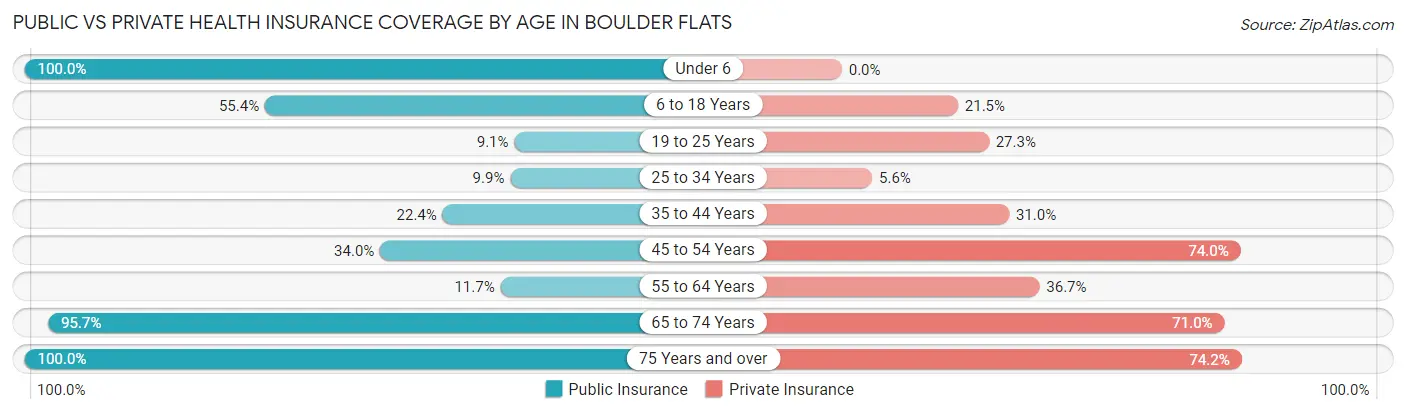
| Age Bracket | Public Insurance | Private Insurance |
| Under 6 | 11 (100.0%) | 0 (0.0%) |
| 6 to 18 Years | 72 (55.4%) | 28 (21.5%) |
| 19 to 25 Years | 3 (9.1%) | 9 (27.3%) |
| 25 to 34 Years | 7 (9.9%) | 4 (5.6%) |
| 35 to 44 Years | 13 (22.4%) | 18 (31.0%) |
| 45 to 54 Years | 17 (34.0%) | 37 (74.0%) |
| 55 to 64 Years | 7 (11.7%) | 22 (36.7%) |
| 65 to 74 Years | 66 (95.7%) | 49 (71.0%) |
| 75 Years and over | 31 (100.0%) | 23 (74.2%) |
| Total | 227 (44.3%) | 190 (37.0%) |
Disability Status by Sex by Age in Boulder Flats
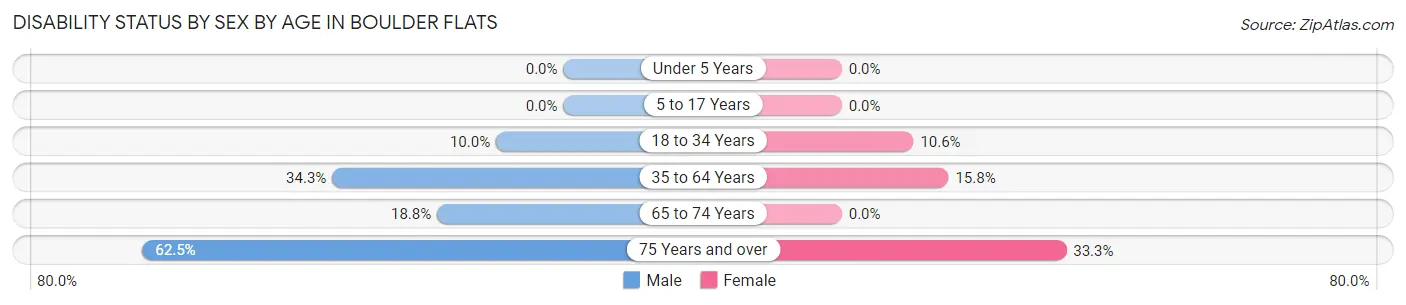
| Age Bracket | Male | Female |
| Under 5 Years | 0 (0.0%) | 0 (0.0%) |
| 5 to 17 Years | 0 (0.0%) | 0 (0.0%) |
| 18 to 34 Years | 6 (10.0%) | 5 (10.6%) |
| 35 to 64 Years | 23 (34.3%) | 16 (15.8%) |
| 65 to 74 Years | 9 (18.8%) | 0 (0.0%) |
| 75 Years and over | 10 (62.5%) | 5 (33.3%) |
Disability Class by Sex by Age in Boulder Flats
Disability Class: Hearing Difficulty
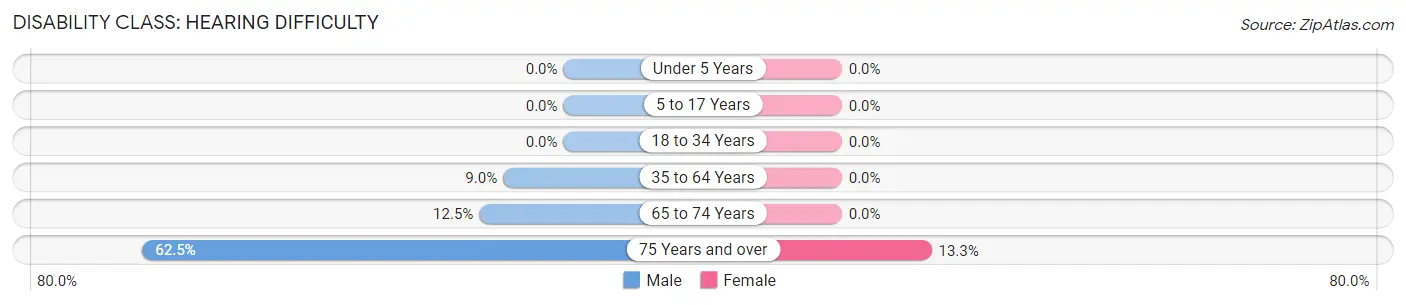
| Age Bracket | Male | Female |
| Under 5 Years | 0 (0.0%) | 0 (0.0%) |
| 5 to 17 Years | 0 (0.0%) | 0 (0.0%) |
| 18 to 34 Years | 0 (0.0%) | 0 (0.0%) |
| 35 to 64 Years | 6 (9.0%) | 0 (0.0%) |
| 65 to 74 Years | 6 (12.5%) | 0 (0.0%) |
| 75 Years and over | 10 (62.5%) | 2 (13.3%) |
Disability Class: Vision Difficulty
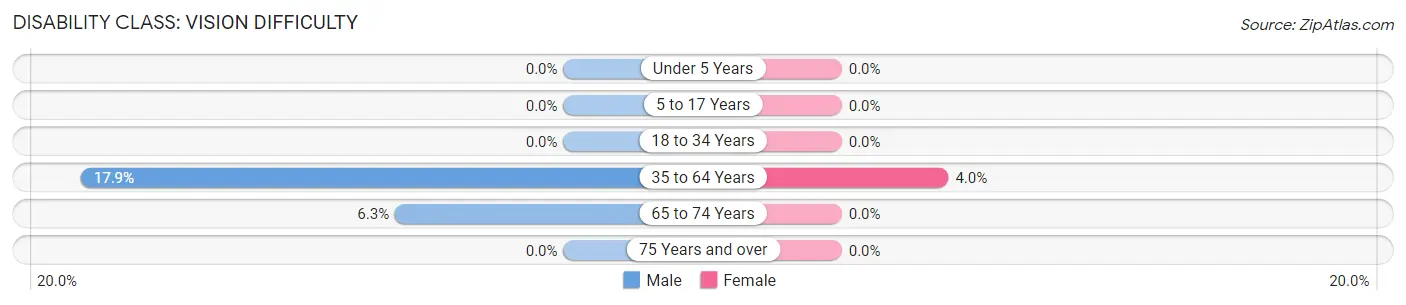
| Age Bracket | Male | Female |
| Under 5 Years | 0 (0.0%) | 0 (0.0%) |
| 5 to 17 Years | 0 (0.0%) | 0 (0.0%) |
| 18 to 34 Years | 0 (0.0%) | 0 (0.0%) |
| 35 to 64 Years | 12 (17.9%) | 4 (4.0%) |
| 65 to 74 Years | 3 (6.2%) | 0 (0.0%) |
| 75 Years and over | 0 (0.0%) | 0 (0.0%) |
Disability Class: Cognitive Difficulty
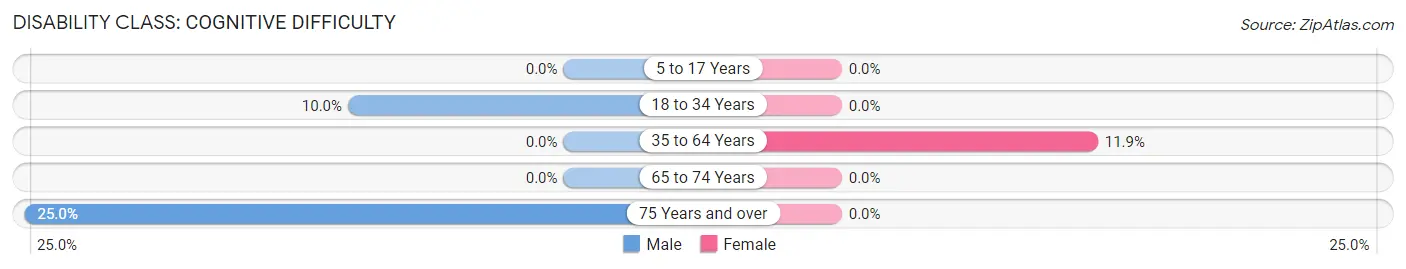
| Age Bracket | Male | Female |
| 5 to 17 Years | 0 (0.0%) | 0 (0.0%) |
| 18 to 34 Years | 6 (10.0%) | 0 (0.0%) |
| 35 to 64 Years | 0 (0.0%) | 12 (11.9%) |
| 65 to 74 Years | 0 (0.0%) | 0 (0.0%) |
| 75 Years and over | 4 (25.0%) | 0 (0.0%) |
Disability Class: Ambulatory Difficulty
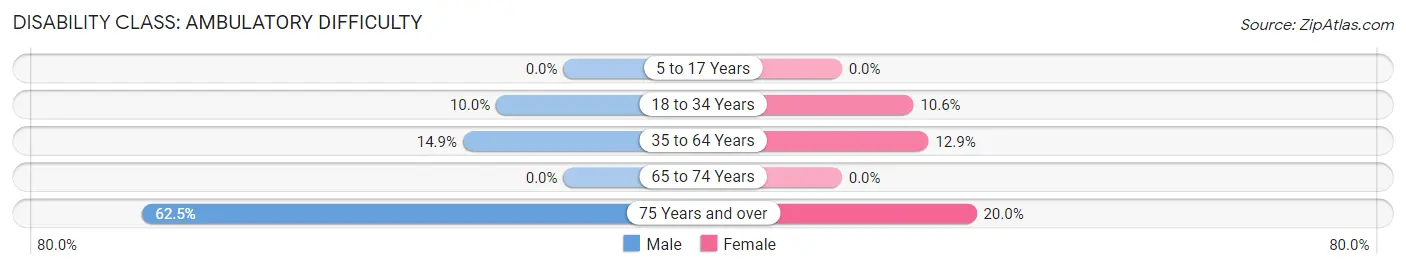
| Age Bracket | Male | Female |
| 5 to 17 Years | 0 (0.0%) | 0 (0.0%) |
| 18 to 34 Years | 6 (10.0%) | 5 (10.6%) |
| 35 to 64 Years | 10 (14.9%) | 13 (12.9%) |
| 65 to 74 Years | 0 (0.0%) | 0 (0.0%) |
| 75 Years and over | 10 (62.5%) | 3 (20.0%) |
Disability Class: Self-Care Difficulty
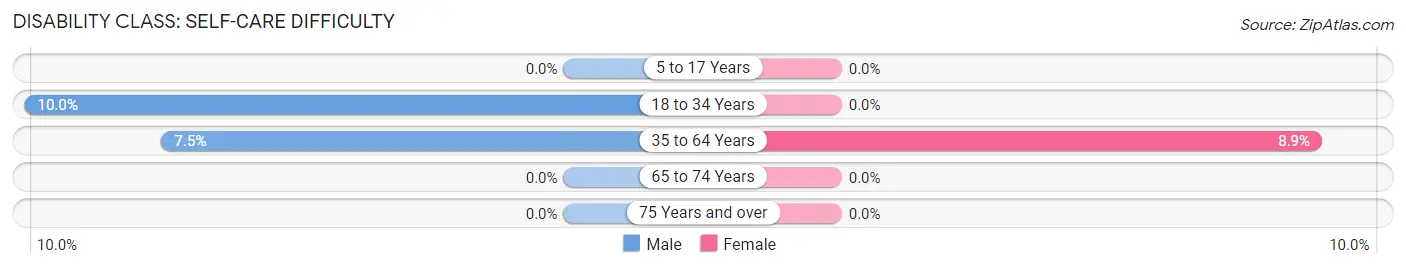
| Age Bracket | Male | Female |
| 5 to 17 Years | 0 (0.0%) | 0 (0.0%) |
| 18 to 34 Years | 6 (10.0%) | 0 (0.0%) |
| 35 to 64 Years | 5 (7.5%) | 9 (8.9%) |
| 65 to 74 Years | 0 (0.0%) | 0 (0.0%) |
| 75 Years and over | 0 (0.0%) | 0 (0.0%) |
Technology Access in Boulder Flats
Computing Device Access in Boulder Flats
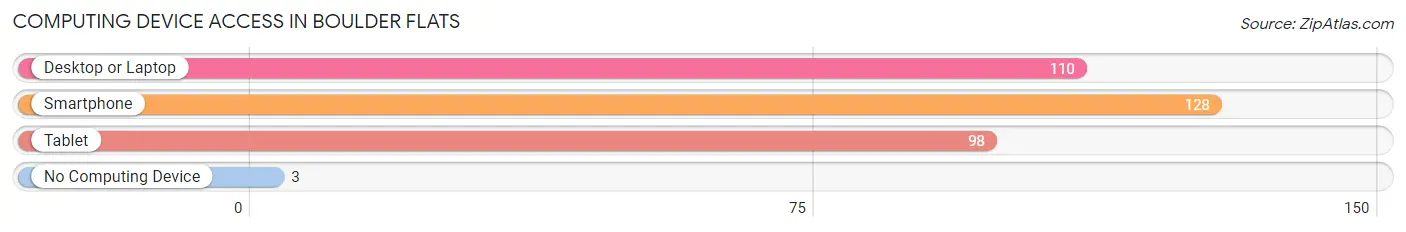
| Device Type | # Households | % Households |
| Desktop or Laptop | 110 | 73.3% |
| Smartphone | 128 | 85.3% |
| Tablet | 98 | 65.3% |
| No Computing Device | 3 | 2.0% |
| Total | 150 | 100.0% |
Internet Access in Boulder Flats
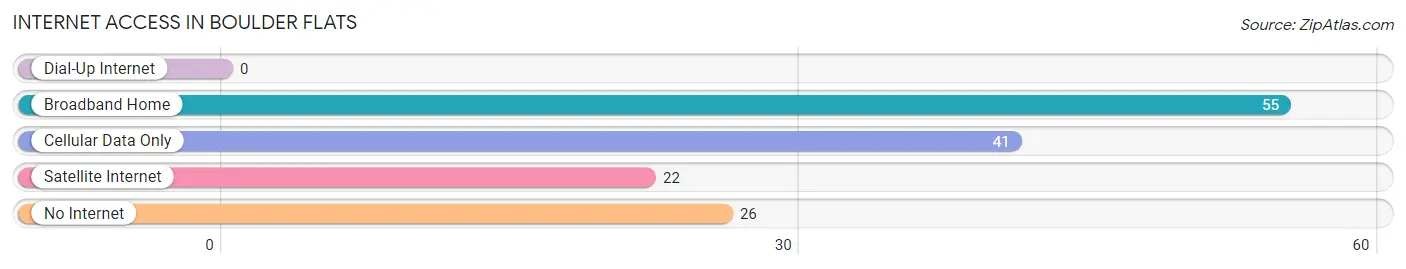
| Internet Type | # Households | % Households |
| Dial-Up Internet | 0 | 0.0% |
| Broadband Home | 55 | 36.7% |
| Cellular Data Only | 41 | 27.3% |
| Satellite Internet | 22 | 14.7% |
| No Internet | 26 | 17.3% |
| Total | 150 | 100.0% |
Boulder Flats Summary
Boulder Flats, Wyoming is a small town located in the southeastern corner of the state. It is situated in the foothills of the Wind River Range, and is surrounded by the vast expanse of the Great Plains. The town has a population of just over 500 people, and is a popular destination for outdoor enthusiasts.
History
The area that is now Boulder Flats was first settled in the late 1800s by homesteaders. The town was originally called “Boulder”, and was named after the large boulder that sits at the center of town. The town was officially incorporated in 1909, and the name was changed to “Boulder Flats” to reflect the flat terrain of the area.
The town grew slowly over the years, and by the 1950s it had become a popular destination for tourists and outdoor enthusiasts. The town was also home to a number of small businesses, including a general store, a gas station, and a few restaurants.
Geography
Boulder Flats is located in the southeastern corner of Wyoming, in the foothills of the Wind River Range. The town is situated at an elevation of 5,000 feet, and is surrounded by the vast expanse of the Great Plains. The town is located near the headwaters of the Green River, and is just a few miles from the Wyoming-Utah border.
The town is located in a semi-arid climate, and receives an average of just over 10 inches of precipitation per year. The area is known for its wide open spaces, and is home to a variety of wildlife, including deer, elk, antelope, and bighorn sheep.
Economy
The economy of Boulder Flats is largely based on tourism and outdoor recreation. The town is a popular destination for hikers, campers, and hunters, and is home to a number of small businesses that cater to these activities. The town is also home to a number of small manufacturing businesses, including a furniture factory and a metal fabrication shop.
Demographics
As of the 2010 census, the population of Boulder Flats was 514 people. The town is predominantly white, with a small Hispanic population. The median household income is $41,250, and the median age is 44. The town is home to a number of small businesses, and the unemployment rate is just 4.2%.
Common Questions
What is Per Capita Income in Boulder Flats?
Per Capita income in Boulder Flats is $27,771.
What is the Median Family Income in Boulder Flats?
Median Family Income in Boulder Flats is $68,750.
What is the Median Household income in Boulder Flats?
Median Household Income in Boulder Flats is $68,333.
What is Income or Wage Gap in Boulder Flats?
Income or Wage Gap in Boulder Flats is 15.3%.
Women in Boulder Flats earn 84.7 cents for every dollar earned by a man.
What is Inequality or Gini Index in Boulder Flats?
Inequality or Gini Index in Boulder Flats is 0.43.
What is the Total Population of Boulder Flats?
Total Population of Boulder Flats is 513.
What is the Total Male Population of Boulder Flats?
Total Male Population of Boulder Flats is 259.
What is the Total Female Population of Boulder Flats?
Total Female Population of Boulder Flats is 254.
What is the Ratio of Males per 100 Females in Boulder Flats?
There are 101.97 Males per 100 Females in Boulder Flats.
What is the Ratio of Females per 100 Males in Boulder Flats?
There are 98.07 Females per 100 Males in Boulder Flats.
What is the Median Population Age in Boulder Flats?
Median Population Age in Boulder Flats is 38.1 Years.
What is the Average Family Size in Boulder Flats
Average Family Size in Boulder Flats is 4.2 People.
What is the Average Household Size in Boulder Flats
Average Household Size in Boulder Flats is 3.4 People.
How Large is the Labor Force in Boulder Flats?
There are 216 People in the Labor Forcein in Boulder Flats.
What is the Percentage of People in the Labor Force in Boulder Flats?
54.0% of People are in the Labor Force in Boulder Flats.
What is the Unemployment Rate in Boulder Flats?
Unemployment Rate in Boulder Flats is 15.3%.