Eden, WY Map & Demographics
Eden Map
Eden Overview
$36,969
PER CAPITA INCOME
$82,667
AVG FAMILY INCOME
$68,781
AVG HOUSEHOLD INCOME
73.2%
WAGE / INCOME GAP [ % ]
26.8¢/ $1
WAGE / INCOME GAP [ $ ]
0.36
INEQUALITY / GINI INDEX
236
TOTAL POPULATION
101
MALE POPULATION
135
FEMALE POPULATION
74.81
MALES / 100 FEMALES
133.66
FEMALES / 100 MALES
54.1
MEDIAN AGE
2.3
AVG FAMILY SIZE
1.9
AVG HOUSEHOLD SIZE
156
LABOR FORCE [ PEOPLE ]
78.0%
PERCENT IN LABOR FORCE
Eden Area Codes
Income in Eden
Income Overview in Eden
Per Capita Income in Eden is $36,969, while median incomes of families and households are $82,667 and $68,781 respectively.
| Characteristic | Number | Measure |
| Per Capita Income | 236 | $36,969 |
| Median Family Income | 82 | $82,667 |
| Mean Family Income | 82 | $101,588 |
| Median Household Income | 123 | $68,781 |
| Mean Household Income | 123 | $77,461 |
| Income Deficit | 82 | $0 |
| Wage / Income Gap (%) | 236 | 73.20% |
| Wage / Income Gap ($) | 236 | 26.80¢ per $1 |
| Gini / Inequality Index | 236 | 0.36 |
Earnings by Sex in Eden
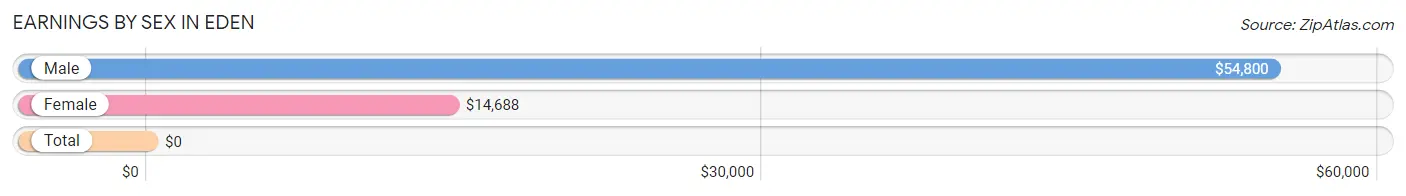
| Sex | Number | Average Earnings |
| Male | 66 (42.3%) | $54,800 |
| Female | 90 (57.7%) | $14,688 |
| Total | 156 (100.0%) | $0 |
Earnings by Sex by Income Bracket in Eden
The most common earnings brackets in Eden are $50,000 to $54,999 for men (25 | 37.9%) and $12,500 to $14,999 for women (40 | 44.4%).
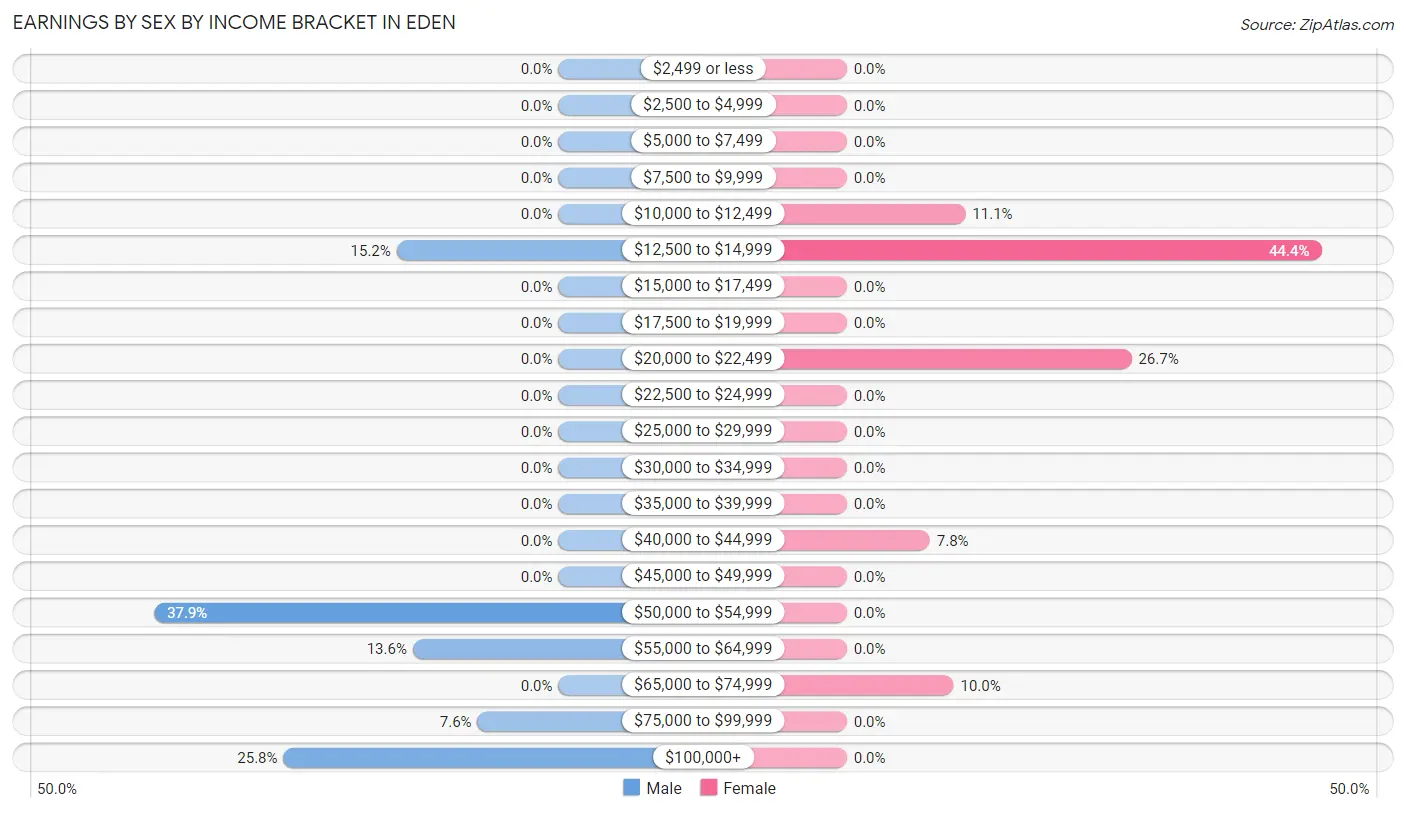
| Income | Male | Female |
| $2,499 or less | 0 (0.0%) | 0 (0.0%) |
| $2,500 to $4,999 | 0 (0.0%) | 0 (0.0%) |
| $5,000 to $7,499 | 0 (0.0%) | 0 (0.0%) |
| $7,500 to $9,999 | 0 (0.0%) | 0 (0.0%) |
| $10,000 to $12,499 | 0 (0.0%) | 10 (11.1%) |
| $12,500 to $14,999 | 10 (15.1%) | 40 (44.4%) |
| $15,000 to $17,499 | 0 (0.0%) | 0 (0.0%) |
| $17,500 to $19,999 | 0 (0.0%) | 0 (0.0%) |
| $20,000 to $22,499 | 0 (0.0%) | 24 (26.7%) |
| $22,500 to $24,999 | 0 (0.0%) | 0 (0.0%) |
| $25,000 to $29,999 | 0 (0.0%) | 0 (0.0%) |
| $30,000 to $34,999 | 0 (0.0%) | 0 (0.0%) |
| $35,000 to $39,999 | 0 (0.0%) | 0 (0.0%) |
| $40,000 to $44,999 | 0 (0.0%) | 7 (7.8%) |
| $45,000 to $49,999 | 0 (0.0%) | 0 (0.0%) |
| $50,000 to $54,999 | 25 (37.9%) | 0 (0.0%) |
| $55,000 to $64,999 | 9 (13.6%) | 0 (0.0%) |
| $65,000 to $74,999 | 0 (0.0%) | 9 (10.0%) |
| $75,000 to $99,999 | 5 (7.6%) | 0 (0.0%) |
| $100,000+ | 17 (25.8%) | 0 (0.0%) |
| Total | 66 (100.0%) | 90 (100.0%) |
Earnings by Sex by Educational Attainment in Eden
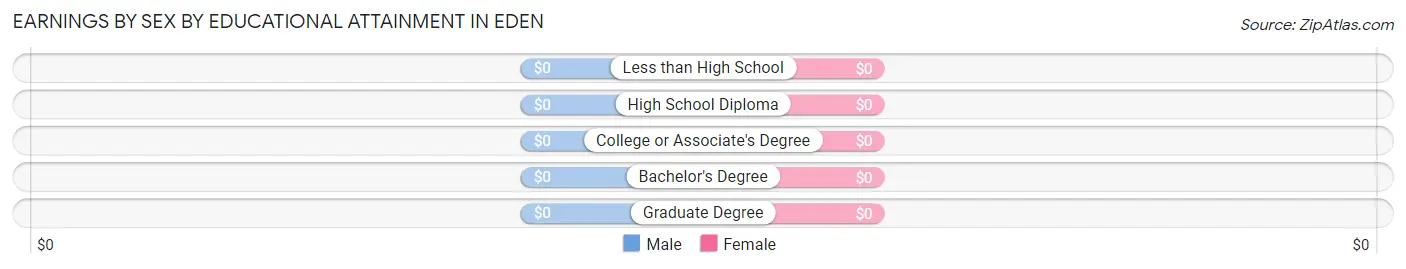
| Educational Attainment | Male Income | Female Income |
| Less than High School | - | - |
| High School Diploma | - | - |
| College or Associate's Degree | - | - |
| Bachelor's Degree | - | - |
| Graduate Degree | - | - |
| Total | $54,800 | $14,688 |
Family Income in Eden
Family Income Brackets in Eden
According to the Eden family income data, there are 40 families falling into the $50,000 to $74,999 income range, which is the most common income bracket and makes up 48.8% of all families.
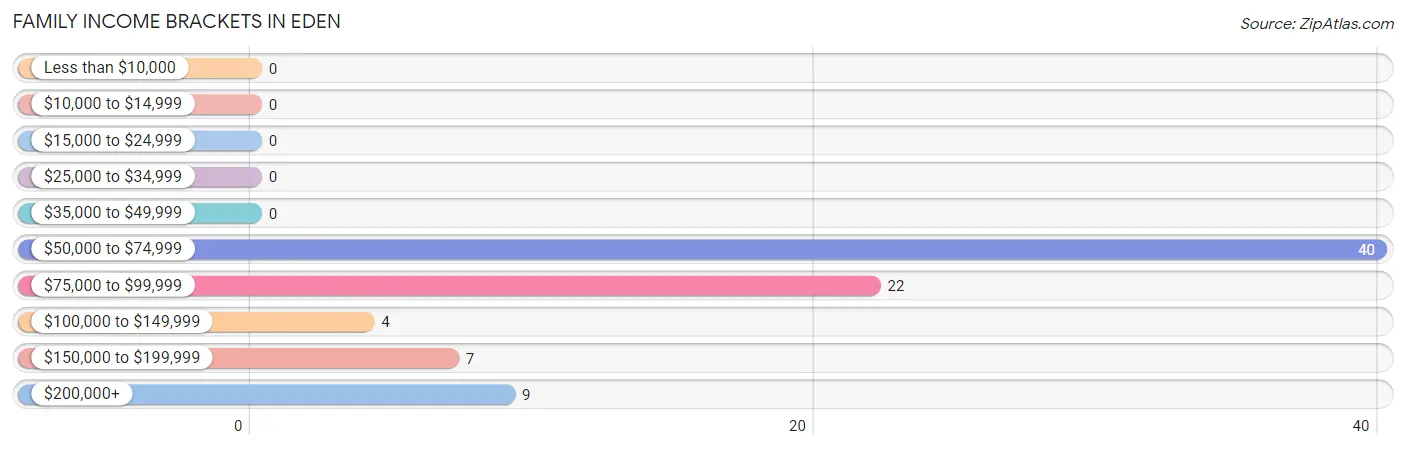
| Income Bracket | # Families | % Families |
| Less than $10,000 | 0 | 0.0% |
| $10,000 to $14,999 | 0 | 0.0% |
| $15,000 to $24,999 | 0 | 0.0% |
| $25,000 to $34,999 | 0 | 0.0% |
| $35,000 to $49,999 | 0 | 0.0% |
| $50,000 to $74,999 | 40 | 48.8% |
| $75,000 to $99,999 | 22 | 26.8% |
| $100,000 to $149,999 | 4 | 4.9% |
| $150,000 to $199,999 | 7 | 8.5% |
| $200,000+ | 9 | 11.0% |
Family Income by Famaliy Size in Eden
2-person families (70 | 85.4%) account for the highest median family income in Eden with $69,688 per family, while 2-person families (70 | 85.4%) have the highest median income of $34,844 per family member.
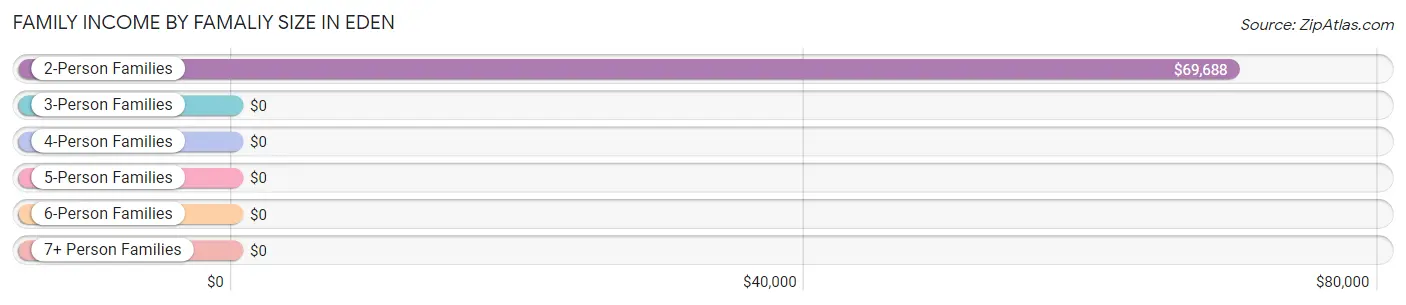
| Income Bracket | # Families | Median Income |
| 2-Person Families | 70 (85.4%) | $69,688 |
| 3-Person Families | 0 (0.0%) | $0 |
| 4-Person Families | 7 (8.5%) | $0 |
| 5-Person Families | 0 (0.0%) | $0 |
| 6-Person Families | 5 (6.1%) | $0 |
| 7+ Person Families | 0 (0.0%) | $0 |
| Total | 82 (100.0%) | $82,667 |
Family Income by Number of Earners in Eden
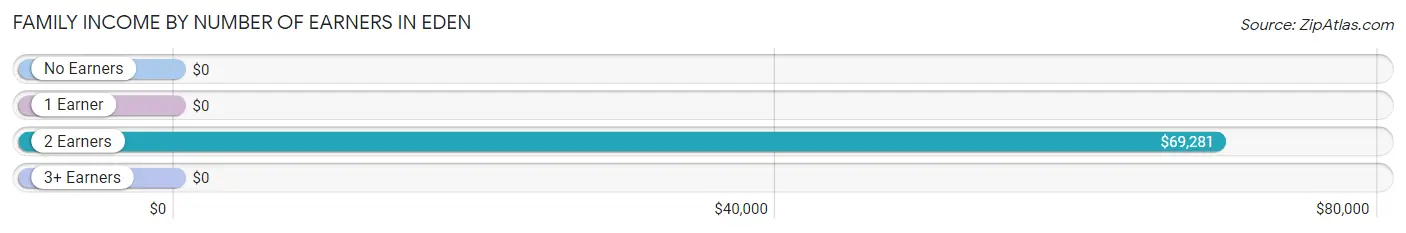
| Number of Earners | # Families | Median Income |
| No Earners | 11 (13.4%) | $0 |
| 1 Earner | 14 (17.1%) | $0 |
| 2 Earners | 57 (69.5%) | $69,281 |
| 3+ Earners | 0 (0.0%) | $0 |
| Total | 82 (100.0%) | $82,667 |
Household Income in Eden
Household Income Brackets in Eden
With 49 households falling in the category, the $50,000 to $74,999 income range is the most frequent in Eden, accounting for 39.8% of all households.
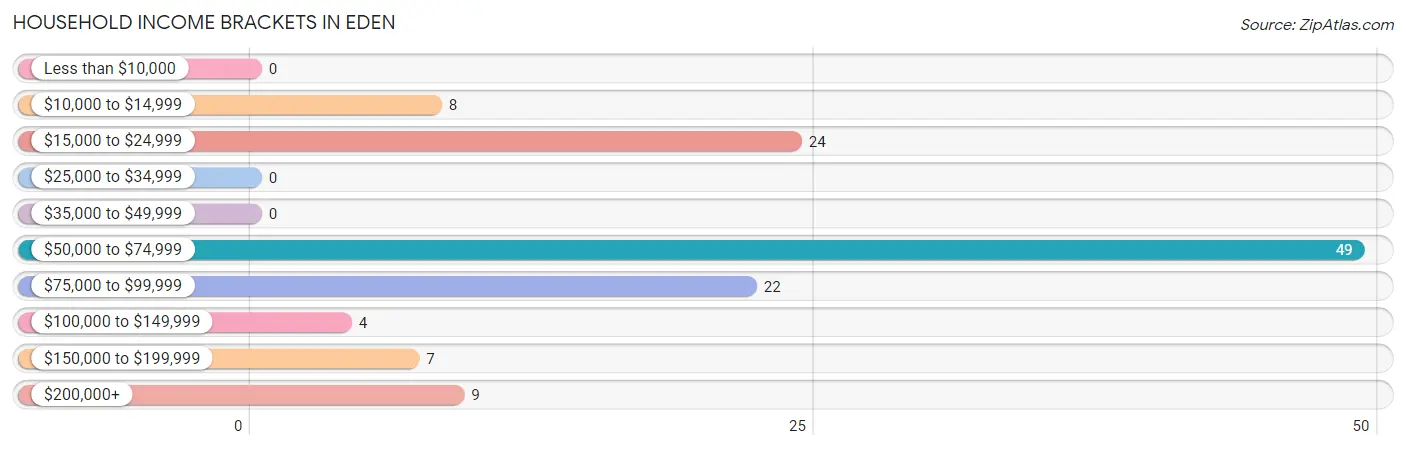
| Income Bracket | # Households | % Households |
| Less than $10,000 | 0 | 0.0% |
| $10,000 to $14,999 | 8 | 6.5% |
| $15,000 to $24,999 | 24 | 19.5% |
| $25,000 to $34,999 | 0 | 0.0% |
| $35,000 to $49,999 | 0 | 0.0% |
| $50,000 to $74,999 | 49 | 39.8% |
| $75,000 to $99,999 | 22 | 17.9% |
| $100,000 to $149,999 | 4 | 3.3% |
| $150,000 to $199,999 | 7 | 5.7% |
| $200,000+ | 9 | 7.3% |
Household Income by Householder Age in Eden
The median household income in Eden is $68,781, with the highest median household income of $68,594 found in the 45 to 64 years age bracket for the primary householder. A total of 83 households (67.5%) fall into this category.
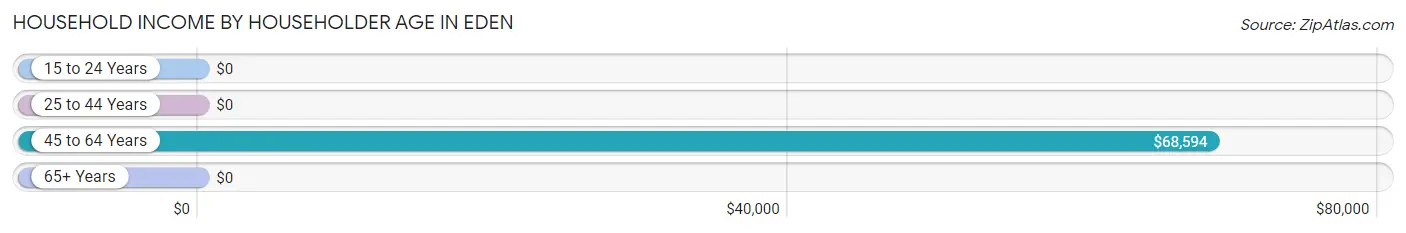
| Income Bracket | # Households | Median Income |
| 15 to 24 Years | 0 (0.0%) | $0 |
| 25 to 44 Years | 21 (17.1%) | $0 |
| 45 to 64 Years | 83 (67.5%) | $68,594 |
| 65+ Years | 19 (15.4%) | $0 |
| Total | 123 (100.0%) | $68,781 |
Poverty in Eden
Income Below Poverty by Sex and Age in Eden
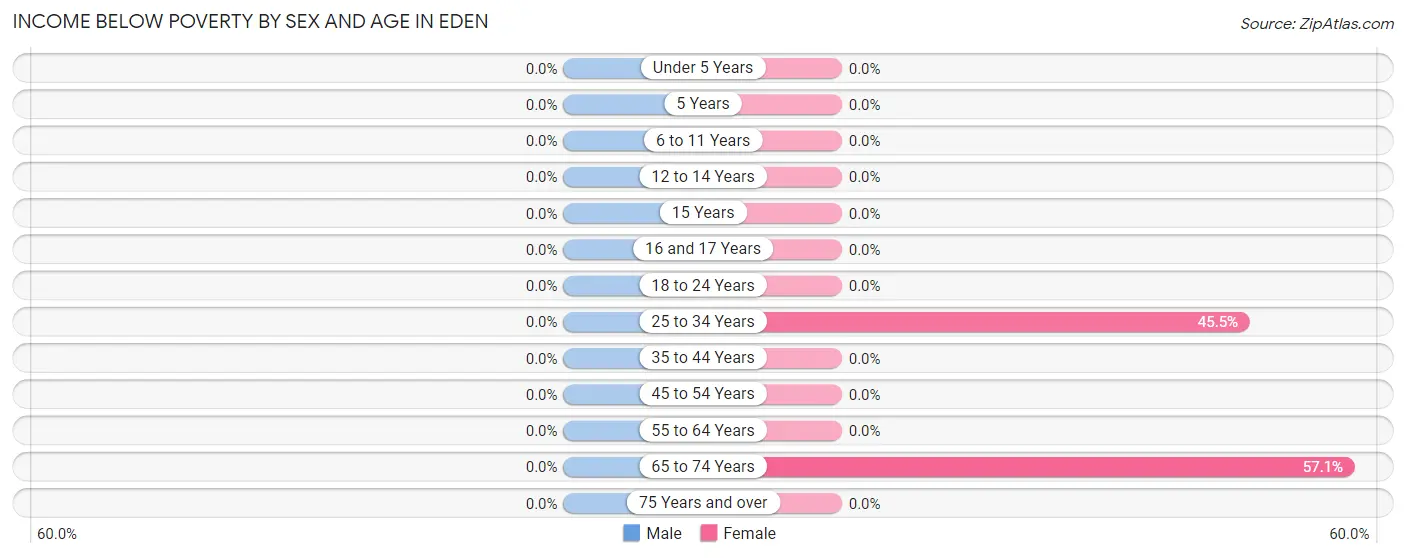
| Age Bracket | Male | Female |
| Under 5 Years | 0 (0.0%) | 0 (0.0%) |
| 5 Years | 0 (0.0%) | 0 (0.0%) |
| 6 to 11 Years | 0 (0.0%) | 0 (0.0%) |
| 12 to 14 Years | 0 (0.0%) | 0 (0.0%) |
| 15 Years | 0 (0.0%) | 0 (0.0%) |
| 16 and 17 Years | 0 (0.0%) | 0 (0.0%) |
| 18 to 24 Years | 0 (0.0%) | 0 (0.0%) |
| 25 to 34 Years | 0 (0.0%) | 10 (45.5%) |
| 35 to 44 Years | 0 (0.0%) | 0 (0.0%) |
| 45 to 54 Years | 0 (0.0%) | 0 (0.0%) |
| 55 to 64 Years | 0 (0.0%) | 0 (0.0%) |
| 65 to 74 Years | 0 (0.0%) | 8 (57.1%) |
| 75 Years and over | 0 (0.0%) | 0 (0.0%) |
| Total | 0 (0.0%) | 18 (13.3%) |
Income Above Poverty by Sex and Age in Eden
According to the poverty statistics in Eden, males aged 6 to 11 years and females aged under 5 years are the age groups that are most secure financially, with 100.0% of males and 100.0% of females in these age groups living above the poverty line.
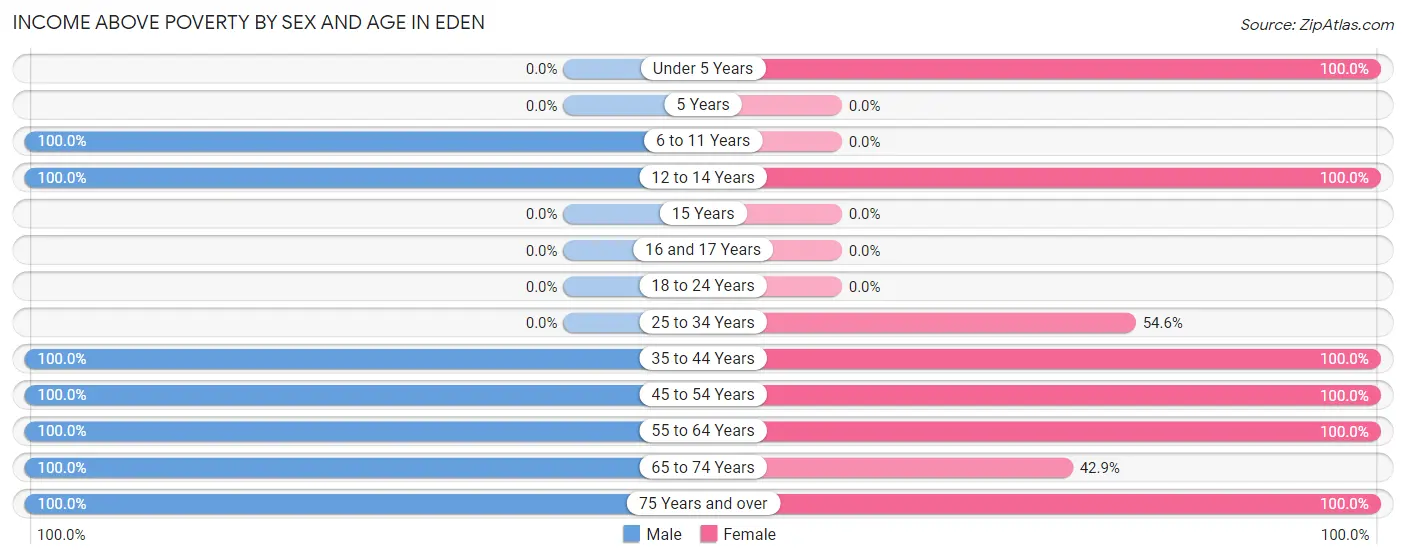
| Age Bracket | Male | Female |
| Under 5 Years | 0 (0.0%) | 5 (100.0%) |
| 5 Years | 0 (0.0%) | 0 (0.0%) |
| 6 to 11 Years | 10 (100.0%) | 0 (0.0%) |
| 12 to 14 Years | 14 (100.0%) | 7 (100.0%) |
| 15 Years | 0 (0.0%) | 0 (0.0%) |
| 16 and 17 Years | 0 (0.0%) | 0 (0.0%) |
| 18 to 24 Years | 0 (0.0%) | 0 (0.0%) |
| 25 to 34 Years | 0 (0.0%) | 12 (54.5%) |
| 35 to 44 Years | 22 (100.0%) | 10 (100.0%) |
| 45 to 54 Years | 25 (100.0%) | 33 (100.0%) |
| 55 to 64 Years | 19 (100.0%) | 40 (100.0%) |
| 65 to 74 Years | 7 (100.0%) | 6 (42.9%) |
| 75 Years and over | 4 (100.0%) | 4 (100.0%) |
| Total | 101 (100.0%) | 117 (86.7%) |
Income Below Poverty Among Married-Couple Families in Eden
| Children | Above Poverty | Below Poverty |
| No Children | 70 (100.0%) | 0 (0.0%) |
| 1 or 2 Children | 7 (100.0%) | 0 (0.0%) |
| 3 or 4 Children | 5 (100.0%) | 0 (0.0%) |
| 5 or more Children | 0 (0.0%) | 0 (0.0%) |
| Total | 82 (100.0%) | 0 (0.0%) |
Income Below Poverty Among Single-Parent Households in Eden
| Children | Single Father | Single Mother |
| No Children | 0 (0.0%) | 0 (0.0%) |
| 1 or 2 Children | 0 (0.0%) | 0 (0.0%) |
| 3 or 4 Children | 0 (0.0%) | 0 (0.0%) |
| 5 or more Children | 0 (0.0%) | 0 (0.0%) |
| Total | 0 (0.0%) | 0 (0.0%) |
Income Below Poverty Among Married-Couple vs Single-Parent Households in Eden
| Children | Married-Couple Families | Single-Parent Households |
| No Children | 0 (0.0%) | 0 (0.0%) |
| 1 or 2 Children | 0 (0.0%) | 0 (0.0%) |
| 3 or 4 Children | 0 (0.0%) | 0 (0.0%) |
| 5 or more Children | 0 (0.0%) | 0 (0.0%) |
| Total | 0 (0.0%) | 0 (0.0%) |
Race in Eden
The most populous races in Eden are , and White / Caucasian (236 | 100.0%).
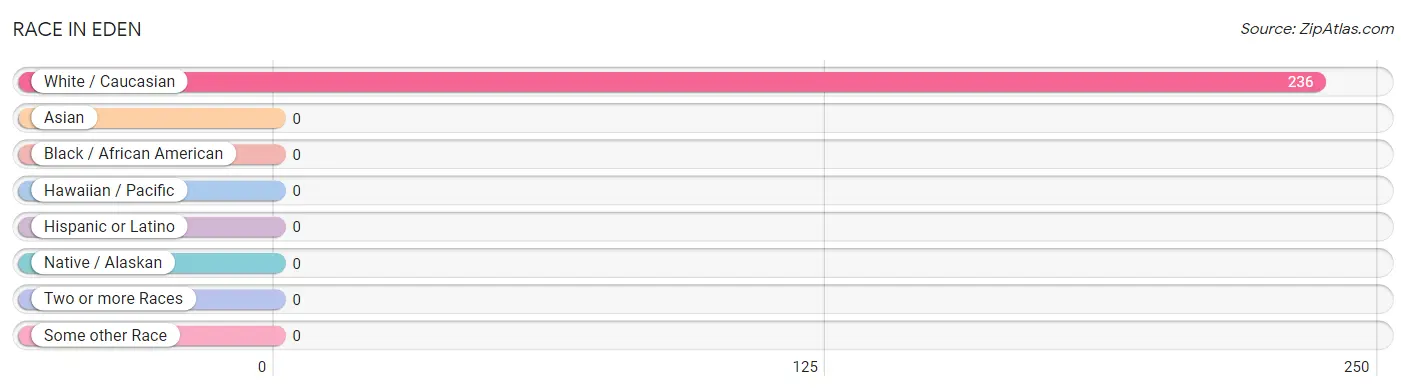
| Race | # Population | % Population |
| Asian | 0 | 0.0% |
| Black / African American | 0 | 0.0% |
| Hawaiian / Pacific | 0 | 0.0% |
| Hispanic or Latino | 0 | 0.0% |
| Native / Alaskan | 0 | 0.0% |
| White / Caucasian | 236 | 100.0% |
| Two or more Races | 0 | 0.0% |
| Some other Race | 0 | 0.0% |
| Total | 236 | 100.0% |
Ancestry in Eden
The most populous ancestries reported in Eden are Italian (65 | 27.5%), Jamaican (65 | 27.5%), German (40 | 17.0%), English (33 | 14.0%), and American (19 | 8.1%), together accounting for 94.1% of all Eden residents.
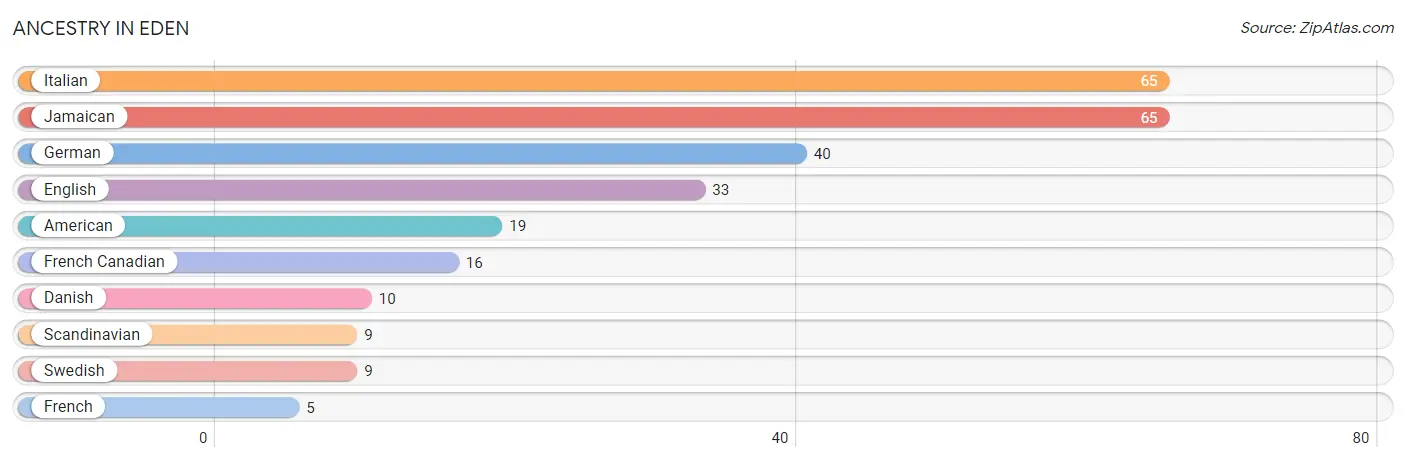
| Ancestry | # Population | % Population |
| American | 19 | 8.1% |
| Danish | 10 | 4.2% |
| English | 33 | 14.0% |
| French | 5 | 2.1% |
| French Canadian | 16 | 6.8% |
| German | 40 | 17.0% |
| Italian | 65 | 27.5% |
| Jamaican | 65 | 27.5% |
| Scandinavian | 9 | 3.8% |
| Swedish | 9 | 3.8% | View All 10 Rows |
Immigrants in Eden

| Immigration Origin | # Population | % Population | View All 0 Rows |
Sex and Age in Eden
Sex and Age in Eden
The most populous age groups in Eden are 50 to 54 Years (25 | 24.7%) for men and 55 to 59 Years (40 | 29.6%) for women.
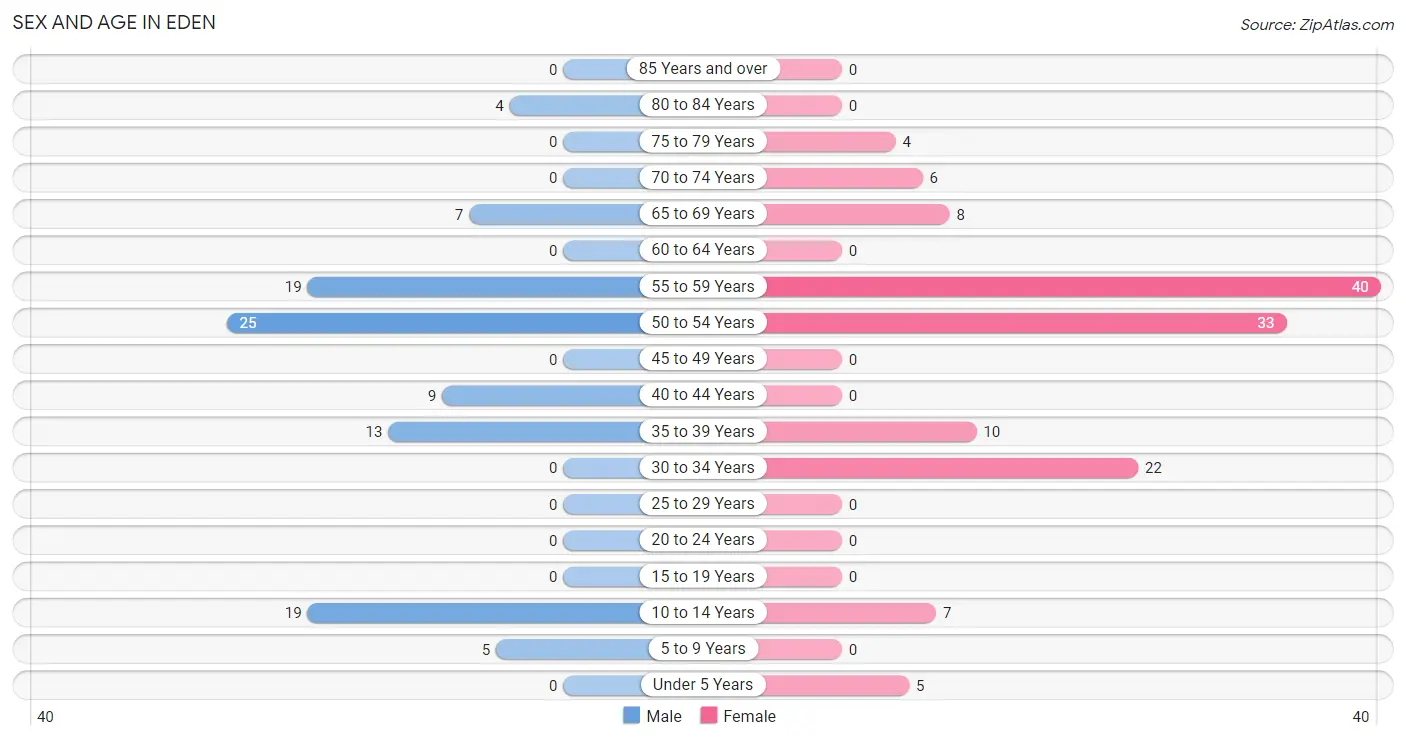
| Age Bracket | Male | Female |
| Under 5 Years | 0 (0.0%) | 5 (3.7%) |
| 5 to 9 Years | 5 (5.0%) | 0 (0.0%) |
| 10 to 14 Years | 19 (18.8%) | 7 (5.2%) |
| 15 to 19 Years | 0 (0.0%) | 0 (0.0%) |
| 20 to 24 Years | 0 (0.0%) | 0 (0.0%) |
| 25 to 29 Years | 0 (0.0%) | 0 (0.0%) |
| 30 to 34 Years | 0 (0.0%) | 22 (16.3%) |
| 35 to 39 Years | 13 (12.9%) | 10 (7.4%) |
| 40 to 44 Years | 9 (8.9%) | 0 (0.0%) |
| 45 to 49 Years | 0 (0.0%) | 0 (0.0%) |
| 50 to 54 Years | 25 (24.7%) | 33 (24.4%) |
| 55 to 59 Years | 19 (18.8%) | 40 (29.6%) |
| 60 to 64 Years | 0 (0.0%) | 0 (0.0%) |
| 65 to 69 Years | 7 (6.9%) | 8 (5.9%) |
| 70 to 74 Years | 0 (0.0%) | 6 (4.4%) |
| 75 to 79 Years | 0 (0.0%) | 4 (3.0%) |
| 80 to 84 Years | 4 (4.0%) | 0 (0.0%) |
| 85 Years and over | 0 (0.0%) | 0 (0.0%) |
| Total | 101 (100.0%) | 135 (100.0%) |
Families and Households in Eden
Median Family Size in Eden
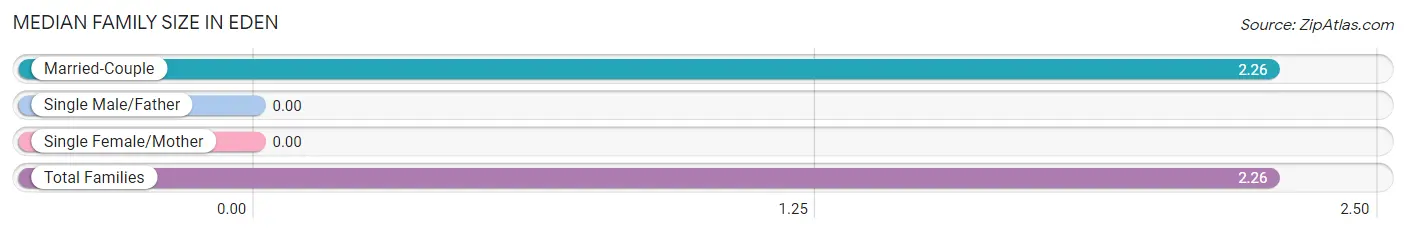
| Family Type | # Families | Family Size |
| Married-Couple | 82 (100.0%) | 2.26 |
| Single Male/Father | 0 (0.0%) | - |
| Single Female/Mother | 0 (0.0%) | - |
| Total Families | 82 (100.0%) | 2.26 |
Median Household Size in Eden
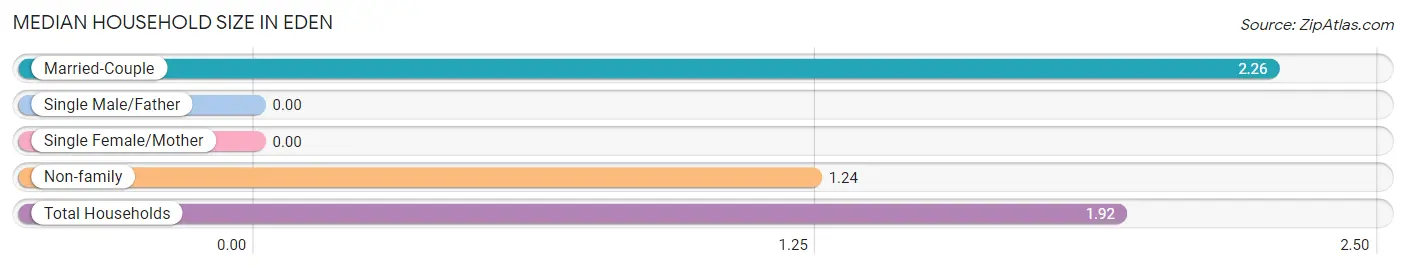
| Household Type | # Households | Household Size |
| Married-Couple | 82 (66.7%) | 2.26 |
| Single Male/Father | 0 (0.0%) | - |
| Single Female/Mother | 0 (0.0%) | - |
| Non-family | 41 (33.3%) | 1.24 |
| Total Households | 123 (100.0%) | 1.92 |
Household Size by Marriage Status in Eden
Out of a total of 123 households in Eden, 82 (66.7%) are family households, while 41 (33.3%) are nonfamily households. The most numerous type of family households are 2-person households, comprising 70, and the most common type of nonfamily households are 1-person households, comprising 32.
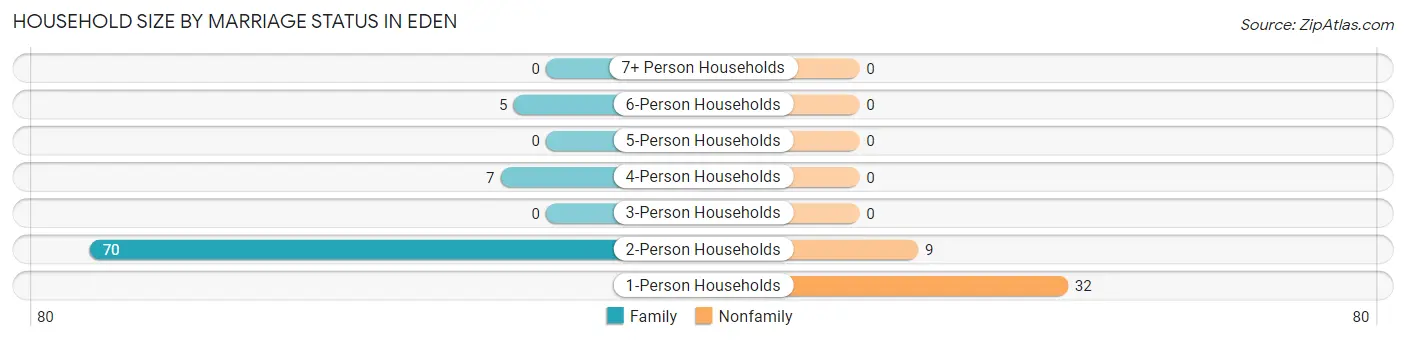
| Household Size | Family Households | Nonfamily Households |
| 1-Person Households | - | 32 (26.0%) |
| 2-Person Households | 70 (56.9%) | 9 (7.3%) |
| 3-Person Households | 0 (0.0%) | 0 (0.0%) |
| 4-Person Households | 7 (5.7%) | 0 (0.0%) |
| 5-Person Households | 0 (0.0%) | 0 (0.0%) |
| 6-Person Households | 5 (4.1%) | 0 (0.0%) |
| 7+ Person Households | 0 (0.0%) | 0 (0.0%) |
| Total | 82 (66.7%) | 41 (33.3%) |
Female Fertility in Eden
Fertility by Age in Eden
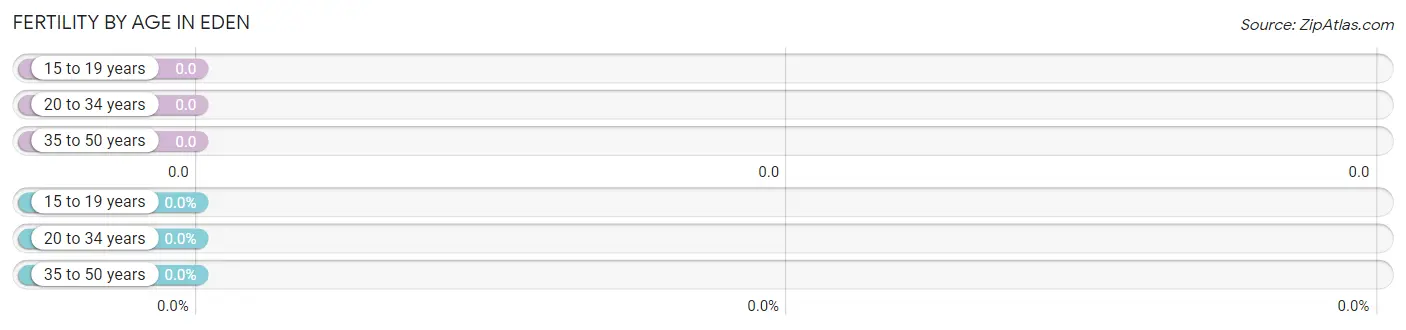
| Age Bracket | Women with Births | Births / 1,000 Women |
| 15 to 19 years | 0 (0.0%) | 0.0 |
| 20 to 34 years | 0 (0.0%) | 0.0 |
| 35 to 50 years | 0 (0.0%) | 0.0 |
| Total | 0 (0.0%) | 0.0 |
Fertility by Age by Marriage Status in Eden
| Age Bracket | Married | Unmarried |
| 15 to 19 years | 0 (0.0%) | 0 (0.0%) |
| 20 to 34 years | 0 (0.0%) | 0 (0.0%) |
| 35 to 50 years | 0 (0.0%) | 0 (0.0%) |
| Total | 0 (0.0%) | 0 (0.0%) |
Fertility by Education in Eden
| Educational Attainment | Women with Births | Births / 1,000 Women |
| Less than High School | 0 (0.0%) | 0.0 |
| High School Diploma | 0 (0.0%) | 0.0 |
| College or Associate's Degree | 0 (0.0%) | 0.0 |
| Bachelor's Degree | 0 (0.0%) | 0.0 |
| Graduate Degree | 0 (0.0%) | 0.0 |
| Total | 0 (0.0%) | 0.0 |
Fertility by Education by Marriage Status in Eden
| Educational Attainment | Married | Unmarried |
| Less than High School | 0 (0.0%) | 0 (0.0%) |
| High School Diploma | 0 (0.0%) | 0 (0.0%) |
| College or Associate's Degree | 0 (0.0%) | 0 (0.0%) |
| Bachelor's Degree | 0 (0.0%) | 0 (0.0%) |
| Graduate Degree | 0 (0.0%) | 0 (0.0%) |
| Total | 0 (0.0%) | 0 (0.0%) |
Employment Characteristics in Eden
Employment by Class of Employer in Eden
Among the 156 employed individuals in Eden, self-employed (incorporated) (74 | 47.4%), private company employees (51 | 32.7%), and not-for-profit organizations (12 | 7.7%) make up the most common classes of employment.
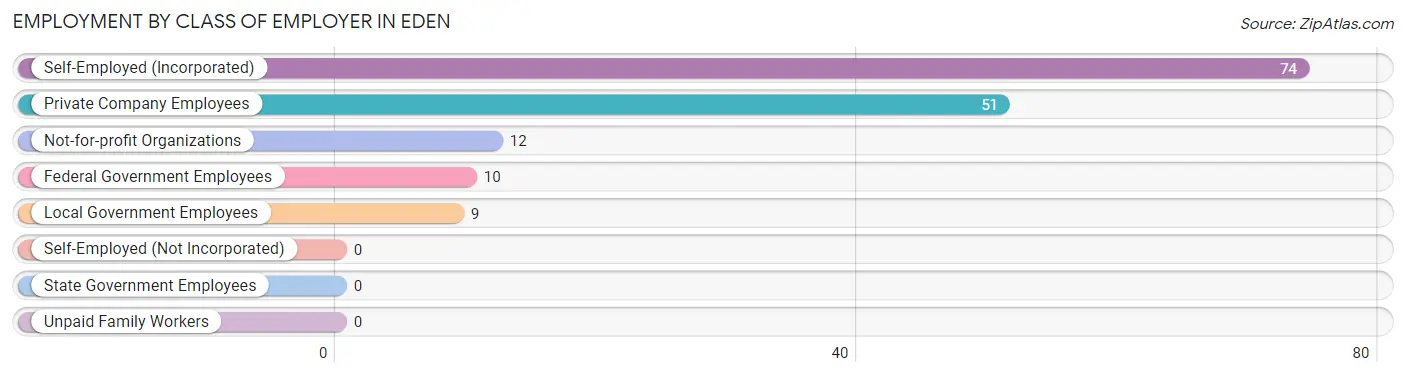
| Employer Class | # Employees | % Employees |
| Private Company Employees | 51 | 32.7% |
| Self-Employed (Incorporated) | 74 | 47.4% |
| Self-Employed (Not Incorporated) | 0 | 0.0% |
| Not-for-profit Organizations | 12 | 7.7% |
| Local Government Employees | 9 | 5.8% |
| State Government Employees | 0 | 0.0% |
| Federal Government Employees | 10 | 6.4% |
| Unpaid Family Workers | 0 | 0.0% |
| Total | 156 | 100.0% |
Employment Status by Age in Eden
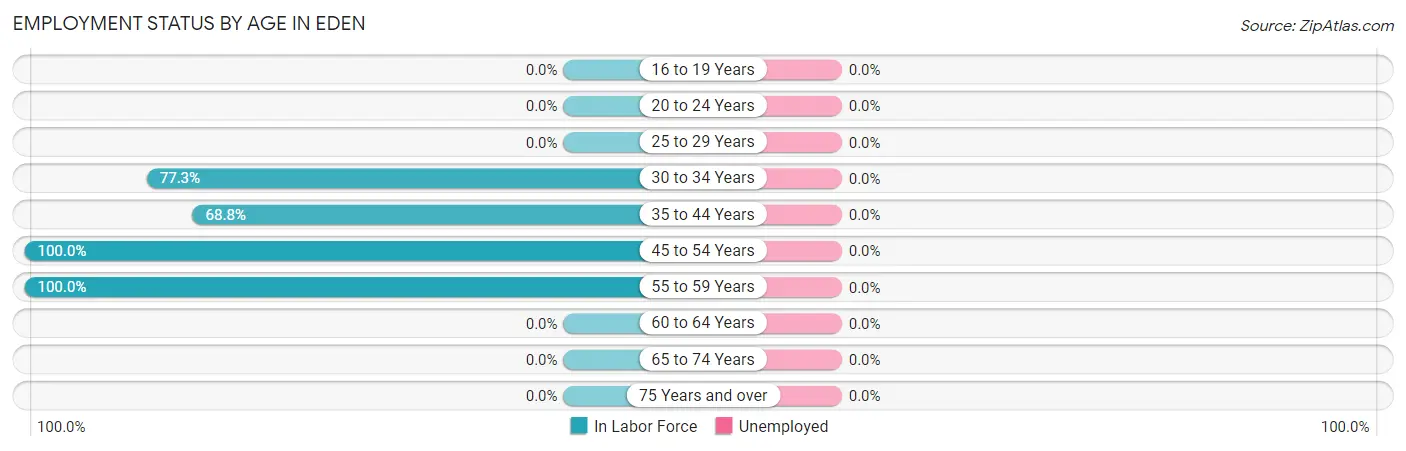
| Age Bracket | In Labor Force | Unemployed |
| 16 to 19 Years | 0 (0.0%) | 0 (0.0%) |
| 20 to 24 Years | 0 (0.0%) | 0 (0.0%) |
| 25 to 29 Years | 0 (0.0%) | 0 (0.0%) |
| 30 to 34 Years | 17 (77.3%) | 0 (0.0%) |
| 35 to 44 Years | 22 (68.8%) | 0 (0.0%) |
| 45 to 54 Years | 58 (100.0%) | 0 (0.0%) |
| 55 to 59 Years | 59 (100.0%) | 0 (0.0%) |
| 60 to 64 Years | 0 (0.0%) | 0 (0.0%) |
| 65 to 74 Years | 0 (0.0%) | 0 (0.0%) |
| 75 Years and over | 0 (0.0%) | 0 (0.0%) |
| Total | 156 (78.0%) | 0 (0.0%) |
Employment Status by Educational Attainment in Eden
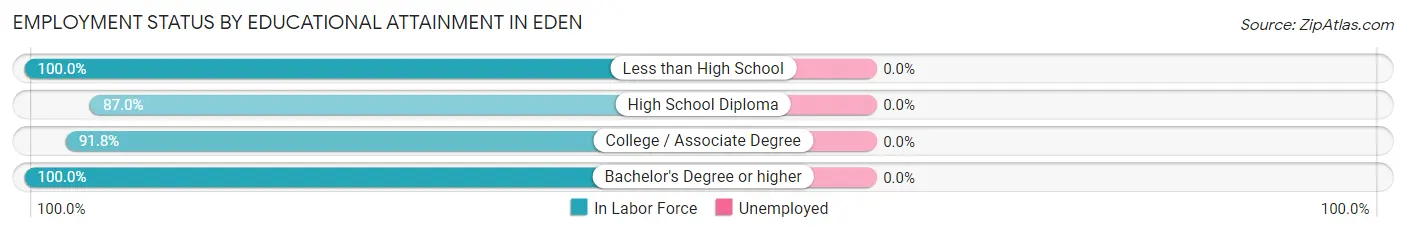
| Educational Attainment | In Labor Force | Unemployed |
| Less than High School | 9 (100.0%) | 0 (0.0%) |
| High School Diploma | 67 (87.0%) | 0 (0.0%) |
| College / Associate Degree | 56 (91.8%) | 0 (0.0%) |
| Bachelor's Degree or higher | 24 (100.0%) | 0 (0.0%) |
| Total | 156 (91.2%) | 0 (0.0%) |
Employment Occupations by Sex in Eden
Management, Business, Science and Arts Occupations
The most common Management, Business, Science and Arts occupations in Eden are Community & Social Service (17 | 10.9%), Management (10 | 6.4%), Education Instruction & Library (9 | 5.8%), Arts, Media & Entertainment (8 | 5.1%), and Health Diagnosing & Treating (5 | 3.2%).
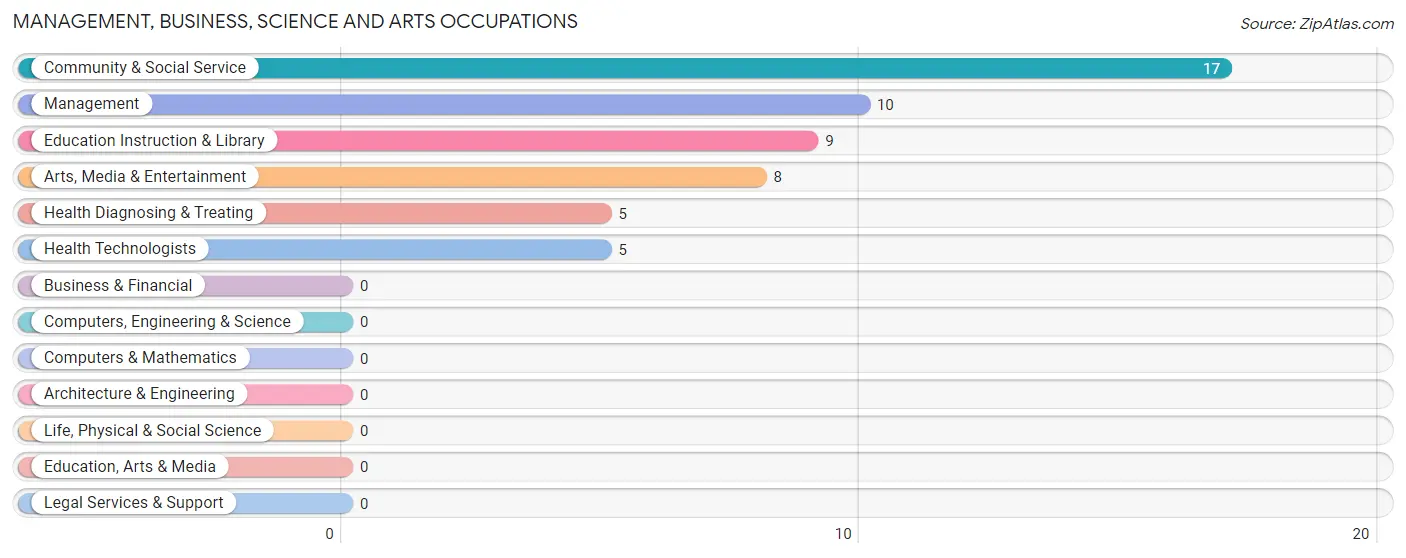
Management, Business, Science and Arts Occupations by Sex
Within the Management, Business, Science and Arts occupations in Eden, the most male-oriented occupations are Management (100.0%), Arts, Media & Entertainment (100.0%), and Health Diagnosing & Treating (100.0%), while the most female-oriented occupations are Education Instruction & Library (100.0%), and Community & Social Service (52.9%).
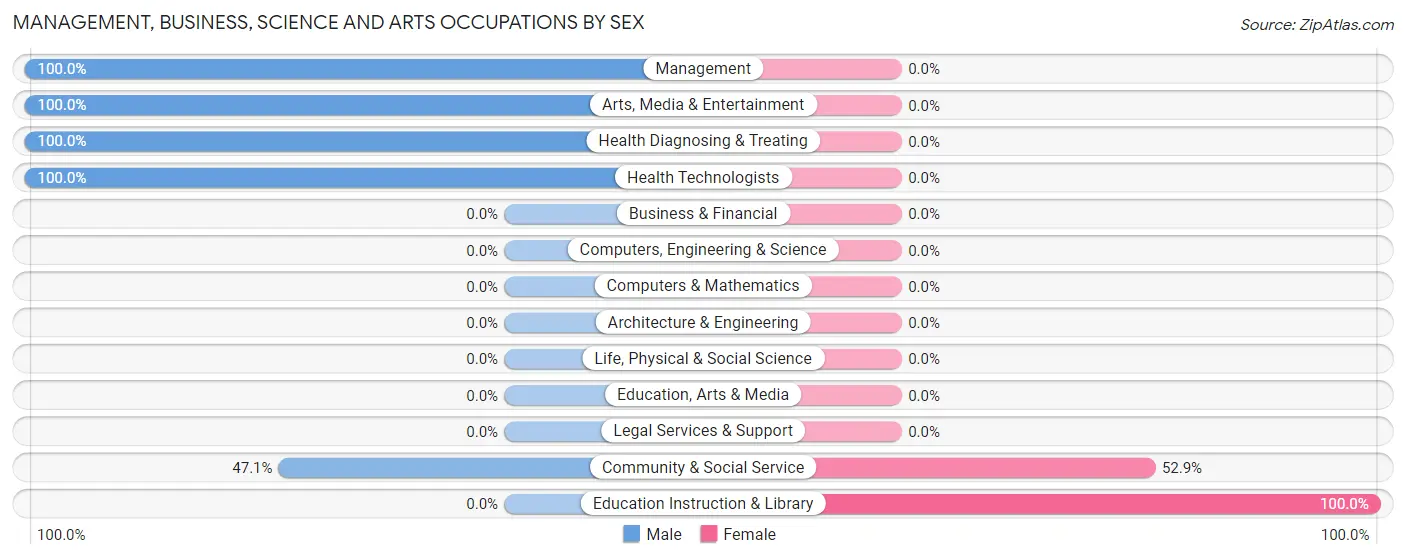
| Occupation | Male | Female |
| Management | 10 (100.0%) | 0 (0.0%) |
| Business & Financial | 0 (0.0%) | 0 (0.0%) |
| Computers, Engineering & Science | 0 (0.0%) | 0 (0.0%) |
| Computers & Mathematics | 0 (0.0%) | 0 (0.0%) |
| Architecture & Engineering | 0 (0.0%) | 0 (0.0%) |
| Life, Physical & Social Science | 0 (0.0%) | 0 (0.0%) |
| Community & Social Service | 8 (47.1%) | 9 (52.9%) |
| Education, Arts & Media | 0 (0.0%) | 0 (0.0%) |
| Legal Services & Support | 0 (0.0%) | 0 (0.0%) |
| Education Instruction & Library | 0 (0.0%) | 9 (100.0%) |
| Arts, Media & Entertainment | 8 (100.0%) | 0 (0.0%) |
| Health Diagnosing & Treating | 5 (100.0%) | 0 (0.0%) |
| Health Technologists | 5 (100.0%) | 0 (0.0%) |
| Total (Category) | 23 (71.9%) | 9 (28.1%) |
| Total (Overall) | 66 (42.3%) | 90 (57.7%) |
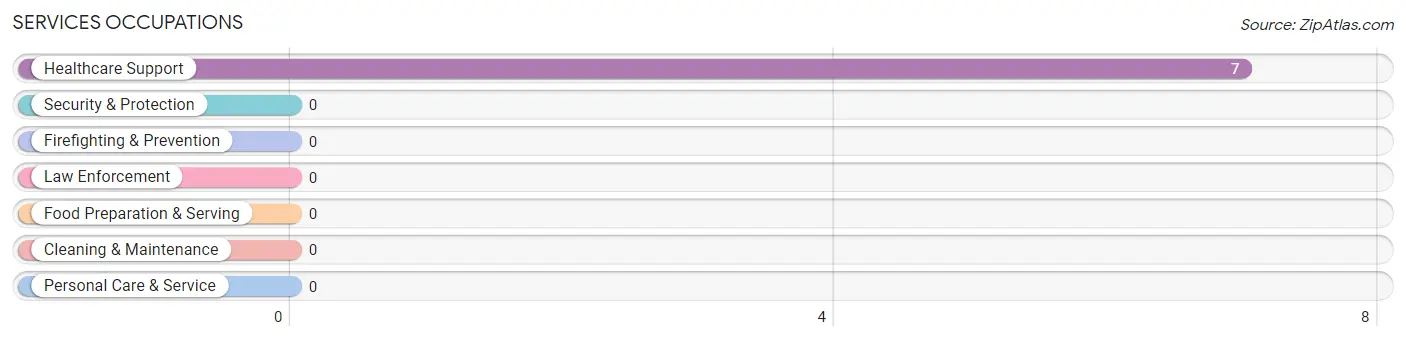
Services Occupations
The most common Services occupations in Eden are , and Healthcare Support (7 | 4.5%).
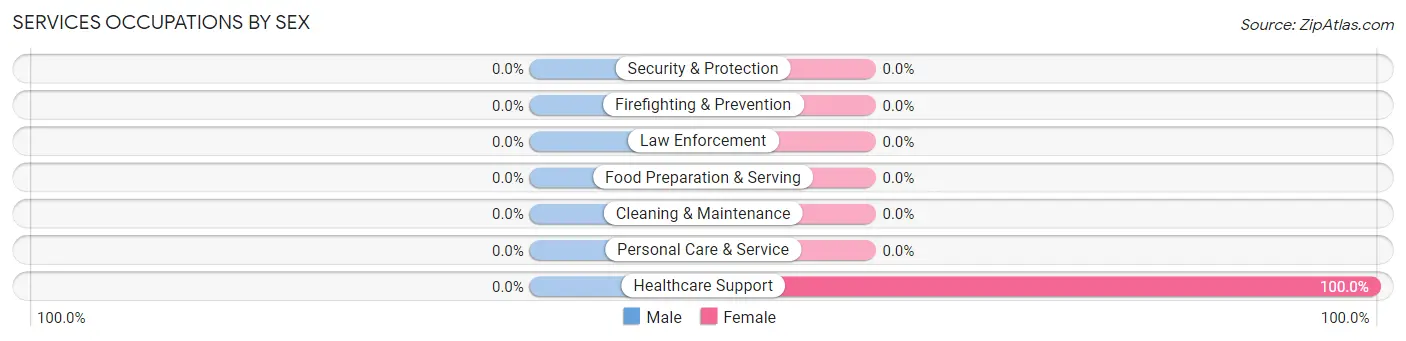
Services Occupations by Sex
| Occupation | Male | Female |
| Healthcare Support | 0 (0.0%) | 7 (100.0%) |
| Security & Protection | 0 (0.0%) | 0 (0.0%) |
| Firefighting & Prevention | 0 (0.0%) | 0 (0.0%) |
| Law Enforcement | 0 (0.0%) | 0 (0.0%) |
| Food Preparation & Serving | 0 (0.0%) | 0 (0.0%) |
| Cleaning & Maintenance | 0 (0.0%) | 0 (0.0%) |
| Personal Care & Service | 0 (0.0%) | 0 (0.0%) |
| Total (Category) | 0 (0.0%) | 7 (100.0%) |
| Total (Overall) | 66 (42.3%) | 90 (57.7%) |
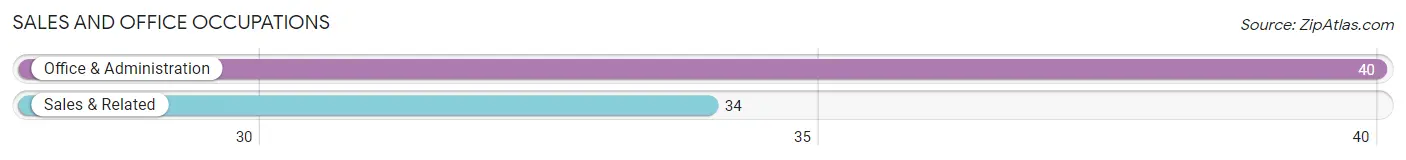
Sales and Office Occupations
The most common Sales and Office occupations in Eden are Office & Administration (40 | 25.6%), and Sales & Related (34 | 21.8%).
Sales and Office Occupations by Sex
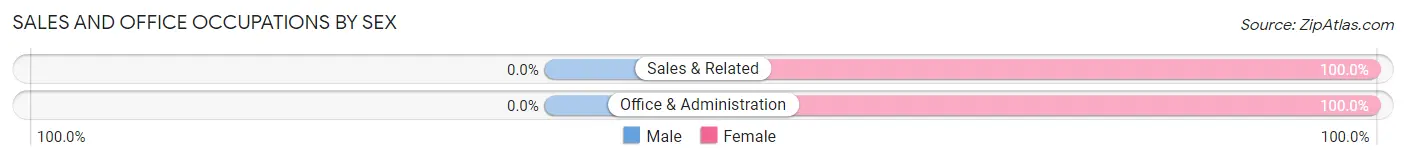
| Occupation | Male | Female |
| Sales & Related | 0 (0.0%) | 34 (100.0%) |
| Office & Administration | 0 (0.0%) | 40 (100.0%) |
| Total (Category) | 0 (0.0%) | 74 (100.0%) |
| Total (Overall) | 66 (42.3%) | 90 (57.7%) |
Natural Resources, Construction and Maintenance Occupations
The most common Natural Resources, Construction and Maintenance occupations in Eden are , and Installation, Maintenance & Repair (9 | 5.8%).
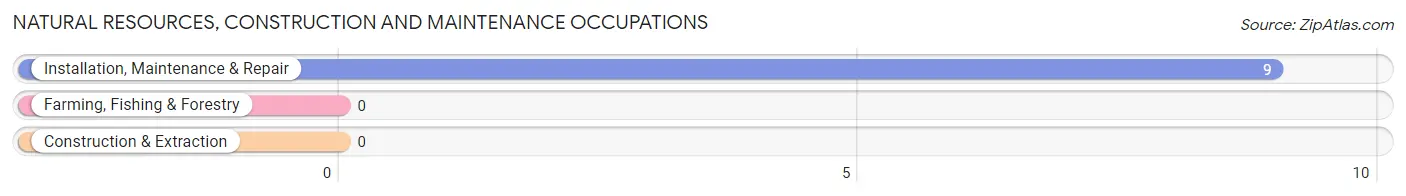
Natural Resources, Construction and Maintenance Occupations by Sex
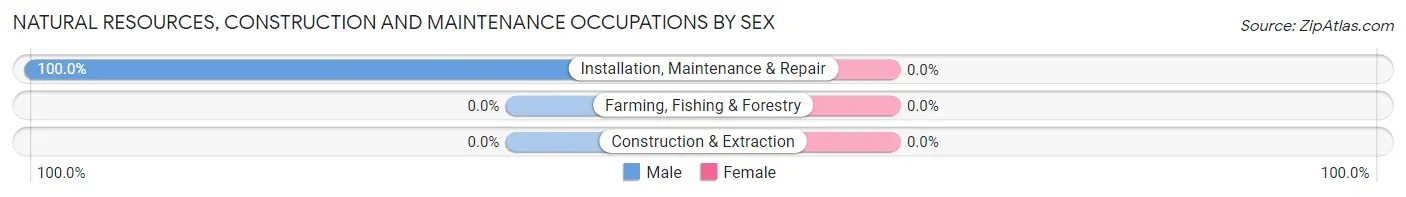
| Occupation | Male | Female |
| Farming, Fishing & Forestry | 0 (0.0%) | 0 (0.0%) |
| Construction & Extraction | 0 (0.0%) | 0 (0.0%) |
| Installation, Maintenance & Repair | 9 (100.0%) | 0 (0.0%) |
| Total (Category) | 9 (100.0%) | 0 (0.0%) |
| Total (Overall) | 66 (42.3%) | 90 (57.7%) |
Production, Transportation and Moving Occupations
The most common Production, Transportation and Moving occupations in Eden are , and Transportation (34 | 21.8%).
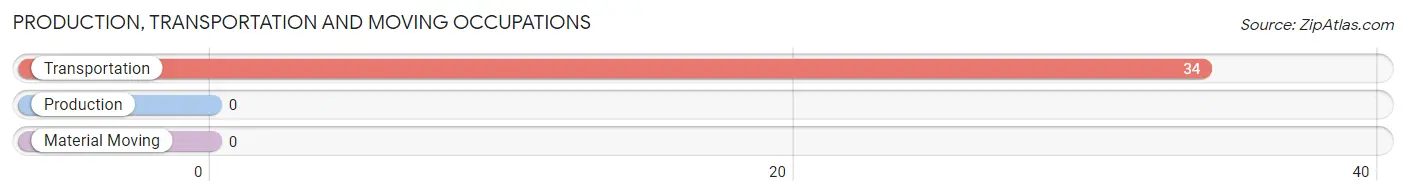
Production, Transportation and Moving Occupations by Sex
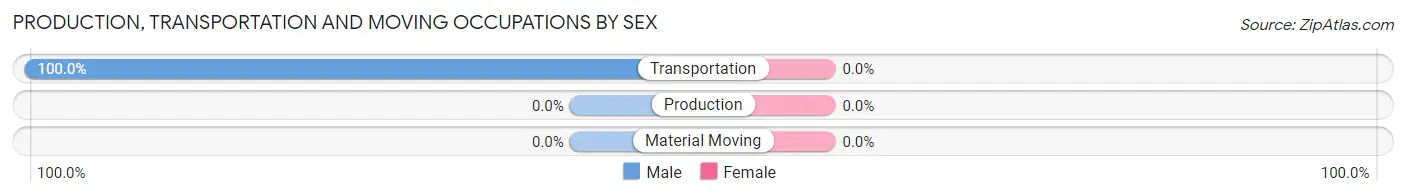
| Occupation | Male | Female |
| Production | 0 (0.0%) | 0 (0.0%) |
| Transportation | 34 (100.0%) | 0 (0.0%) |
| Material Moving | 0 (0.0%) | 0 (0.0%) |
| Total (Category) | 34 (100.0%) | 0 (0.0%) |
| Total (Overall) | 66 (42.3%) | 90 (57.7%) |
Employment Industries by Sex in Eden
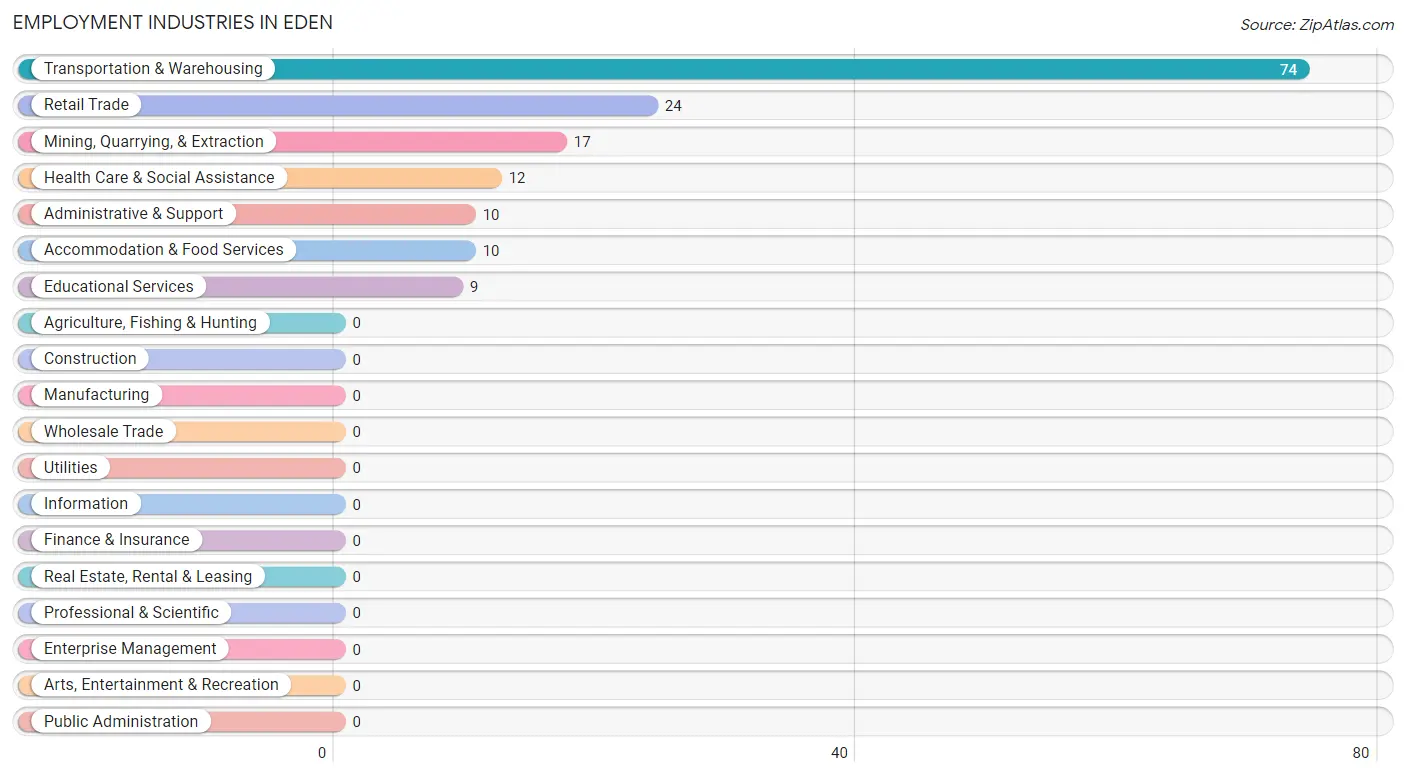
Employment Industries in Eden
The major employment industries in Eden include Transportation & Warehousing (74 | 47.4%), Retail Trade (24 | 15.4%), Mining, Quarrying, & Extraction (17 | 10.9%), Health Care & Social Assistance (12 | 7.7%), and Administrative & Support (10 | 6.4%).
Employment Industries by Sex in Eden
The Eden industries that see more men than women are Mining, Quarrying, & Extraction (100.0%), Administrative & Support (100.0%), and Transportation & Warehousing (46.0%), whereas the industries that tend to have a higher number of women are Retail Trade (100.0%), Educational Services (100.0%), and Accommodation & Food Services (100.0%).
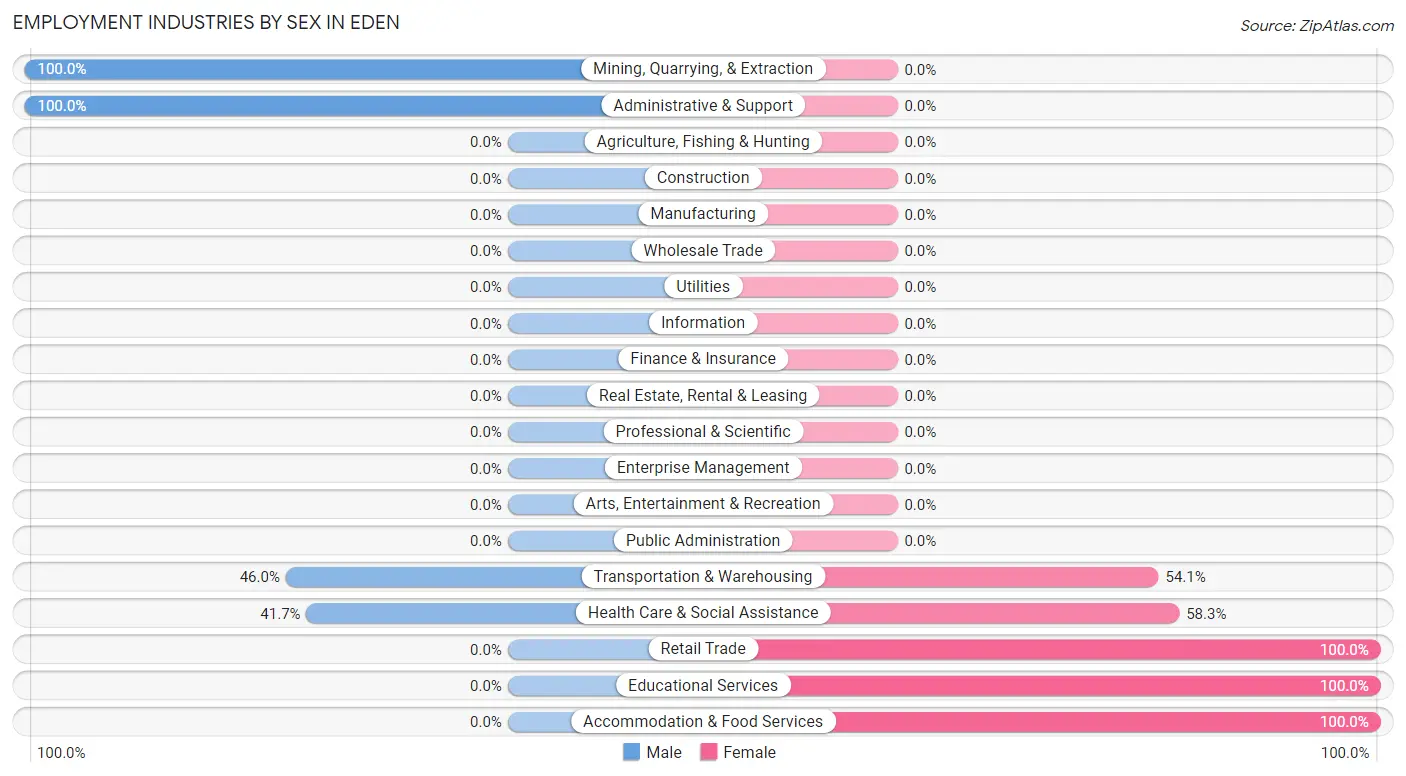
| Industry | Male | Female |
| Agriculture, Fishing & Hunting | 0 (0.0%) | 0 (0.0%) |
| Mining, Quarrying, & Extraction | 17 (100.0%) | 0 (0.0%) |
| Construction | 0 (0.0%) | 0 (0.0%) |
| Manufacturing | 0 (0.0%) | 0 (0.0%) |
| Wholesale Trade | 0 (0.0%) | 0 (0.0%) |
| Retail Trade | 0 (0.0%) | 24 (100.0%) |
| Transportation & Warehousing | 34 (46.0%) | 40 (54.0%) |
| Utilities | 0 (0.0%) | 0 (0.0%) |
| Information | 0 (0.0%) | 0 (0.0%) |
| Finance & Insurance | 0 (0.0%) | 0 (0.0%) |
| Real Estate, Rental & Leasing | 0 (0.0%) | 0 (0.0%) |
| Professional & Scientific | 0 (0.0%) | 0 (0.0%) |
| Enterprise Management | 0 (0.0%) | 0 (0.0%) |
| Administrative & Support | 10 (100.0%) | 0 (0.0%) |
| Educational Services | 0 (0.0%) | 9 (100.0%) |
| Health Care & Social Assistance | 5 (41.7%) | 7 (58.3%) |
| Arts, Entertainment & Recreation | 0 (0.0%) | 0 (0.0%) |
| Accommodation & Food Services | 0 (0.0%) | 10 (100.0%) |
| Public Administration | 0 (0.0%) | 0 (0.0%) |
| Total | 66 (42.3%) | 90 (57.7%) |
Education in Eden
School Enrollment in Eden
The most common levels of schooling among the 47 students in Eden are middle school (21 | 44.7%), elementary school (10 | 21.3%), and graduate / professional (9 | 19.2%).
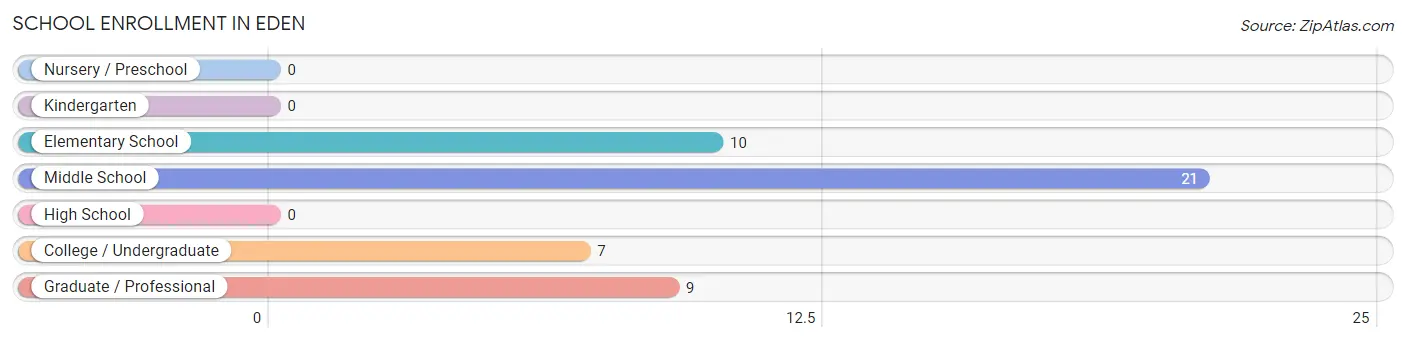
| School Level | # Students | % Students |
| Nursery / Preschool | 0 | 0.0% |
| Kindergarten | 0 | 0.0% |
| Elementary School | 10 | 21.3% |
| Middle School | 21 | 44.7% |
| High School | 0 | 0.0% |
| College / Undergraduate | 7 | 14.9% |
| Graduate / Professional | 9 | 19.2% |
| Total | 47 | 100.0% |
School Enrollment by Age by Funding Source in Eden
Out of a total of 47 students who are enrolled in schools in Eden, 22 (46.8%) attend a private institution, while the remaining 25 (53.2%) are enrolled in public schools. The age group of 5 to 9 year old has the highest likelihood of being enrolled in private schools, with 5 (100.0% in the age bracket) enrolled. Conversely, the age group of 35 years and over has the lowest likelihood of being enrolled in a private school, with 9 (100.0% in the age bracket) attending a public institution.
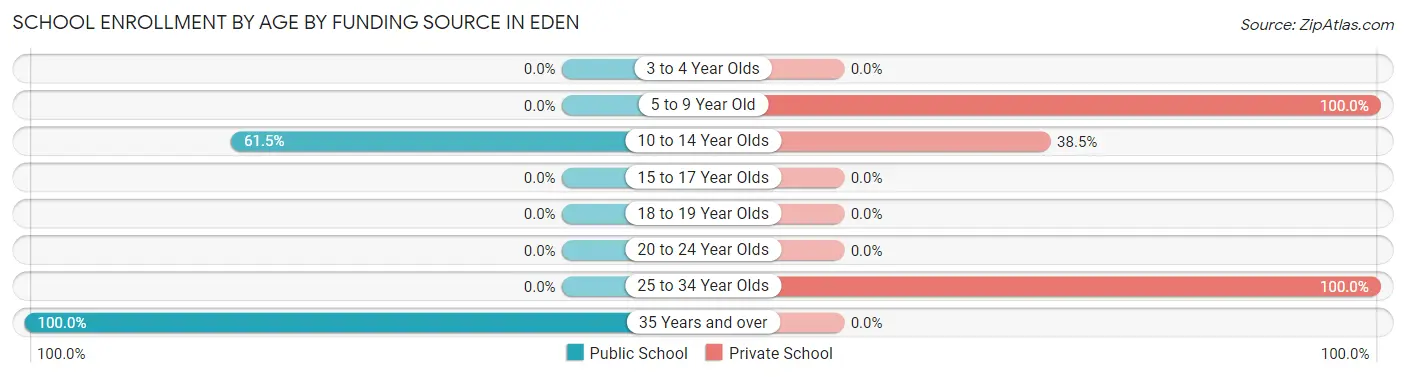
| Age Bracket | Public School | Private School |
| 3 to 4 Year Olds | 0 (0.0%) | 0 (0.0%) |
| 5 to 9 Year Old | 0 (0.0%) | 5 (100.0%) |
| 10 to 14 Year Olds | 16 (61.5%) | 10 (38.5%) |
| 15 to 17 Year Olds | 0 (0.0%) | 0 (0.0%) |
| 18 to 19 Year Olds | 0 (0.0%) | 0 (0.0%) |
| 20 to 24 Year Olds | 0 (0.0%) | 0 (0.0%) |
| 25 to 34 Year Olds | 0 (0.0%) | 7 (100.0%) |
| 35 Years and over | 9 (100.0%) | 0 (0.0%) |
| Total | 25 (53.2%) | 22 (46.8%) |
Educational Attainment by Field of Study in Eden
Literature & languages (10 | 29.4%), communications (10 | 29.4%), education (9 | 26.5%), and arts & humanities (5 | 14.7%) are the most common fields of study among 34 individuals in Eden who have obtained a bachelor's degree or higher.
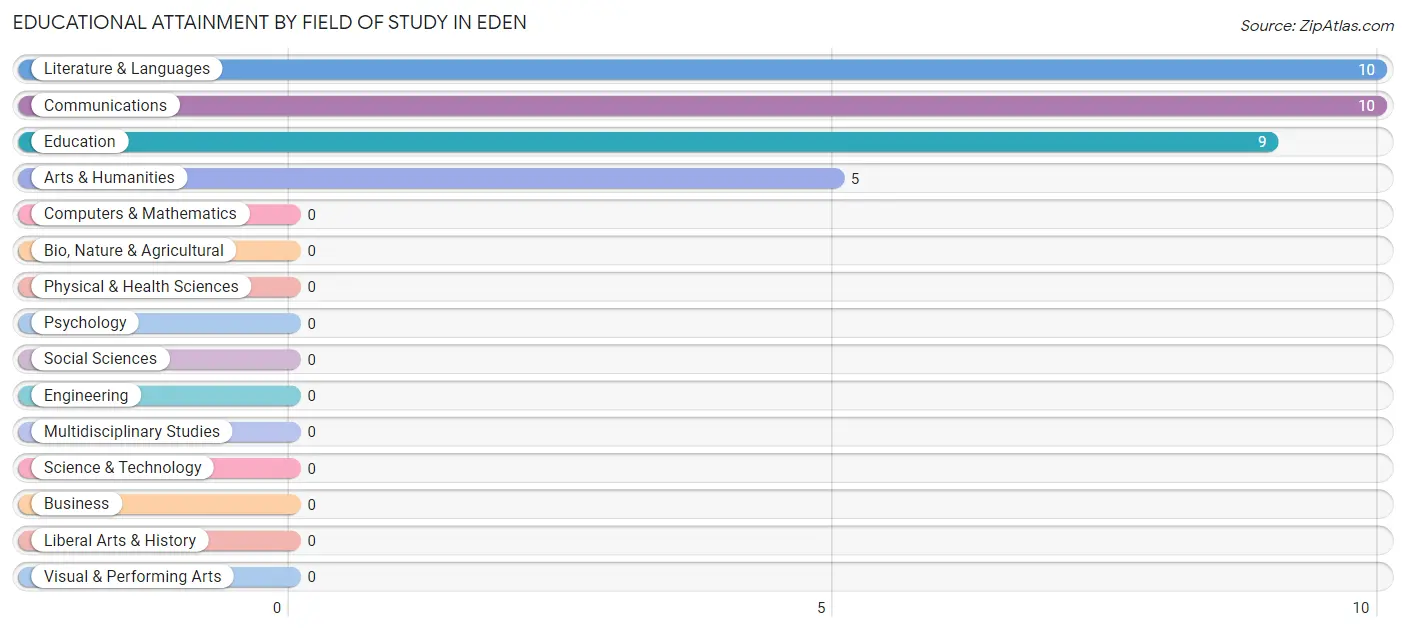
| Field of Study | # Graduates | % Graduates |
| Computers & Mathematics | 0 | 0.0% |
| Bio, Nature & Agricultural | 0 | 0.0% |
| Physical & Health Sciences | 0 | 0.0% |
| Psychology | 0 | 0.0% |
| Social Sciences | 0 | 0.0% |
| Engineering | 0 | 0.0% |
| Multidisciplinary Studies | 0 | 0.0% |
| Science & Technology | 0 | 0.0% |
| Business | 0 | 0.0% |
| Education | 9 | 26.5% |
| Literature & Languages | 10 | 29.4% |
| Liberal Arts & History | 0 | 0.0% |
| Visual & Performing Arts | 0 | 0.0% |
| Communications | 10 | 29.4% |
| Arts & Humanities | 5 | 14.7% |
| Total | 34 | 100.0% |
Transportation & Commute in Eden
Vehicle Availability by Sex in Eden
The most prevalent vehicle ownership categories in Eden are males with 1 vehicle (25, accounting for 37.9%) and females with 1 vehicle (64, making up 27.8%).
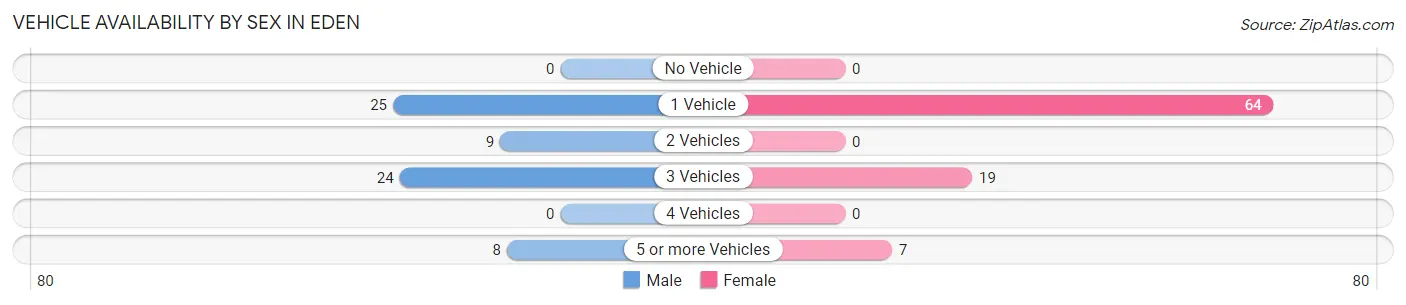
| Vehicles Available | Male | Female |
| No Vehicle | 0 (0.0%) | 0 (0.0%) |
| 1 Vehicle | 25 (37.9%) | 64 (71.1%) |
| 2 Vehicles | 9 (13.6%) | 0 (0.0%) |
| 3 Vehicles | 24 (36.4%) | 19 (21.1%) |
| 4 Vehicles | 0 (0.0%) | 0 (0.0%) |
| 5 or more Vehicles | 8 (12.1%) | 7 (7.8%) |
| Total | 66 (100.0%) | 90 (100.0%) |
Commute Time in Eden
The most frequently occuring commute durations in Eden are less than 5 minutes (64 commuters, 41.0%), 90 or more minutes (34 commuters, 21.8%), and 45 to 59 minutes (12 commuters, 7.7%).
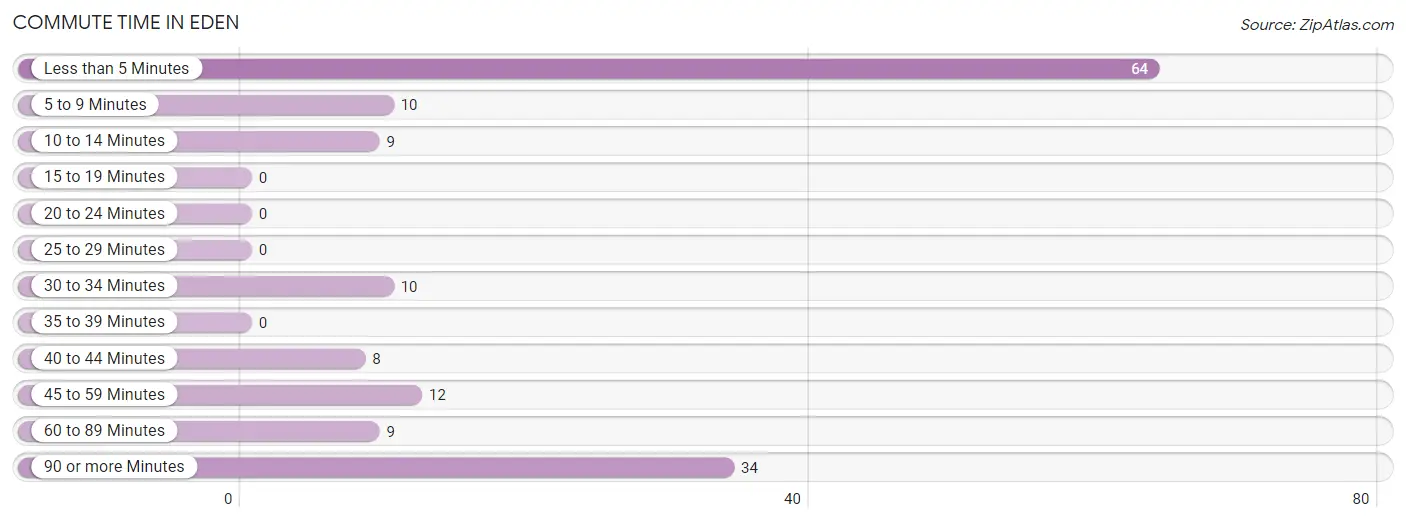
| Commute Time | # Commuters | % Commuters |
| Less than 5 Minutes | 64 | 41.0% |
| 5 to 9 Minutes | 10 | 6.4% |
| 10 to 14 Minutes | 9 | 5.8% |
| 15 to 19 Minutes | 0 | 0.0% |
| 20 to 24 Minutes | 0 | 0.0% |
| 25 to 29 Minutes | 0 | 0.0% |
| 30 to 34 Minutes | 10 | 6.4% |
| 35 to 39 Minutes | 0 | 0.0% |
| 40 to 44 Minutes | 8 | 5.1% |
| 45 to 59 Minutes | 12 | 7.7% |
| 60 to 89 Minutes | 9 | 5.8% |
| 90 or more Minutes | 34 | 21.8% |
Commute Time by Sex in Eden
The most common commute times in Eden are 90 or more minutes (34 commuters, 51.5%) for males and less than 5 minutes (64 commuters, 71.1%) for females.
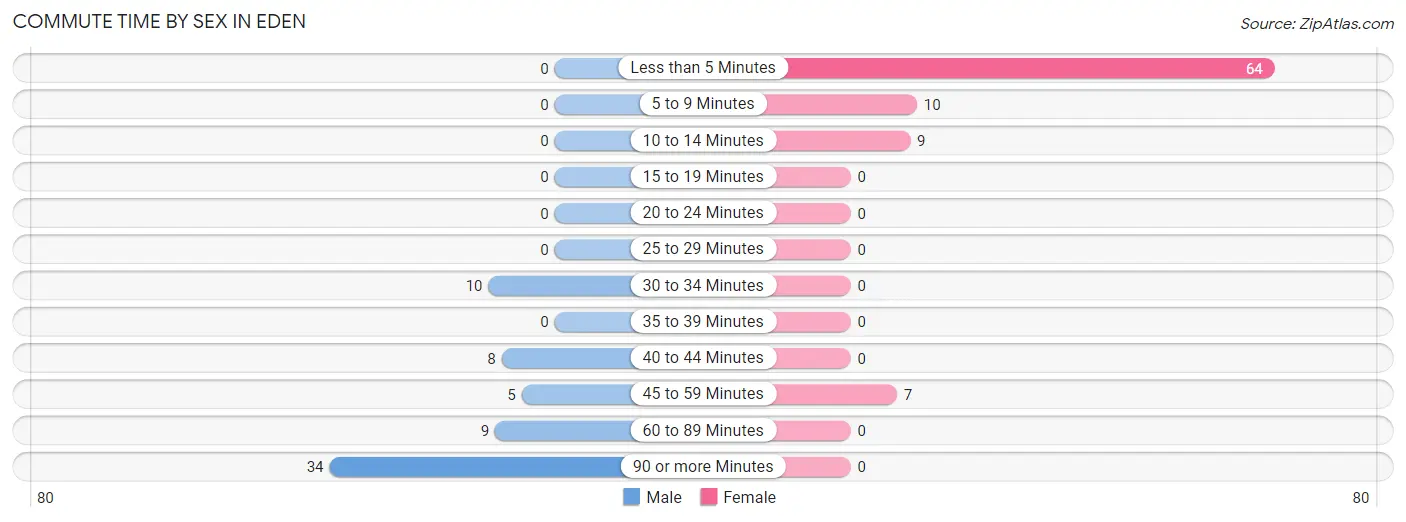
| Commute Time | Male | Female |
| Less than 5 Minutes | 0 (0.0%) | 64 (71.1%) |
| 5 to 9 Minutes | 0 (0.0%) | 10 (11.1%) |
| 10 to 14 Minutes | 0 (0.0%) | 9 (10.0%) |
| 15 to 19 Minutes | 0 (0.0%) | 0 (0.0%) |
| 20 to 24 Minutes | 0 (0.0%) | 0 (0.0%) |
| 25 to 29 Minutes | 0 (0.0%) | 0 (0.0%) |
| 30 to 34 Minutes | 10 (15.1%) | 0 (0.0%) |
| 35 to 39 Minutes | 0 (0.0%) | 0 (0.0%) |
| 40 to 44 Minutes | 8 (12.1%) | 0 (0.0%) |
| 45 to 59 Minutes | 5 (7.6%) | 7 (7.8%) |
| 60 to 89 Minutes | 9 (13.6%) | 0 (0.0%) |
| 90 or more Minutes | 34 (51.5%) | 0 (0.0%) |
Time of Departure to Work by Sex in Eden
The most frequent times of departure to work in Eden are 9:00 AM to 9:59 AM (25, 37.9%) for males and 5:00 AM to 5:29 AM (40, 44.4%) for females.
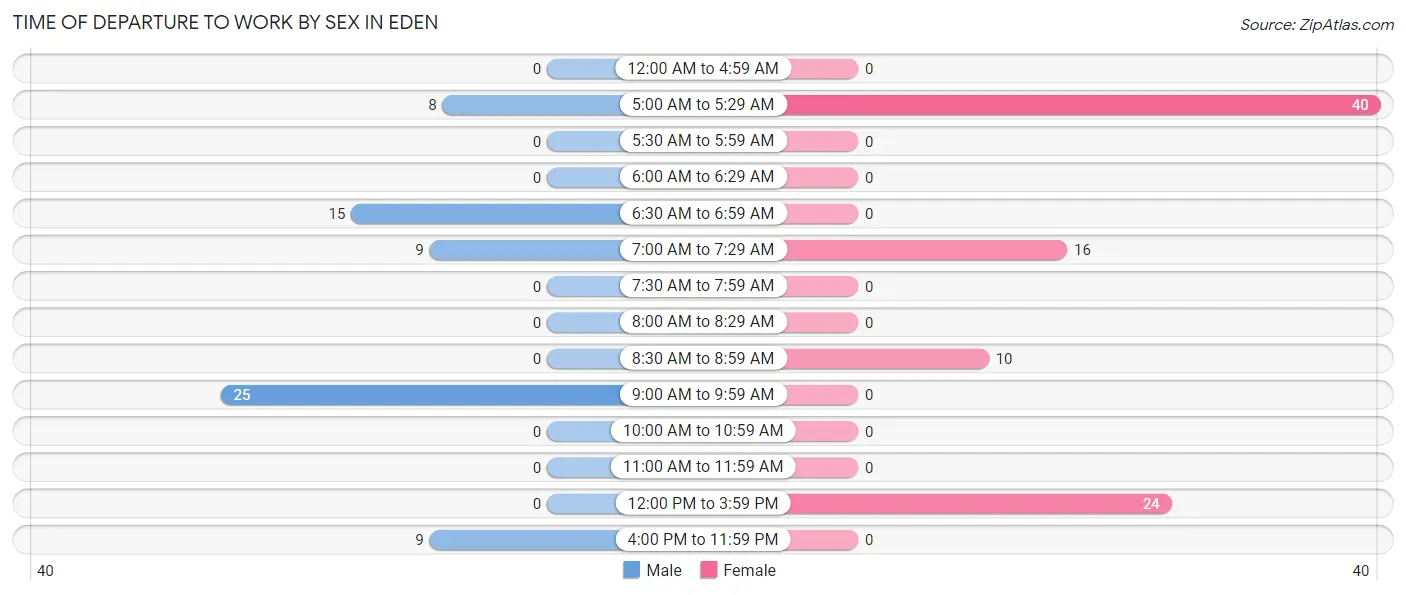
| Time of Departure | Male | Female |
| 12:00 AM to 4:59 AM | 0 (0.0%) | 0 (0.0%) |
| 5:00 AM to 5:29 AM | 8 (12.1%) | 40 (44.4%) |
| 5:30 AM to 5:59 AM | 0 (0.0%) | 0 (0.0%) |
| 6:00 AM to 6:29 AM | 0 (0.0%) | 0 (0.0%) |
| 6:30 AM to 6:59 AM | 15 (22.7%) | 0 (0.0%) |
| 7:00 AM to 7:29 AM | 9 (13.6%) | 16 (17.8%) |
| 7:30 AM to 7:59 AM | 0 (0.0%) | 0 (0.0%) |
| 8:00 AM to 8:29 AM | 0 (0.0%) | 0 (0.0%) |
| 8:30 AM to 8:59 AM | 0 (0.0%) | 10 (11.1%) |
| 9:00 AM to 9:59 AM | 25 (37.9%) | 0 (0.0%) |
| 10:00 AM to 10:59 AM | 0 (0.0%) | 0 (0.0%) |
| 11:00 AM to 11:59 AM | 0 (0.0%) | 0 (0.0%) |
| 12:00 PM to 3:59 PM | 0 (0.0%) | 24 (26.7%) |
| 4:00 PM to 11:59 PM | 9 (13.6%) | 0 (0.0%) |
| Total | 66 (100.0%) | 90 (100.0%) |
Housing Occupancy in Eden
Occupancy by Ownership in Eden
Of the total 123 dwellings in Eden, owner-occupied units account for 99 (80.5%), while renter-occupied units make up 24 (19.5%).
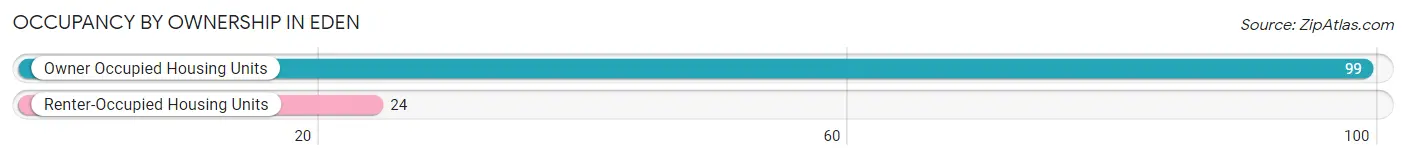
| Occupancy | # Housing Units | % Housing Units |
| Owner Occupied Housing Units | 99 | 80.5% |
| Renter-Occupied Housing Units | 24 | 19.5% |
| Total Occupied Housing Units | 123 | 100.0% |
Occupancy by Household Size in Eden
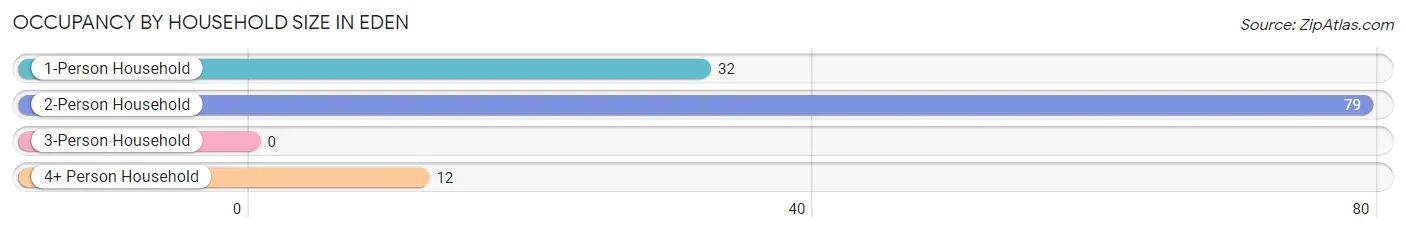
| Household Size | # Housing Units | % Housing Units |
| 1-Person Household | 32 | 26.0% |
| 2-Person Household | 79 | 64.2% |
| 3-Person Household | 0 | 0.0% |
| 4+ Person Household | 12 | 9.8% |
| Total Housing Units | 123 | 100.0% |
Occupancy by Ownership by Household Size in Eden
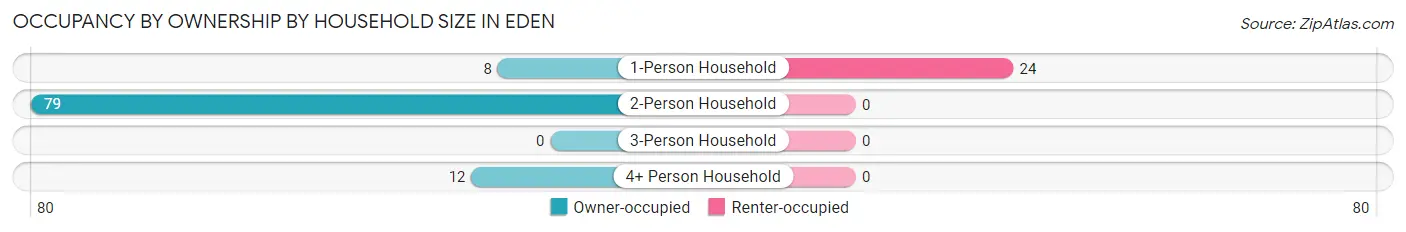
| Household Size | Owner-occupied | Renter-occupied |
| 1-Person Household | 8 (25.0%) | 24 (75.0%) |
| 2-Person Household | 79 (100.0%) | 0 (0.0%) |
| 3-Person Household | 0 (0.0%) | 0 (0.0%) |
| 4+ Person Household | 12 (100.0%) | 0 (0.0%) |
| Total Housing Units | 99 (80.5%) | 24 (19.5%) |
Occupancy by Educational Attainment in Eden
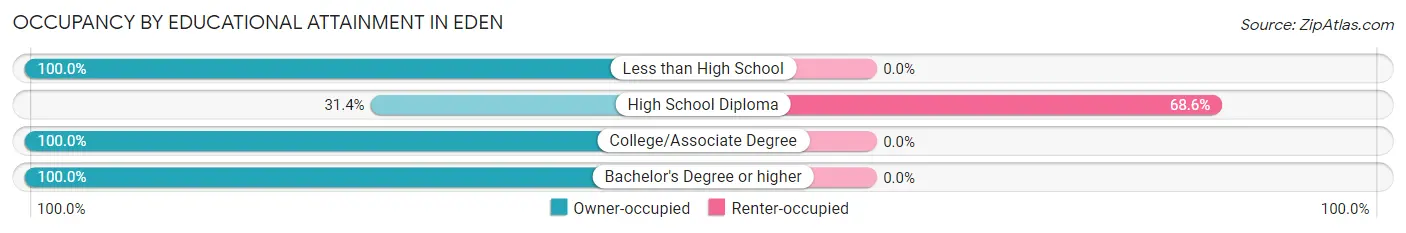
| Household Size | Owner-occupied | Renter-occupied |
| Less than High School | 17 (100.0%) | 0 (0.0%) |
| High School Diploma | 11 (31.4%) | 24 (68.6%) |
| College/Associate Degree | 56 (100.0%) | 0 (0.0%) |
| Bachelor's Degree or higher | 15 (100.0%) | 0 (0.0%) |
Occupancy by Age of Householder in Eden
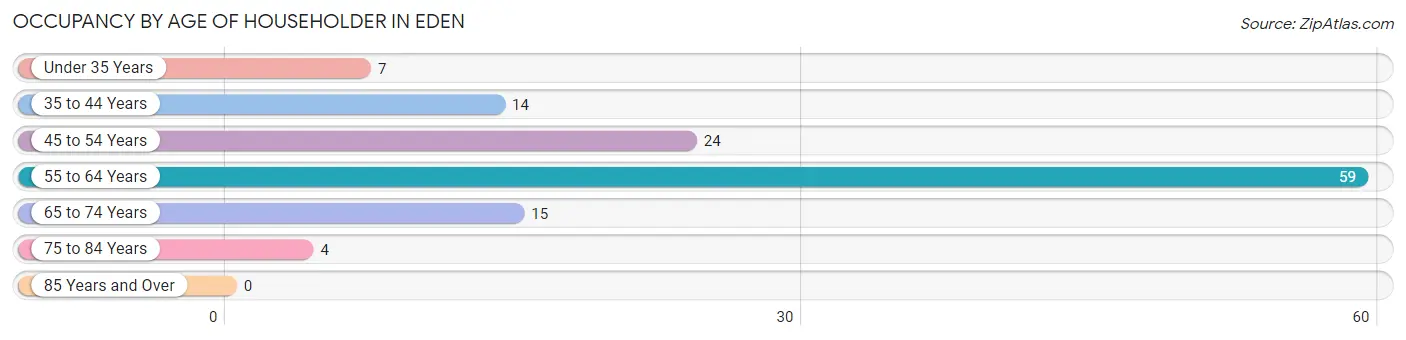
| Age Bracket | # Households | % Households |
| Under 35 Years | 7 | 5.7% |
| 35 to 44 Years | 14 | 11.4% |
| 45 to 54 Years | 24 | 19.5% |
| 55 to 64 Years | 59 | 48.0% |
| 65 to 74 Years | 15 | 12.2% |
| 75 to 84 Years | 4 | 3.3% |
| 85 Years and Over | 0 | 0.0% |
| Total | 123 | 100.0% |
Housing Finances in Eden
Median Income by Occupancy in Eden
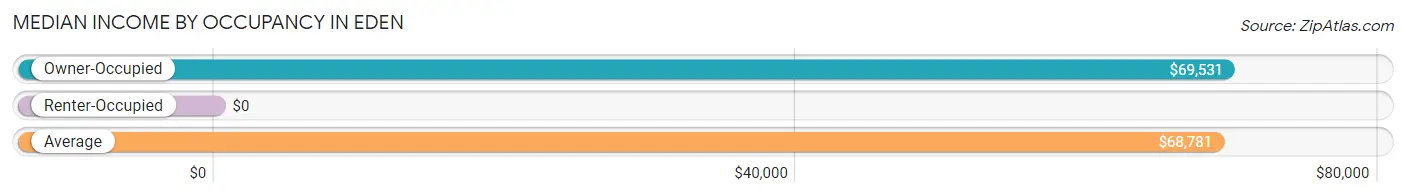
| Occupancy Type | # Households | Median Income |
| Owner-Occupied | 99 (80.5%) | $69,531 |
| Renter-Occupied | 24 (19.5%) | $0 |
| Average | 123 (100.0%) | $68,781 |
Occupancy by Householder Income Bracket in Eden
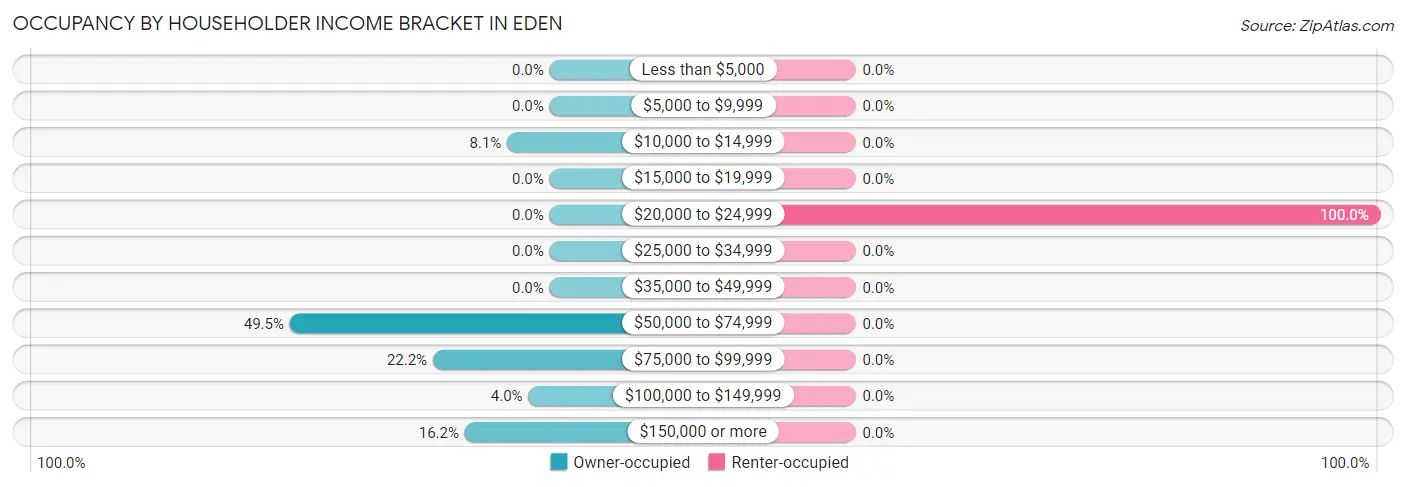
| Income Bracket | Owner-occupied | Renter-occupied |
| Less than $5,000 | 0 (0.0%) | 0 (0.0%) |
| $5,000 to $9,999 | 0 (0.0%) | 0 (0.0%) |
| $10,000 to $14,999 | 8 (8.1%) | 0 (0.0%) |
| $15,000 to $19,999 | 0 (0.0%) | 0 (0.0%) |
| $20,000 to $24,999 | 0 (0.0%) | 24 (100.0%) |
| $25,000 to $34,999 | 0 (0.0%) | 0 (0.0%) |
| $35,000 to $49,999 | 0 (0.0%) | 0 (0.0%) |
| $50,000 to $74,999 | 49 (49.5%) | 0 (0.0%) |
| $75,000 to $99,999 | 22 (22.2%) | 0 (0.0%) |
| $100,000 to $149,999 | 4 (4.0%) | 0 (0.0%) |
| $150,000 or more | 16 (16.2%) | 0 (0.0%) |
| Total | 99 (100.0%) | 24 (100.0%) |
Monthly Housing Cost Tiers in Eden
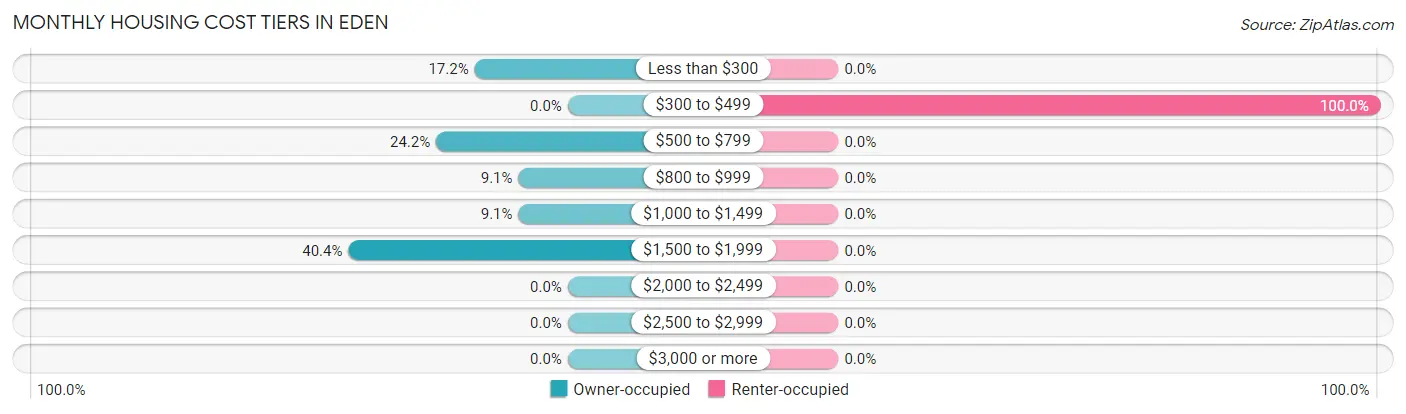
| Monthly Cost | Owner-occupied | Renter-occupied |
| Less than $300 | 17 (17.2%) | 0 (0.0%) |
| $300 to $499 | 0 (0.0%) | 24 (100.0%) |
| $500 to $799 | 24 (24.2%) | 0 (0.0%) |
| $800 to $999 | 9 (9.1%) | 0 (0.0%) |
| $1,000 to $1,499 | 9 (9.1%) | 0 (0.0%) |
| $1,500 to $1,999 | 40 (40.4%) | 0 (0.0%) |
| $2,000 to $2,499 | 0 (0.0%) | 0 (0.0%) |
| $2,500 to $2,999 | 0 (0.0%) | 0 (0.0%) |
| $3,000 or more | 0 (0.0%) | 0 (0.0%) |
| Total | 99 (100.0%) | 24 (100.0%) |
Physical Housing Characteristics in Eden
Housing Structures in Eden
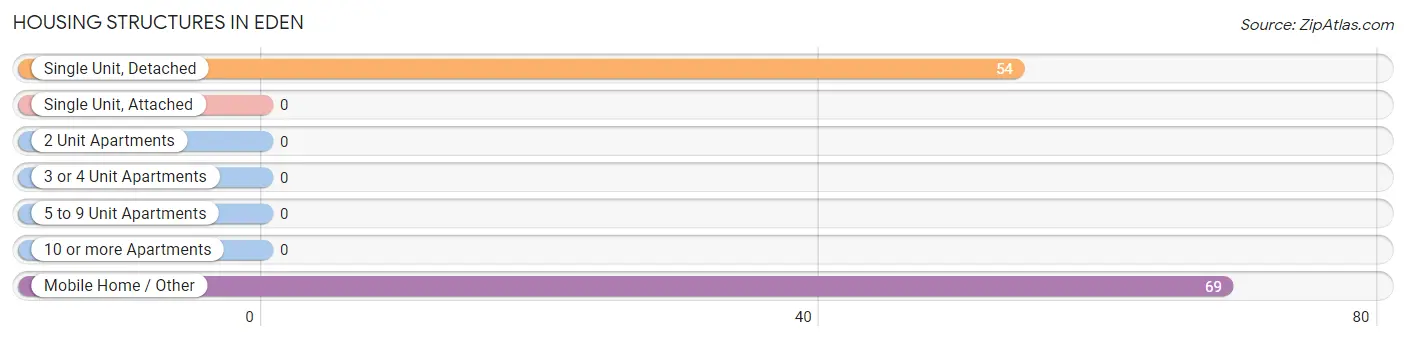
| Structure Type | # Housing Units | % Housing Units |
| Single Unit, Detached | 54 | 43.9% |
| Single Unit, Attached | 0 | 0.0% |
| 2 Unit Apartments | 0 | 0.0% |
| 3 or 4 Unit Apartments | 0 | 0.0% |
| 5 to 9 Unit Apartments | 0 | 0.0% |
| 10 or more Apartments | 0 | 0.0% |
| Mobile Home / Other | 69 | 56.1% |
| Total | 123 | 100.0% |
Housing Structures by Occupancy in Eden
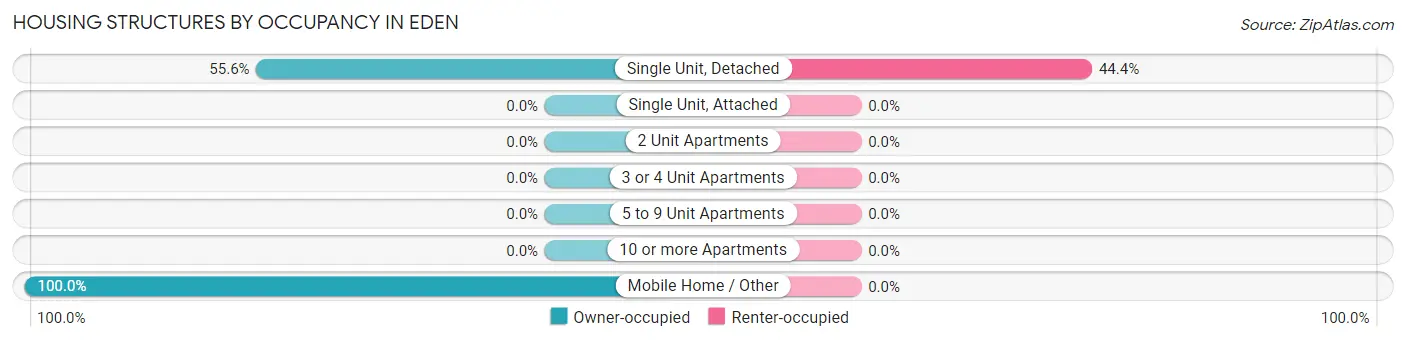
| Structure Type | Owner-occupied | Renter-occupied |
| Single Unit, Detached | 30 (55.6%) | 24 (44.4%) |
| Single Unit, Attached | 0 (0.0%) | 0 (0.0%) |
| 2 Unit Apartments | 0 (0.0%) | 0 (0.0%) |
| 3 or 4 Unit Apartments | 0 (0.0%) | 0 (0.0%) |
| 5 to 9 Unit Apartments | 0 (0.0%) | 0 (0.0%) |
| 10 or more Apartments | 0 (0.0%) | 0 (0.0%) |
| Mobile Home / Other | 69 (100.0%) | 0 (0.0%) |
| Total | 99 (80.5%) | 24 (19.5%) |
Housing Structures by Number of Rooms in Eden
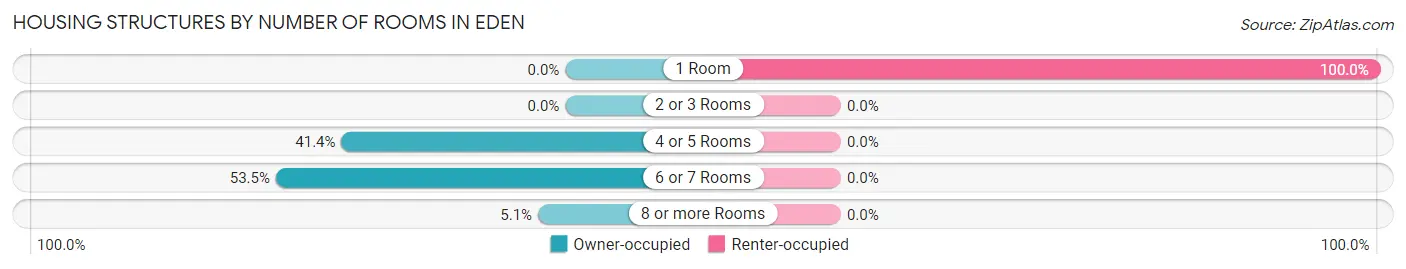
| Number of Rooms | Owner-occupied | Renter-occupied |
| 1 Room | 0 (0.0%) | 24 (100.0%) |
| 2 or 3 Rooms | 0 (0.0%) | 0 (0.0%) |
| 4 or 5 Rooms | 41 (41.4%) | 0 (0.0%) |
| 6 or 7 Rooms | 53 (53.5%) | 0 (0.0%) |
| 8 or more Rooms | 5 (5.1%) | 0 (0.0%) |
| Total | 99 (100.0%) | 24 (100.0%) |
Housing Structure by Heating Type in Eden
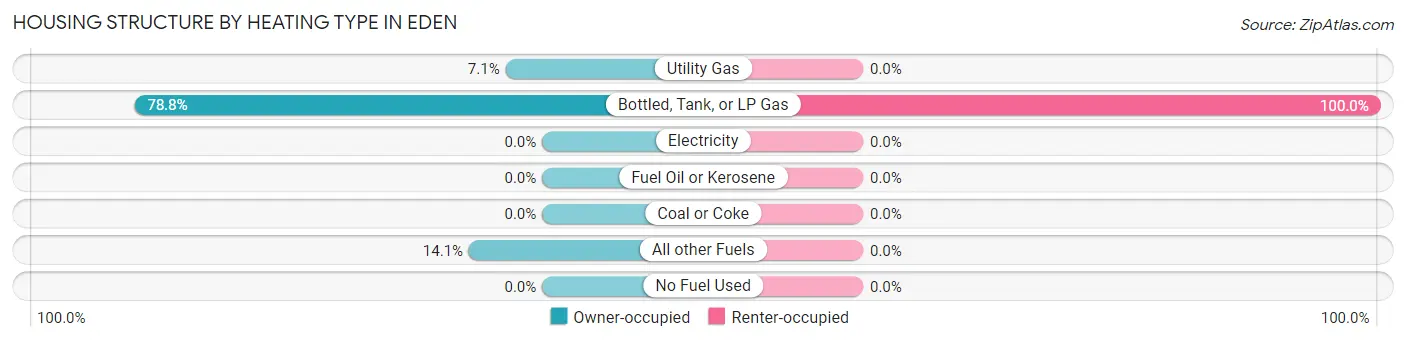
| Heating Type | Owner-occupied | Renter-occupied |
| Utility Gas | 7 (7.1%) | 0 (0.0%) |
| Bottled, Tank, or LP Gas | 78 (78.8%) | 24 (100.0%) |
| Electricity | 0 (0.0%) | 0 (0.0%) |
| Fuel Oil or Kerosene | 0 (0.0%) | 0 (0.0%) |
| Coal or Coke | 0 (0.0%) | 0 (0.0%) |
| All other Fuels | 14 (14.1%) | 0 (0.0%) |
| No Fuel Used | 0 (0.0%) | 0 (0.0%) |
| Total | 99 (100.0%) | 24 (100.0%) |
Household Vehicle Usage in Eden
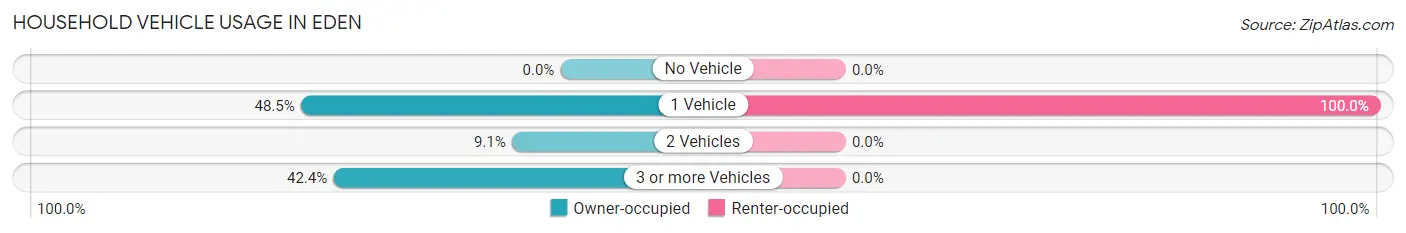
| Vehicles per Household | Owner-occupied | Renter-occupied |
| No Vehicle | 0 (0.0%) | 0 (0.0%) |
| 1 Vehicle | 48 (48.5%) | 24 (100.0%) |
| 2 Vehicles | 9 (9.1%) | 0 (0.0%) |
| 3 or more Vehicles | 42 (42.4%) | 0 (0.0%) |
| Total | 99 (100.0%) | 24 (100.0%) |
Real Estate & Mortgages in Eden
Real Estate and Mortgage Overview in Eden
| Characteristic | Without Mortgage | With Mortgage |
| Housing Units | 54 | 45 |
| Median Property Value | $71,000 | $0 |
| Median Household Income | $90,000 | $0 |
| Monthly Housing Costs | $630 | $0 |
| Real Estate Taxes | $1,893 | $0 |
Property Value by Mortgage Status in Eden
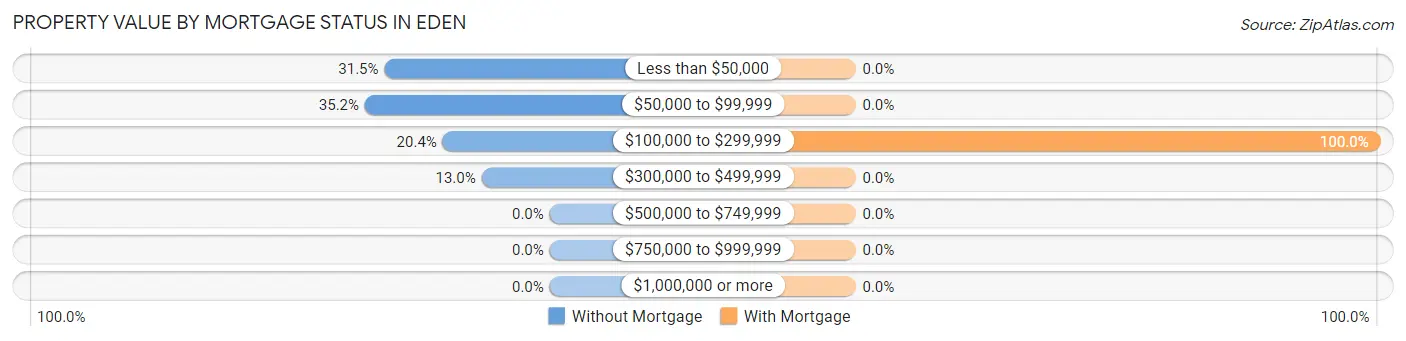
| Property Value | Without Mortgage | With Mortgage |
| Less than $50,000 | 17 (31.5%) | 0 (0.0%) |
| $50,000 to $99,999 | 19 (35.2%) | 0 (0.0%) |
| $100,000 to $299,999 | 11 (20.4%) | 45 (100.0%) |
| $300,000 to $499,999 | 7 (13.0%) | 0 (0.0%) |
| $500,000 to $749,999 | 0 (0.0%) | 0 (0.0%) |
| $750,000 to $999,999 | 0 (0.0%) | 0 (0.0%) |
| $1,000,000 or more | 0 (0.0%) | 0 (0.0%) |
| Total | 54 (100.0%) | 45 (100.0%) |
Household Income by Mortgage Status in Eden
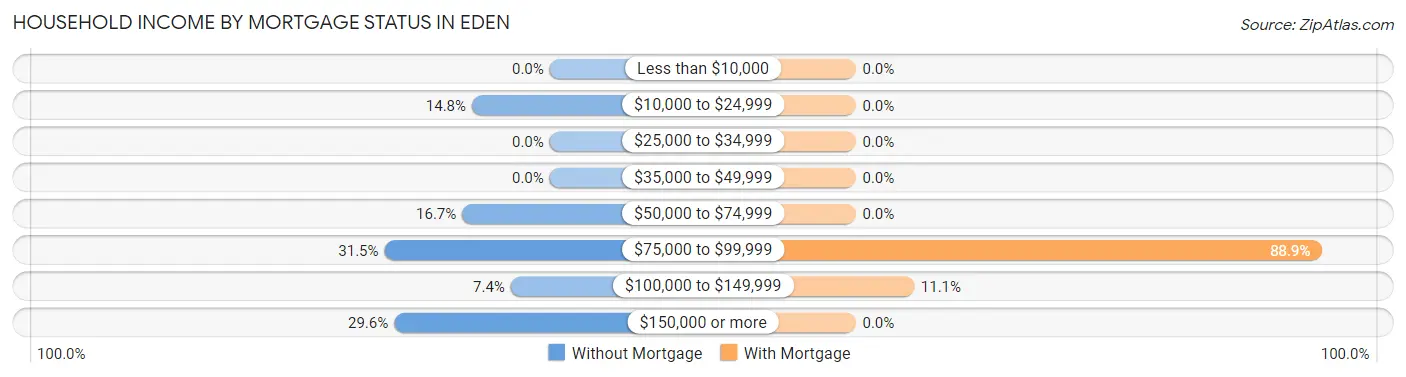
| Household Income | Without Mortgage | With Mortgage |
| Less than $10,000 | 0 (0.0%) | 0 (0.0%) |
| $10,000 to $24,999 | 8 (14.8%) | 0 (0.0%) |
| $25,000 to $34,999 | 0 (0.0%) | 0 (0.0%) |
| $35,000 to $49,999 | 0 (0.0%) | 0 (0.0%) |
| $50,000 to $74,999 | 9 (16.7%) | 0 (0.0%) |
| $75,000 to $99,999 | 17 (31.5%) | 40 (88.9%) |
| $100,000 to $149,999 | 4 (7.4%) | 5 (11.1%) |
| $150,000 or more | 16 (29.6%) | 0 (0.0%) |
| Total | 54 (100.0%) | 45 (100.0%) |
Property Value to Household Income Ratio in Eden
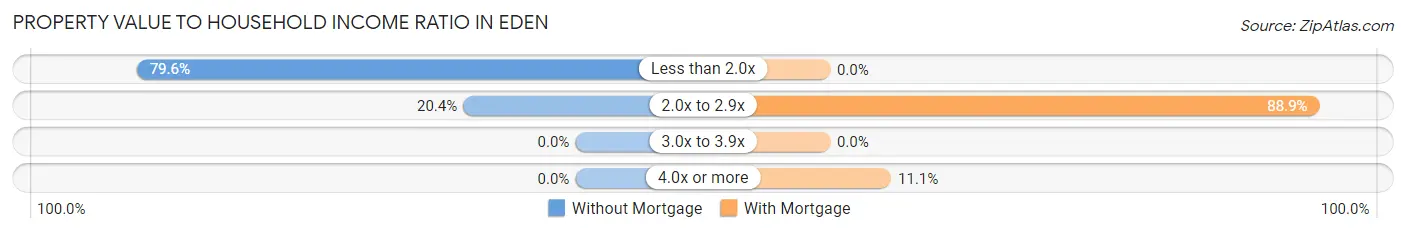
| Value-to-Income Ratio | Without Mortgage | With Mortgage |
| Less than 2.0x | 43 (79.6%) | 0 (0.0%) |
| 2.0x to 2.9x | 11 (20.4%) | 40 (88.9%) |
| 3.0x to 3.9x | 0 (0.0%) | 0 (0.0%) |
| 4.0x or more | 0 (0.0%) | 5 (11.1%) |
| Total | 54 (100.0%) | 45 (100.0%) |
Real Estate Taxes by Mortgage Status in Eden
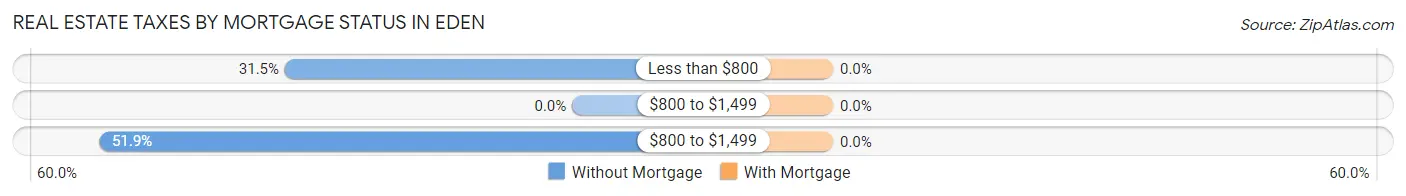
| Property Taxes | Without Mortgage | With Mortgage |
| Less than $800 | 17 (31.5%) | 0 (0.0%) |
| $800 to $1,499 | 0 (0.0%) | 0 (0.0%) |
| $800 to $1,499 | 28 (51.8%) | 0 (0.0%) |
| Total | 54 (100.0%) | 45 (100.0%) |
Health & Disability in Eden
Health Insurance Coverage by Age in Eden
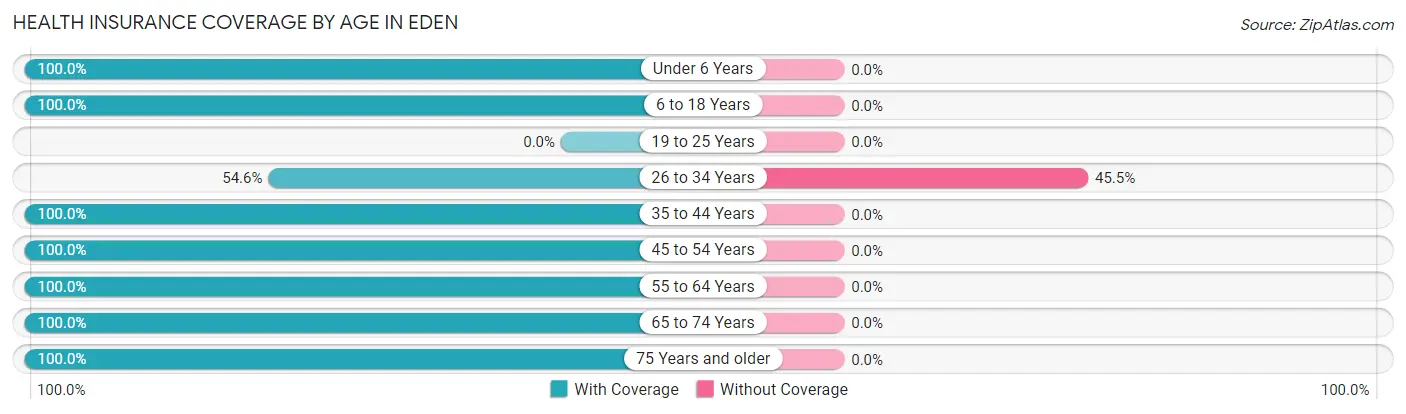
| Age Bracket | With Coverage | Without Coverage |
| Under 6 Years | 5 (100.0%) | 0 (0.0%) |
| 6 to 18 Years | 31 (100.0%) | 0 (0.0%) |
| 19 to 25 Years | 0 (0.0%) | 0 (0.0%) |
| 26 to 34 Years | 12 (54.5%) | 10 (45.5%) |
| 35 to 44 Years | 32 (100.0%) | 0 (0.0%) |
| 45 to 54 Years | 58 (100.0%) | 0 (0.0%) |
| 55 to 64 Years | 59 (100.0%) | 0 (0.0%) |
| 65 to 74 Years | 21 (100.0%) | 0 (0.0%) |
| 75 Years and older | 8 (100.0%) | 0 (0.0%) |
| Total | 226 (95.8%) | 10 (4.2%) |
Health Insurance Coverage by Citizenship Status in Eden
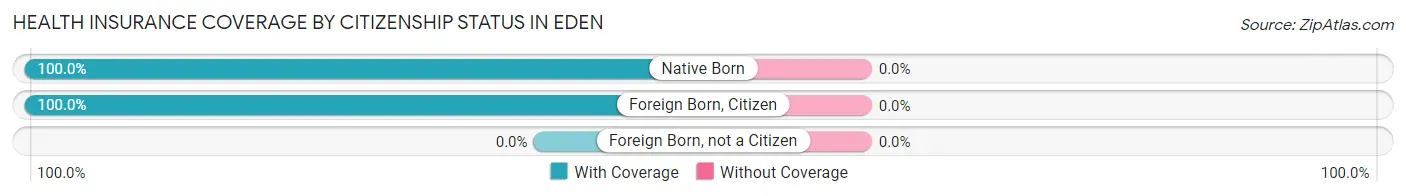
| Citizenship Status | With Coverage | Without Coverage |
| Native Born | 5 (100.0%) | 0 (0.0%) |
| Foreign Born, Citizen | 31 (100.0%) | 0 (0.0%) |
| Foreign Born, not a Citizen | 0 (0.0%) | 0 (0.0%) |
Health Insurance Coverage by Household Income in Eden
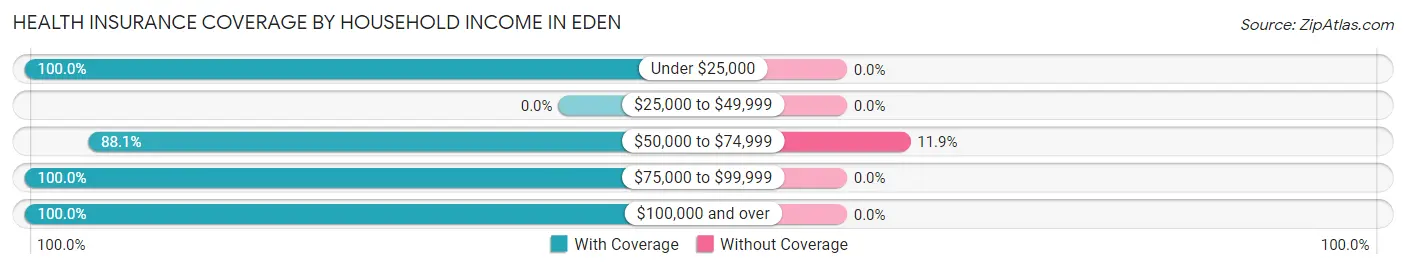
| Household Income | With Coverage | Without Coverage |
| Under $25,000 | 32 (100.0%) | 0 (0.0%) |
| $25,000 to $49,999 | 0 (0.0%) | 0 (0.0%) |
| $50,000 to $74,999 | 74 (88.1%) | 10 (11.9%) |
| $75,000 to $99,999 | 62 (100.0%) | 0 (0.0%) |
| $100,000 and over | 58 (100.0%) | 0 (0.0%) |
Public vs Private Health Insurance Coverage by Age in Eden
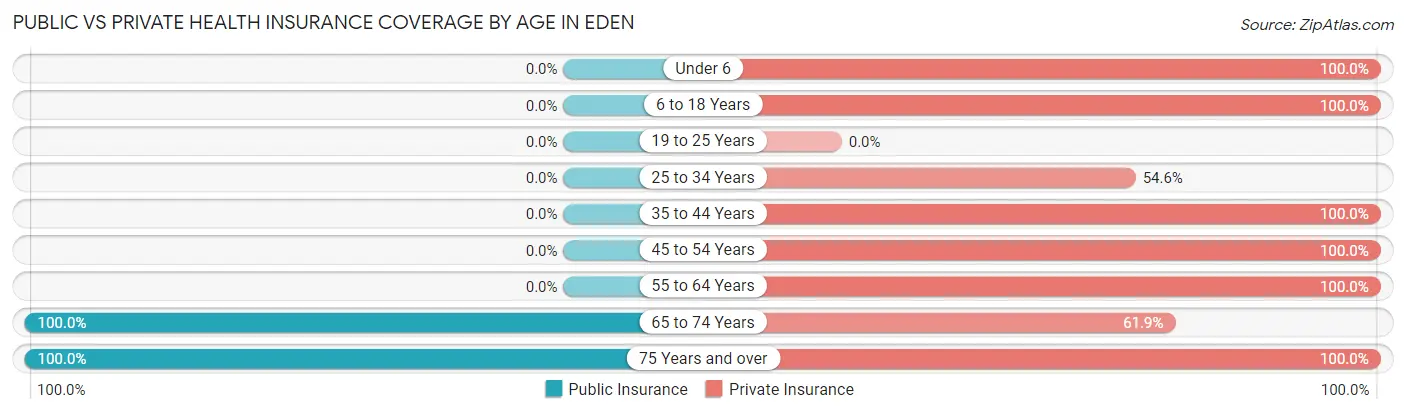
| Age Bracket | Public Insurance | Private Insurance |
| Under 6 | 0 (0.0%) | 5 (100.0%) |
| 6 to 18 Years | 0 (0.0%) | 31 (100.0%) |
| 19 to 25 Years | 0 (0.0%) | 0 (0.0%) |
| 25 to 34 Years | 0 (0.0%) | 12 (54.5%) |
| 35 to 44 Years | 0 (0.0%) | 32 (100.0%) |
| 45 to 54 Years | 0 (0.0%) | 58 (100.0%) |
| 55 to 64 Years | 0 (0.0%) | 59 (100.0%) |
| 65 to 74 Years | 21 (100.0%) | 13 (61.9%) |
| 75 Years and over | 8 (100.0%) | 8 (100.0%) |
| Total | 29 (12.3%) | 218 (92.4%) |
Disability Status by Sex by Age in Eden
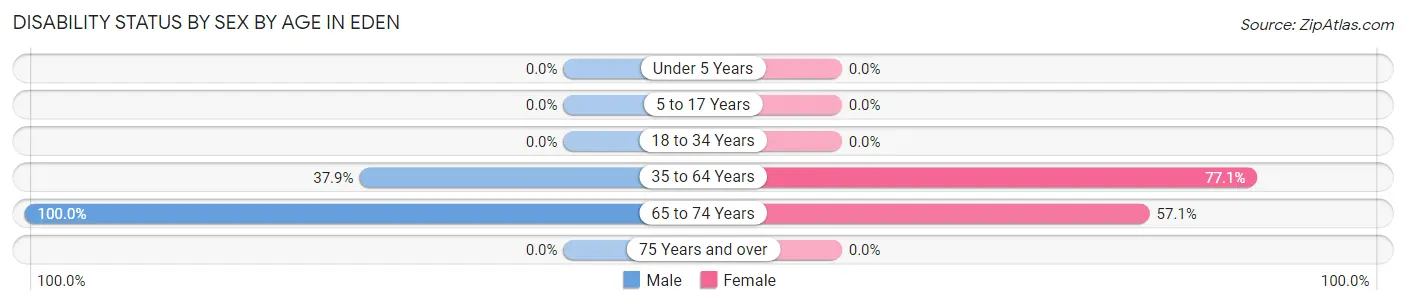
| Age Bracket | Male | Female |
| Under 5 Years | 0 (0.0%) | 0 (0.0%) |
| 5 to 17 Years | 0 (0.0%) | 0 (0.0%) |
| 18 to 34 Years | 0 (0.0%) | 0 (0.0%) |
| 35 to 64 Years | 25 (37.9%) | 64 (77.1%) |
| 65 to 74 Years | 7 (100.0%) | 8 (57.1%) |
| 75 Years and over | 0 (0.0%) | 0 (0.0%) |
Disability Class by Sex by Age in Eden
Disability Class: Hearing Difficulty
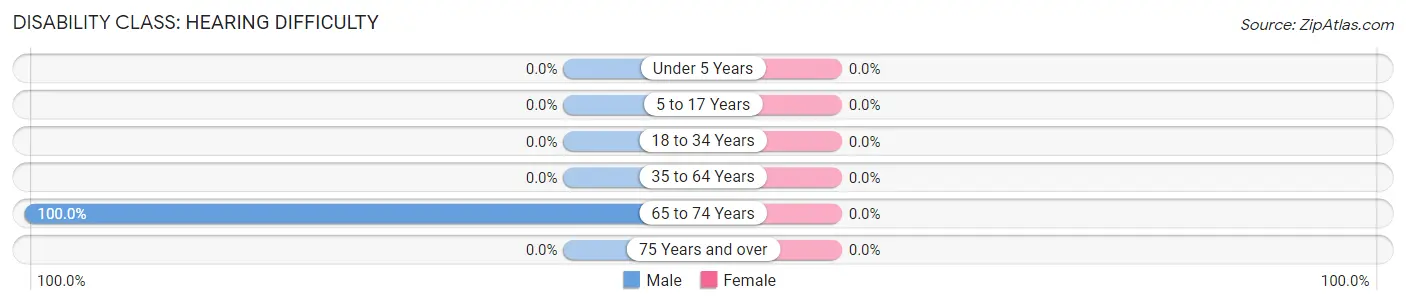
| Age Bracket | Male | Female |
| Under 5 Years | 0 (0.0%) | 0 (0.0%) |
| 5 to 17 Years | 0 (0.0%) | 0 (0.0%) |
| 18 to 34 Years | 0 (0.0%) | 0 (0.0%) |
| 35 to 64 Years | 0 (0.0%) | 0 (0.0%) |
| 65 to 74 Years | 7 (100.0%) | 0 (0.0%) |
| 75 Years and over | 0 (0.0%) | 0 (0.0%) |
Disability Class: Vision Difficulty
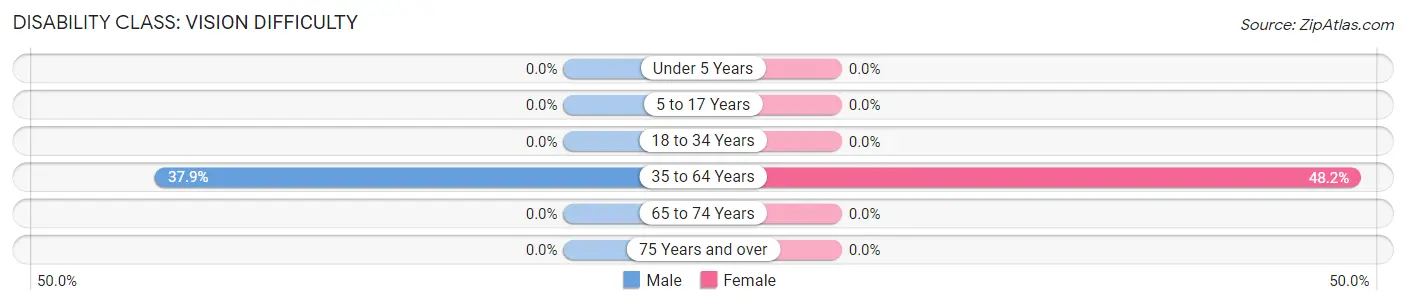
| Age Bracket | Male | Female |
| Under 5 Years | 0 (0.0%) | 0 (0.0%) |
| 5 to 17 Years | 0 (0.0%) | 0 (0.0%) |
| 18 to 34 Years | 0 (0.0%) | 0 (0.0%) |
| 35 to 64 Years | 25 (37.9%) | 40 (48.2%) |
| 65 to 74 Years | 0 (0.0%) | 0 (0.0%) |
| 75 Years and over | 0 (0.0%) | 0 (0.0%) |
Disability Class: Cognitive Difficulty
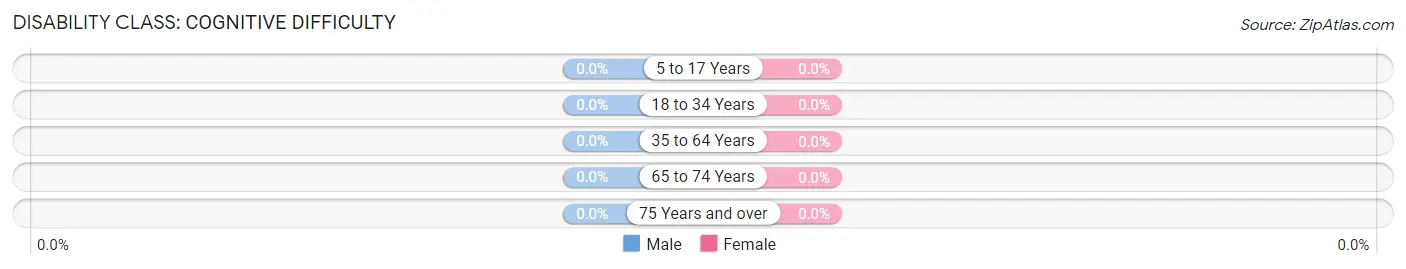
| Age Bracket | Male | Female |
| 5 to 17 Years | 0 (0.0%) | 0 (0.0%) |
| 18 to 34 Years | 0 (0.0%) | 0 (0.0%) |
| 35 to 64 Years | 0 (0.0%) | 0 (0.0%) |
| 65 to 74 Years | 0 (0.0%) | 0 (0.0%) |
| 75 Years and over | 0 (0.0%) | 0 (0.0%) |
Disability Class: Ambulatory Difficulty
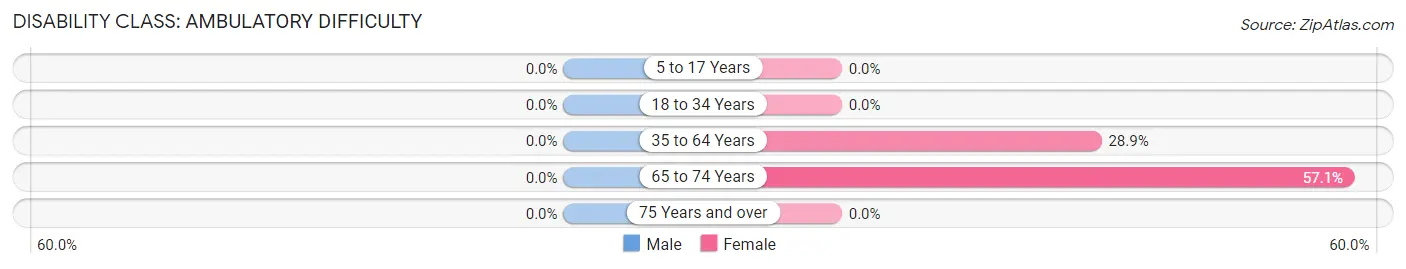
| Age Bracket | Male | Female |
| 5 to 17 Years | 0 (0.0%) | 0 (0.0%) |
| 18 to 34 Years | 0 (0.0%) | 0 (0.0%) |
| 35 to 64 Years | 0 (0.0%) | 24 (28.9%) |
| 65 to 74 Years | 0 (0.0%) | 8 (57.1%) |
| 75 Years and over | 0 (0.0%) | 0 (0.0%) |
Disability Class: Self-Care Difficulty
| Age Bracket | Male | Female |
| 5 to 17 Years | 0 (0.0%) | 0 (0.0%) |
| 18 to 34 Years | 0 (0.0%) | 0 (0.0%) |
| 35 to 64 Years | 0 (0.0%) | 0 (0.0%) |
| 65 to 74 Years | 0 (0.0%) | 0 (0.0%) |
| 75 Years and over | 0 (0.0%) | 0 (0.0%) |
Technology Access in Eden
Computing Device Access in Eden
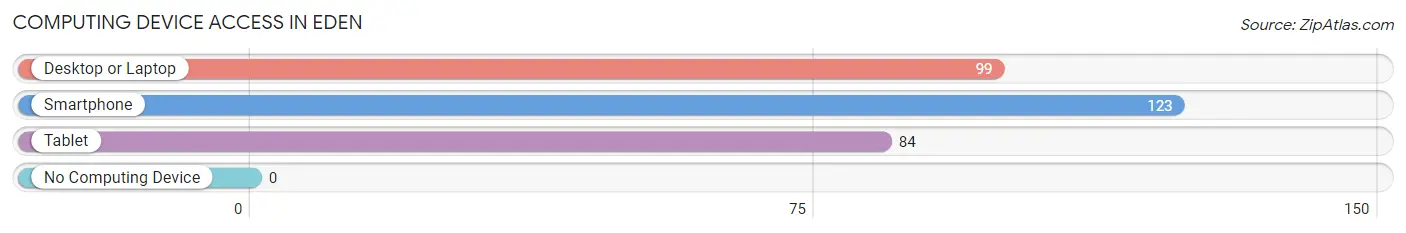
| Device Type | # Households | % Households |
| Desktop or Laptop | 99 | 80.5% |
| Smartphone | 123 | 100.0% |
| Tablet | 84 | 68.3% |
| No Computing Device | 0 | 0.0% |
| Total | 123 | 100.0% |
Internet Access in Eden
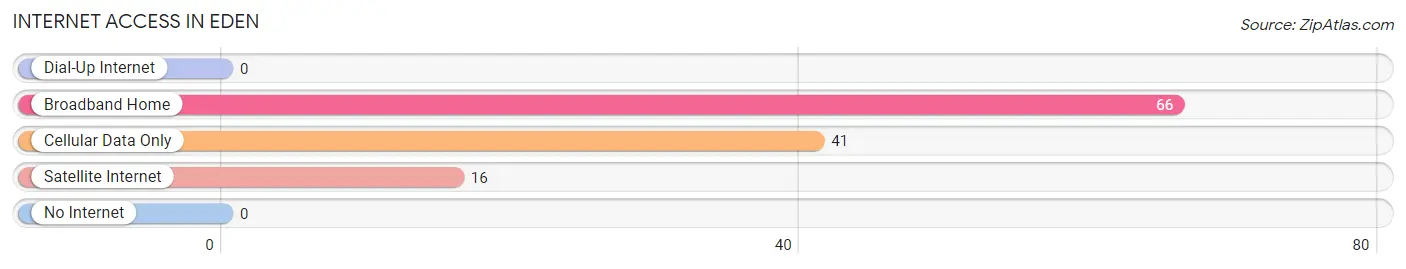
| Internet Type | # Households | % Households |
| Dial-Up Internet | 0 | 0.0% |
| Broadband Home | 66 | 53.7% |
| Cellular Data Only | 41 | 33.3% |
| Satellite Internet | 16 | 13.0% |
| No Internet | 0 | 0.0% |
| Total | 123 | 100.0% |
Eden Summary
Eden, Wyoming is a small town located in the western part of the state, near the Utah border. It is situated in the foothills of the Uinta Mountains, and is part of the Uinta-Wasatch-Cache National Forest. The town was founded in 1879 by Mormon settlers, and is named after the Garden of Eden in the Bible. The population of Eden was estimated to be around 200 people in 2020.
Geography
Eden is located in the western part of Wyoming, near the Utah border. It is situated in the foothills of the Uinta Mountains, and is part of the Uinta-Wasatch-Cache National Forest. The town is located at an elevation of 6,000 feet, and is surrounded by mountains and forests. The climate in Eden is semi-arid, with hot summers and cold winters.
Economy
Eden’s economy is largely based on tourism and recreation. The town is a popular destination for outdoor activities such as camping, fishing, hunting, and hiking. The nearby Uinta-Wasatch-Cache National Forest provides a variety of recreational opportunities, including skiing, snowmobiling, and mountain biking. The town also has a few small businesses, including a general store, a gas station, and a restaurant.
Demographics
The population of Eden was estimated to be around 200 people in 2020. The town is predominantly white, with a small Hispanic population. The median household income in Eden is around $50,000, and the median home value is around $200,000. The town has a low unemployment rate, and most of the residents are employed in the tourism and recreation industry.
Conclusion
Eden, Wyoming is a small town located in the western part of the state, near the Utah border. It is situated in the foothills of the Uinta Mountains, and is part of the Uinta-Wasatch-Cache National Forest. The town was founded in 1879 by Mormon settlers, and is named after the Garden of Eden in the Bible. The population of Eden was estimated to be around 200 people in 2020. The town’s economy is largely based on tourism and recreation, and the town is a popular destination for outdoor activities such as camping, fishing, hunting, and hiking. The town is predominantly white, with a small Hispanic population. The median household income in Eden is around $50,000, and the median home value is around $200,000.
Common Questions
What is Per Capita Income in Eden?
Per Capita income in Eden is $36,969.
What is the Median Family Income in Eden?
Median Family Income in Eden is $82,667.
What is the Median Household income in Eden?
Median Household Income in Eden is $68,781.
What is Income or Wage Gap in Eden?
Income or Wage Gap in Eden is 73.2%.
Women in Eden earn 26.8 cents for every dollar earned by a man.
What is Inequality or Gini Index in Eden?
Inequality or Gini Index in Eden is 0.36.
What is the Total Population of Eden?
Total Population of Eden is 236.
What is the Total Male Population of Eden?
Total Male Population of Eden is 101.
What is the Total Female Population of Eden?
Total Female Population of Eden is 135.
What is the Ratio of Males per 100 Females in Eden?
There are 74.81 Males per 100 Females in Eden.
What is the Ratio of Females per 100 Males in Eden?
There are 133.66 Females per 100 Males in Eden.
What is the Median Population Age in Eden?
Median Population Age in Eden is 54.1 Years.
What is the Average Family Size in Eden
Average Family Size in Eden is 2.3 People.
What is the Average Household Size in Eden
Average Household Size in Eden is 1.9 People.
How Large is the Labor Force in Eden?
There are 156 People in the Labor Forcein in Eden.
What is the Percentage of People in the Labor Force in Eden?
78.0% of People are in the Labor Force in Eden.