Osmond, WY Map & Demographics
Osmond Map
Osmond Overview
$29,602
PER CAPITA INCOME
$123,519
AVG FAMILY INCOME
$123,086
AVG HOUSEHOLD INCOME
0.28
INEQUALITY / GINI INDEX
826
TOTAL POPULATION
416
MALE POPULATION
410
FEMALE POPULATION
101.46
MALES / 100 FEMALES
98.56
FEMALES / 100 MALES
26.3
MEDIAN AGE
4.3
AVG FAMILY SIZE
3.9
AVG HOUSEHOLD SIZE
377
LABOR FORCE [ PEOPLE ]
81.3%
PERCENT IN LABOR FORCE
Income in Osmond
Income Overview in Osmond
Per Capita Income in Osmond is $29,602, while median incomes of families and households are $123,519 and $123,086 respectively.
| Characteristic | Number | Measure |
| Per Capita Income | 826 | $29,602 |
| Median Family Income | 186 | $123,519 |
| Mean Family Income | 186 | $125,553 |
| Median Household Income | 214 | $123,086 |
| Mean Household Income | 214 | $115,352 |
| Income Deficit | 186 | $0 |
| Wage / Income Gap (%) | 826 | 0.00% |
| Wage / Income Gap ($) | 826 | 100.00¢ per $1 |
| Gini / Inequality Index | 826 | 0.28 |
Earnings by Sex in Osmond
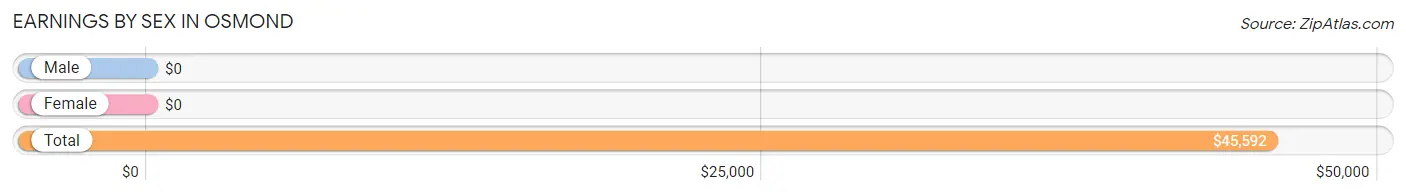
| Sex | Number | Average Earnings |
| Male | 307 (76.2%) | $0 |
| Female | 96 (23.8%) | $0 |
| Total | 403 (100.0%) | $45,592 |
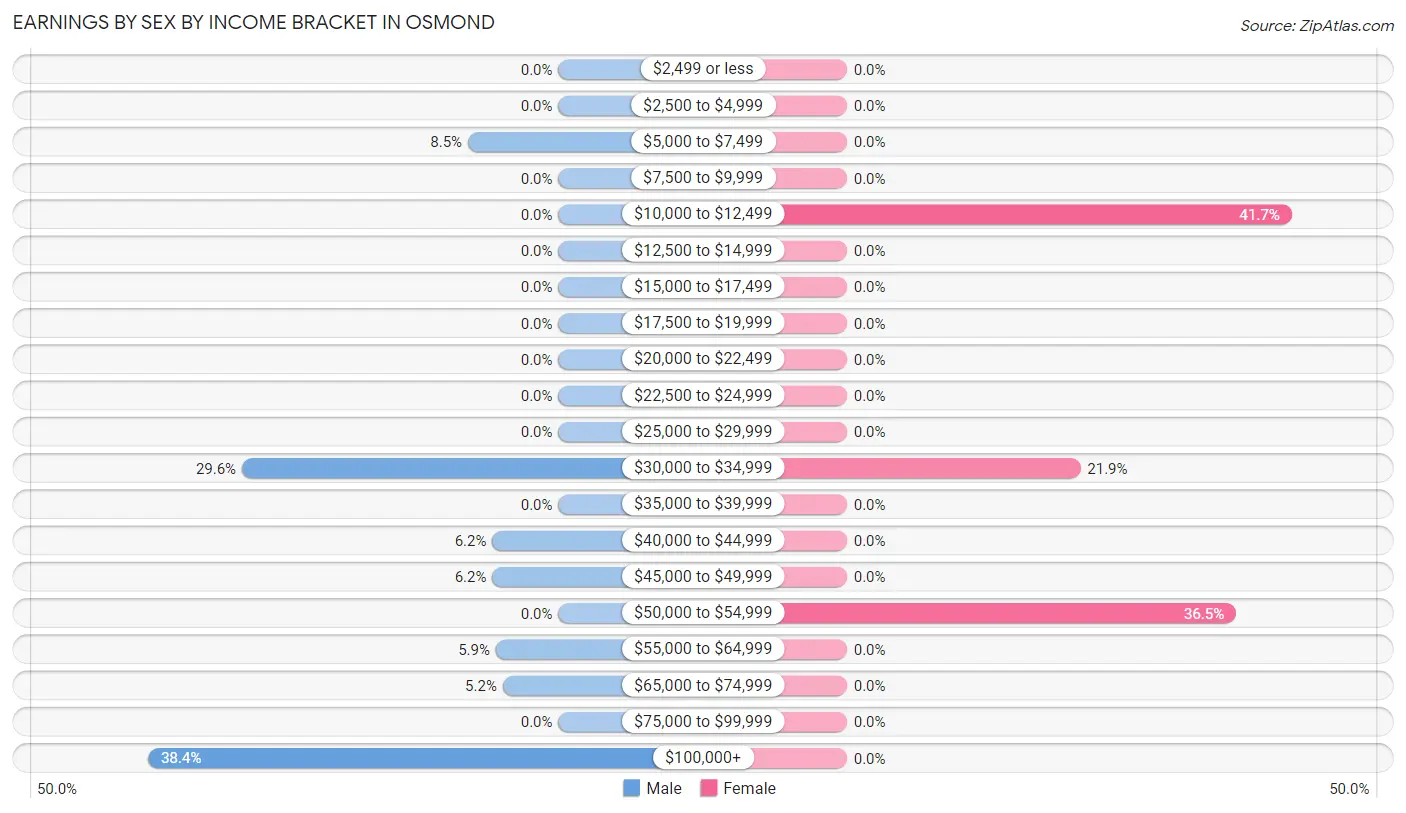
Earnings by Sex by Income Bracket in Osmond
The most common earnings brackets in Osmond are $100,000+ for men (118 | 38.4%) and $10,000 to $12,499 for women (40 | 41.7%).
| Income | Male | Female |
| $2,499 or less | 0 (0.0%) | 0 (0.0%) |
| $2,500 to $4,999 | 0 (0.0%) | 0 (0.0%) |
| $5,000 to $7,499 | 26 (8.5%) | 0 (0.0%) |
| $7,500 to $9,999 | 0 (0.0%) | 0 (0.0%) |
| $10,000 to $12,499 | 0 (0.0%) | 40 (41.7%) |
| $12,500 to $14,999 | 0 (0.0%) | 0 (0.0%) |
| $15,000 to $17,499 | 0 (0.0%) | 0 (0.0%) |
| $17,500 to $19,999 | 0 (0.0%) | 0 (0.0%) |
| $20,000 to $22,499 | 0 (0.0%) | 0 (0.0%) |
| $22,500 to $24,999 | 0 (0.0%) | 0 (0.0%) |
| $25,000 to $29,999 | 0 (0.0%) | 0 (0.0%) |
| $30,000 to $34,999 | 91 (29.6%) | 21 (21.9%) |
| $35,000 to $39,999 | 0 (0.0%) | 0 (0.0%) |
| $40,000 to $44,999 | 19 (6.2%) | 0 (0.0%) |
| $45,000 to $49,999 | 19 (6.2%) | 0 (0.0%) |
| $50,000 to $54,999 | 0 (0.0%) | 35 (36.5%) |
| $55,000 to $64,999 | 18 (5.9%) | 0 (0.0%) |
| $65,000 to $74,999 | 16 (5.2%) | 0 (0.0%) |
| $75,000 to $99,999 | 0 (0.0%) | 0 (0.0%) |
| $100,000+ | 118 (38.4%) | 0 (0.0%) |
| Total | 307 (100.0%) | 96 (100.0%) |
Earnings by Sex by Educational Attainment in Osmond
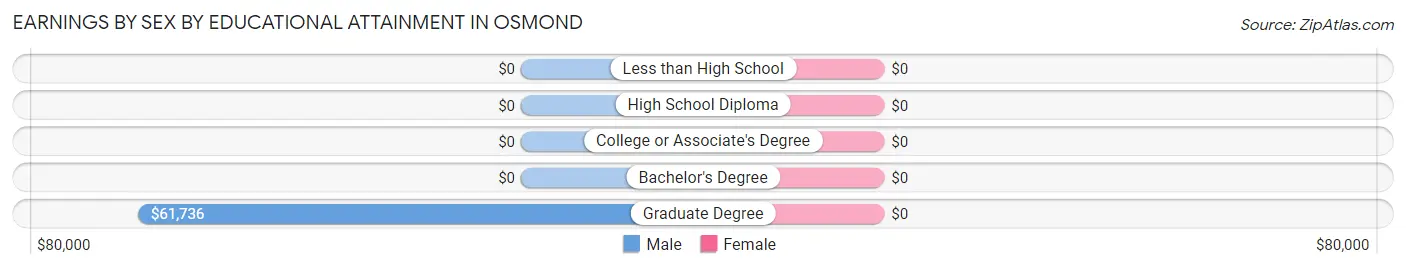
| Educational Attainment | Male Income | Female Income |
| Less than High School | - | - |
| High School Diploma | - | - |
| College or Associate's Degree | - | - |
| Bachelor's Degree | - | - |
| Graduate Degree | $61,736 | $0 |
| Total | - | - |
Family Income in Osmond
Family Income Brackets in Osmond
According to the Osmond family income data, there are 107 families falling into the $100,000 to $149,999 income range, which is the most common income bracket and makes up 57.5% of all families.
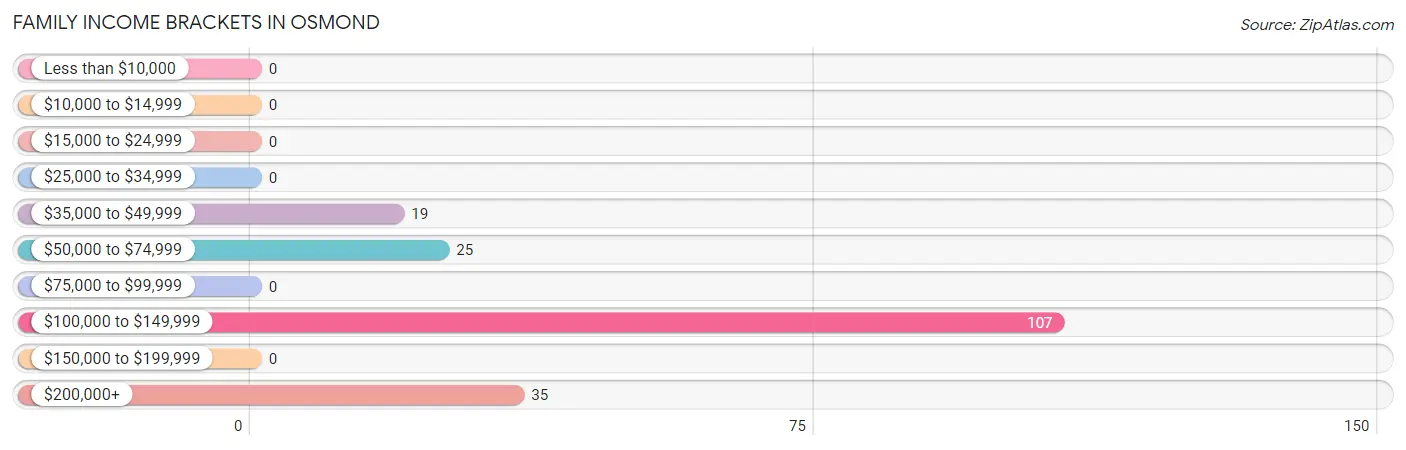
| Income Bracket | # Families | % Families |
| Less than $10,000 | 0 | 0.0% |
| $10,000 to $14,999 | 0 | 0.0% |
| $15,000 to $24,999 | 0 | 0.0% |
| $25,000 to $34,999 | 0 | 0.0% |
| $35,000 to $49,999 | 19 | 10.2% |
| $50,000 to $74,999 | 25 | 13.4% |
| $75,000 to $99,999 | 0 | 0.0% |
| $100,000 to $149,999 | 107 | 57.5% |
| $150,000 to $199,999 | 0 | 0.0% |
| $200,000+ | 35 | 18.8% |
Family Income by Famaliy Size in Osmond
5-person families (126 | 67.7%) account for the highest median family income in Osmond with $124,444 per family, while 5-person families (126 | 67.7%) have the highest median income of $24,889 per family member.
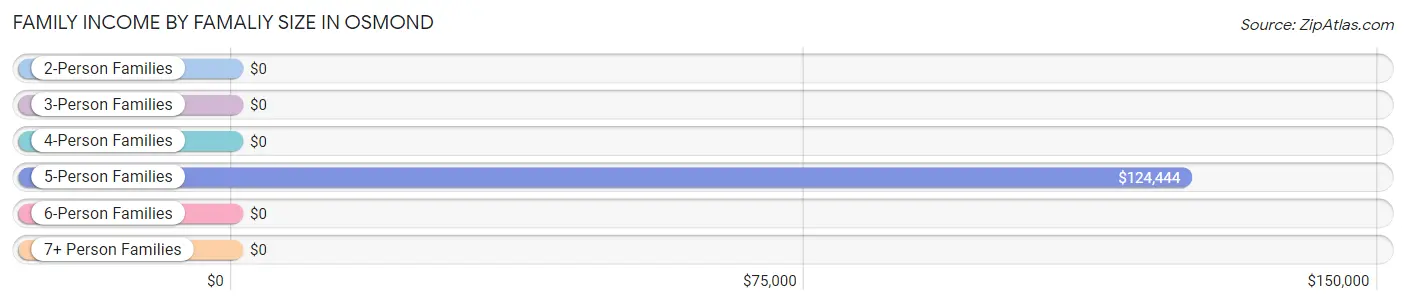
| Income Bracket | # Families | Median Income |
| 2-Person Families | 16 (8.6%) | $0 |
| 3-Person Families | 6 (3.2%) | $0 |
| 4-Person Families | 0 (0.0%) | $0 |
| 5-Person Families | 126 (67.7%) | $124,444 |
| 6-Person Families | 19 (10.2%) | $0 |
| 7+ Person Families | 19 (10.2%) | $0 |
| Total | 186 (100.0%) | $123,519 |
Family Income by Number of Earners in Osmond
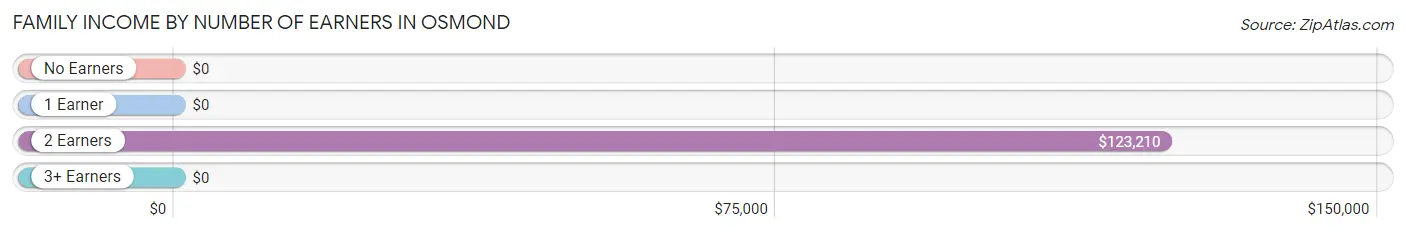
| Number of Earners | # Families | Median Income |
| No Earners | 0 (0.0%) | $0 |
| 1 Earner | 35 (18.8%) | $0 |
| 2 Earners | 116 (62.4%) | $123,210 |
| 3+ Earners | 35 (18.8%) | $0 |
| Total | 186 (100.0%) | $123,519 |
Household Income in Osmond
Household Income Brackets in Osmond
With 107 households falling in the category, the $100,000 to $149,999 income range is the most frequent in Osmond, accounting for 50.0% of all households.
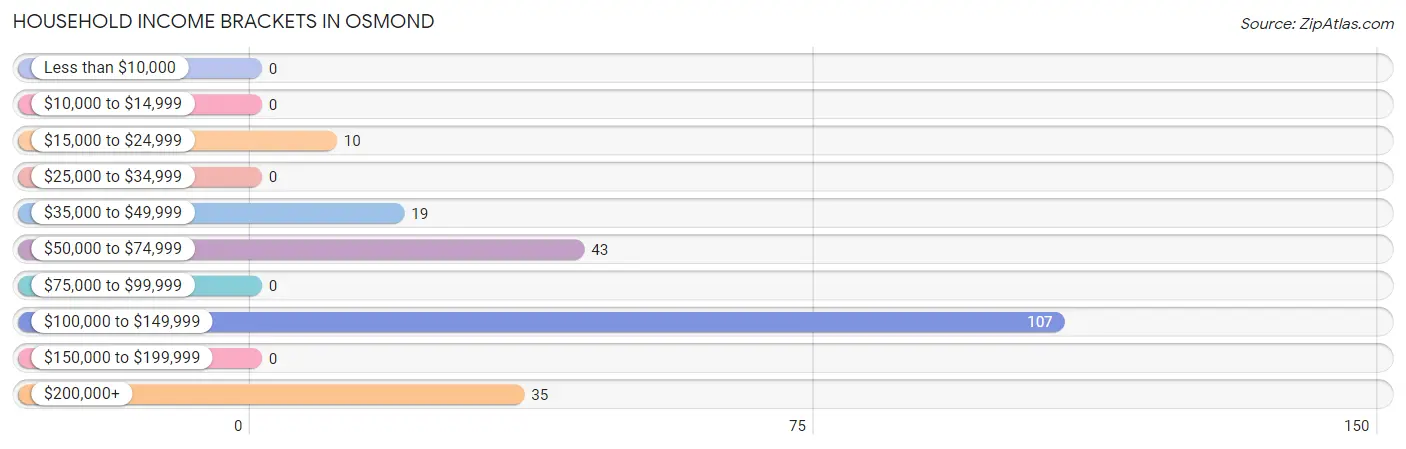
| Income Bracket | # Households | % Households |
| Less than $10,000 | 0 | 0.0% |
| $10,000 to $14,999 | 0 | 0.0% |
| $15,000 to $24,999 | 10 | 4.7% |
| $25,000 to $34,999 | 0 | 0.0% |
| $35,000 to $49,999 | 19 | 8.9% |
| $50,000 to $74,999 | 43 | 20.1% |
| $75,000 to $99,999 | 0 | 0.0% |
| $100,000 to $149,999 | 107 | 50.0% |
| $150,000 to $199,999 | 0 | 0.0% |
| $200,000+ | 35 | 16.4% |
Household Income by Householder Age in Osmond
The median household income in Osmond is $123,086, with the highest median household income of $123,318 found in the 25 to 44 years age bracket for the primary householder. A total of 129 households (60.3%) fall into this category.
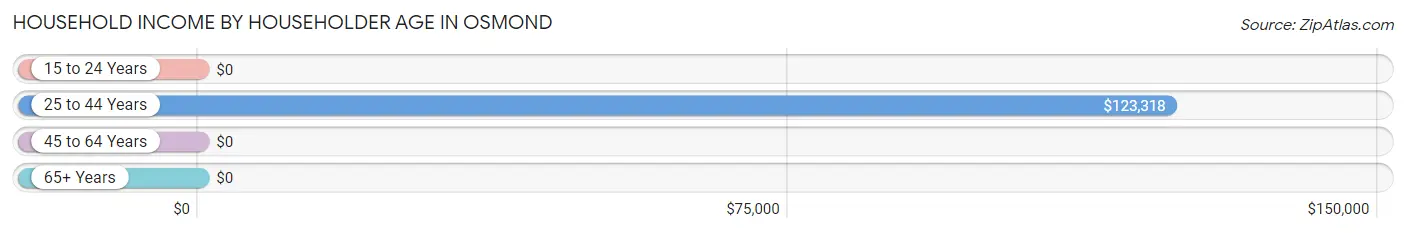
| Income Bracket | # Households | Median Income |
| 15 to 24 Years | 0 (0.0%) | $0 |
| 25 to 44 Years | 129 (60.3%) | $123,318 |
| 45 to 64 Years | 79 (36.9%) | $0 |
| 65+ Years | 6 (2.8%) | $0 |
| Total | 214 (100.0%) | $123,086 |
Poverty in Osmond
Income Below Poverty by Sex and Age in Osmond
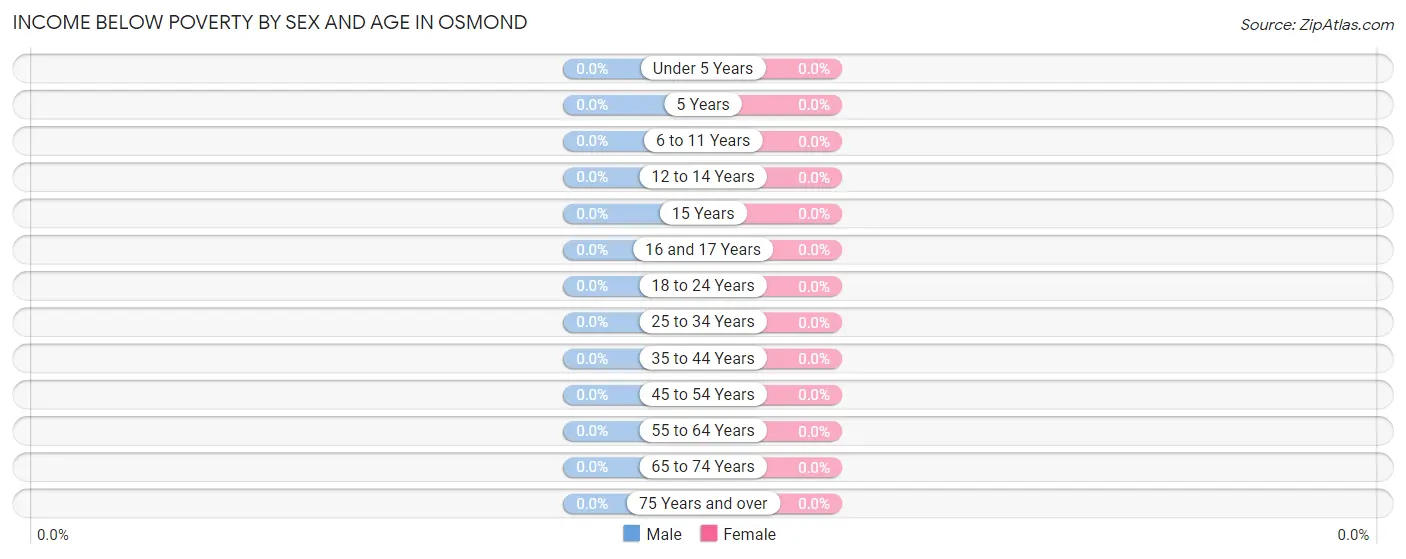
| Age Bracket | Male | Female |
| Under 5 Years | 0 (0.0%) | 0 (0.0%) |
| 5 Years | 0 (0.0%) | 0 (0.0%) |
| 6 to 11 Years | 0 (0.0%) | 0 (0.0%) |
| 12 to 14 Years | 0 (0.0%) | 0 (0.0%) |
| 15 Years | 0 (0.0%) | 0 (0.0%) |
| 16 and 17 Years | 0 (0.0%) | 0 (0.0%) |
| 18 to 24 Years | 0 (0.0%) | 0 (0.0%) |
| 25 to 34 Years | 0 (0.0%) | 0 (0.0%) |
| 35 to 44 Years | 0 (0.0%) | 0 (0.0%) |
| 45 to 54 Years | 0 (0.0%) | 0 (0.0%) |
| 55 to 64 Years | 0 (0.0%) | 0 (0.0%) |
| 65 to 74 Years | 0 (0.0%) | 0 (0.0%) |
| 75 Years and over | 0 (0.0%) | 0 (0.0%) |
| Total | 0 (0.0%) | 0 (0.0%) |
Income Above Poverty by Sex and Age in Osmond
According to the poverty statistics in Osmond, males aged under 5 years and females aged under 5 years are the age groups that are most secure financially, with 100.0% of males and 100.0% of females in these age groups living above the poverty line.
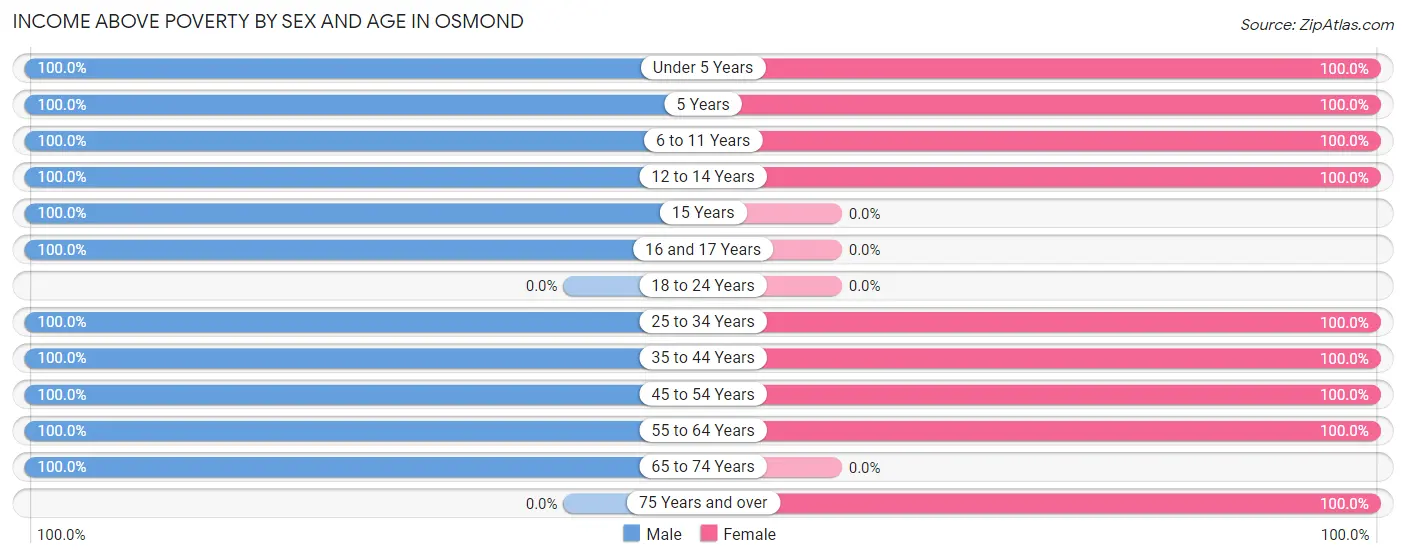
| Age Bracket | Male | Female |
| Under 5 Years | 34 (100.0%) | 105 (100.0%) |
| 5 Years | 15 (100.0%) | 43 (100.0%) |
| 6 to 11 Years | 15 (100.0%) | 87 (100.0%) |
| 12 to 14 Years | 10 (100.0%) | 24 (100.0%) |
| 15 Years | 29 (100.0%) | 0 (0.0%) |
| 16 and 17 Years | 26 (100.0%) | 0 (0.0%) |
| 18 to 24 Years | 0 (0.0%) | 0 (0.0%) |
| 25 to 34 Years | 84 (100.0%) | 40 (100.0%) |
| 35 to 44 Years | 136 (100.0%) | 40 (100.0%) |
| 45 to 54 Years | 43 (100.0%) | 56 (100.0%) |
| 55 to 64 Years | 18 (100.0%) | 10 (100.0%) |
| 65 to 74 Years | 6 (100.0%) | 0 (0.0%) |
| 75 Years and over | 0 (0.0%) | 5 (100.0%) |
| Total | 416 (100.0%) | 410 (100.0%) |
Income Below Poverty Among Married-Couple Families in Osmond
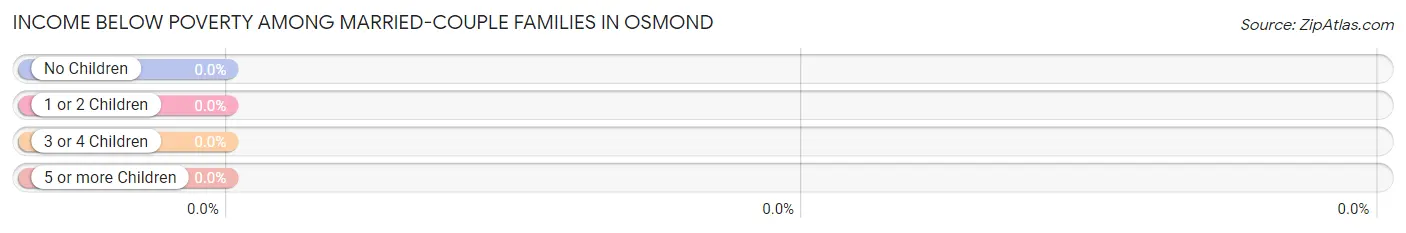
| Children | Above Poverty | Below Poverty |
| No Children | 22 (100.0%) | 0 (0.0%) |
| 1 or 2 Children | 35 (100.0%) | 0 (0.0%) |
| 3 or 4 Children | 110 (100.0%) | 0 (0.0%) |
| 5 or more Children | 19 (100.0%) | 0 (0.0%) |
| Total | 186 (100.0%) | 0 (0.0%) |
Income Below Poverty Among Single-Parent Households in Osmond
| Children | Single Father | Single Mother |
| No Children | 0 (0.0%) | 0 (0.0%) |
| 1 or 2 Children | 0 (0.0%) | 0 (0.0%) |
| 3 or 4 Children | 0 (0.0%) | 0 (0.0%) |
| 5 or more Children | 0 (0.0%) | 0 (0.0%) |
| Total | 0 (0.0%) | 0 (0.0%) |
Income Below Poverty Among Married-Couple vs Single-Parent Households in Osmond
| Children | Married-Couple Families | Single-Parent Households |
| No Children | 0 (0.0%) | 0 (0.0%) |
| 1 or 2 Children | 0 (0.0%) | 0 (0.0%) |
| 3 or 4 Children | 0 (0.0%) | 0 (0.0%) |
| 5 or more Children | 0 (0.0%) | 0 (0.0%) |
| Total | 0 (0.0%) | 0 (0.0%) |
Race in Osmond
The most populous races in Osmond are White / Caucasian (781 | 94.6%), Two or more Races (45 | 5.4%), and Hispanic or Latino (19 | 2.3%).
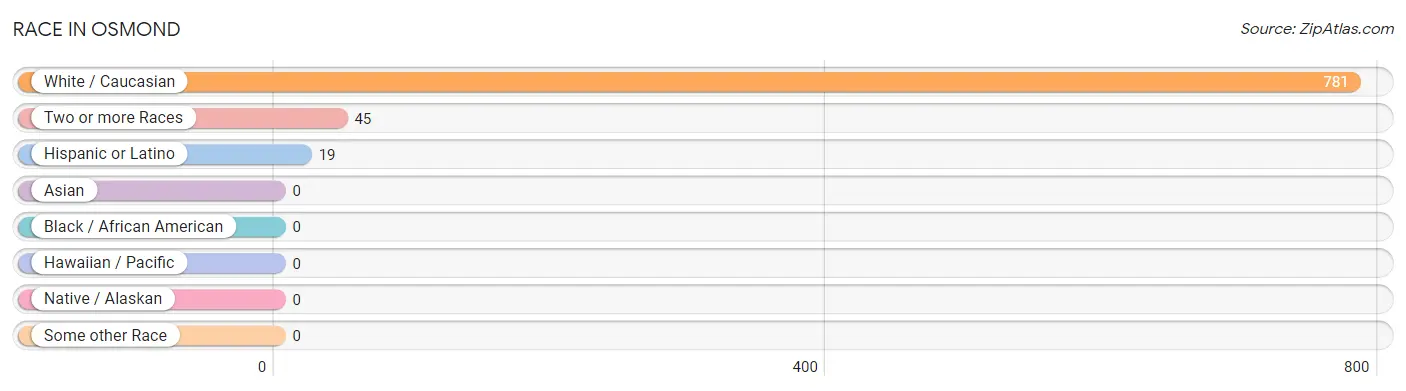
| Race | # Population | % Population |
| Asian | 0 | 0.0% |
| Black / African American | 0 | 0.0% |
| Hawaiian / Pacific | 0 | 0.0% |
| Hispanic or Latino | 19 | 2.3% |
| Native / Alaskan | 0 | 0.0% |
| White / Caucasian | 781 | 94.6% |
| Two or more Races | 45 | 5.4% |
| Some other Race | 0 | 0.0% |
| Total | 826 | 100.0% |
Ancestry in Osmond
The most populous ancestries reported in Osmond are English (214 | 25.9%), European (194 | 23.5%), Dutch (132 | 16.0%), Swedish (45 | 5.4%), and Danish (23 | 2.8%), together accounting for 73.6% of all Osmond residents.
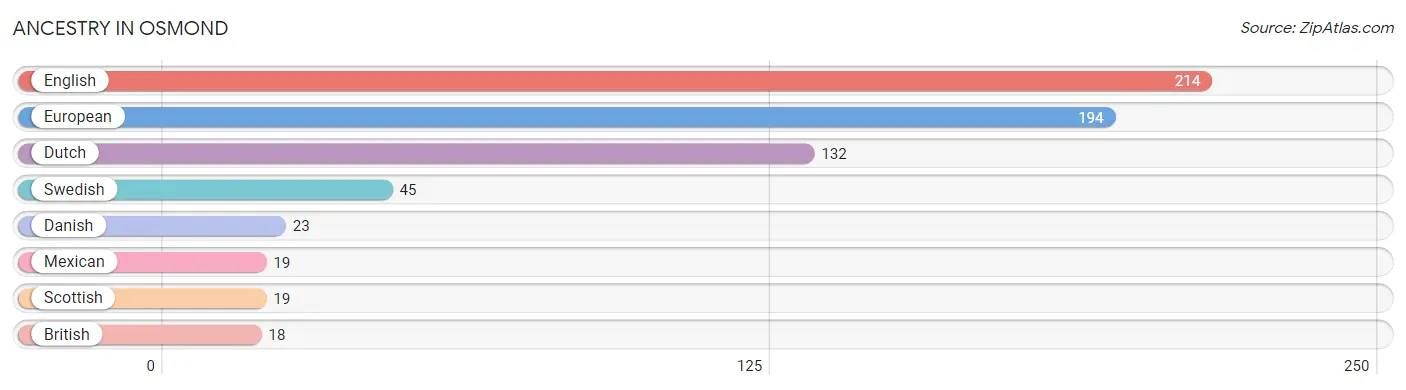
| Ancestry | # Population | % Population |
| British | 18 | 2.2% |
| Danish | 23 | 2.8% |
| Dutch | 132 | 16.0% |
| English | 214 | 25.9% |
| European | 194 | 23.5% |
| Mexican | 19 | 2.3% |
| Scottish | 19 | 2.3% |
| Swedish | 45 | 5.4% | View All 8 Rows |
Immigrants in Osmond

| Immigration Origin | # Population | % Population | View All 0 Rows |
Sex and Age in Osmond
Sex and Age in Osmond
The most populous age groups in Osmond are 40 to 44 Years (100 | 24.0%) for men and Under 5 Years (105 | 25.6%) for women.
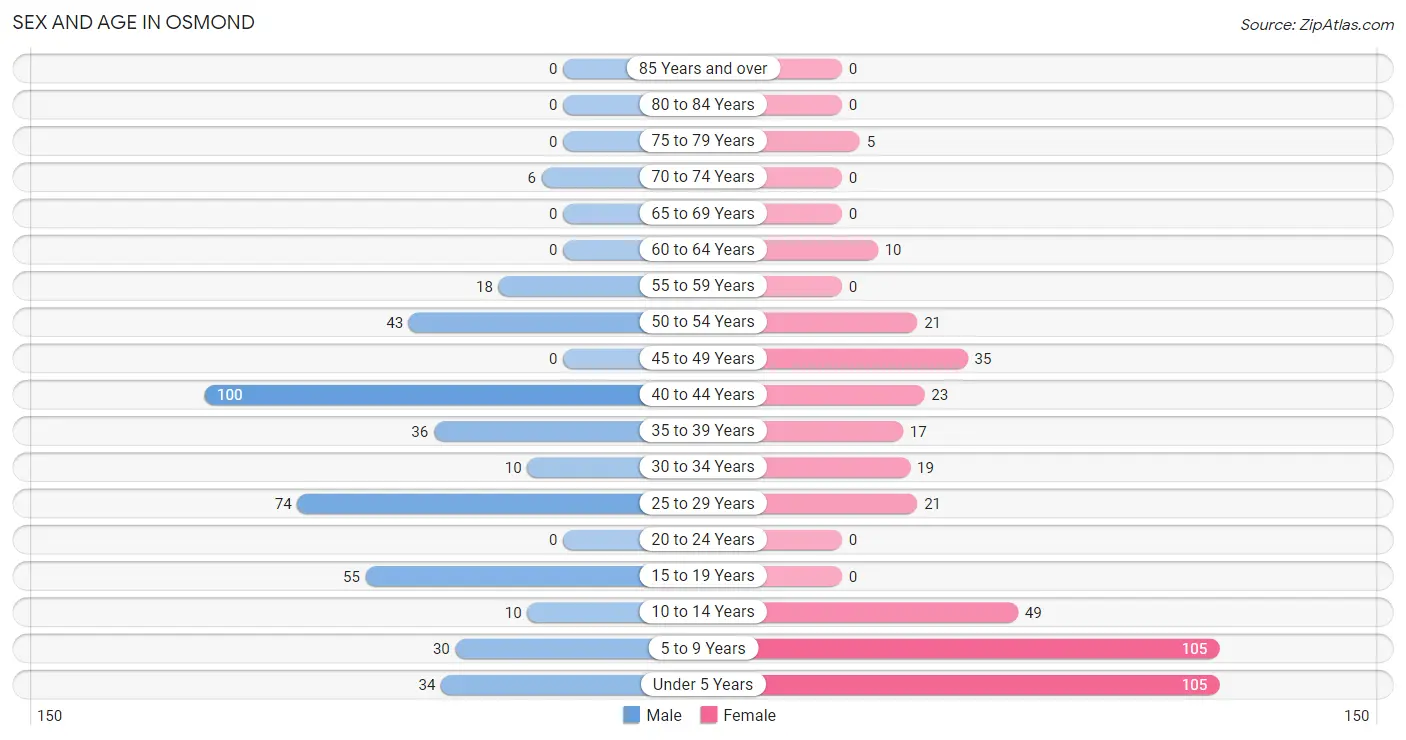
| Age Bracket | Male | Female |
| Under 5 Years | 34 (8.2%) | 105 (25.6%) |
| 5 to 9 Years | 30 (7.2%) | 105 (25.6%) |
| 10 to 14 Years | 10 (2.4%) | 49 (11.9%) |
| 15 to 19 Years | 55 (13.2%) | 0 (0.0%) |
| 20 to 24 Years | 0 (0.0%) | 0 (0.0%) |
| 25 to 29 Years | 74 (17.8%) | 21 (5.1%) |
| 30 to 34 Years | 10 (2.4%) | 19 (4.6%) |
| 35 to 39 Years | 36 (8.6%) | 17 (4.2%) |
| 40 to 44 Years | 100 (24.0%) | 23 (5.6%) |
| 45 to 49 Years | 0 (0.0%) | 35 (8.5%) |
| 50 to 54 Years | 43 (10.3%) | 21 (5.1%) |
| 55 to 59 Years | 18 (4.3%) | 0 (0.0%) |
| 60 to 64 Years | 0 (0.0%) | 10 (2.4%) |
| 65 to 69 Years | 0 (0.0%) | 0 (0.0%) |
| 70 to 74 Years | 6 (1.4%) | 0 (0.0%) |
| 75 to 79 Years | 0 (0.0%) | 5 (1.2%) |
| 80 to 84 Years | 0 (0.0%) | 0 (0.0%) |
| 85 Years and over | 0 (0.0%) | 0 (0.0%) |
| Total | 416 (100.0%) | 410 (100.0%) |
Families and Households in Osmond
Median Family Size in Osmond
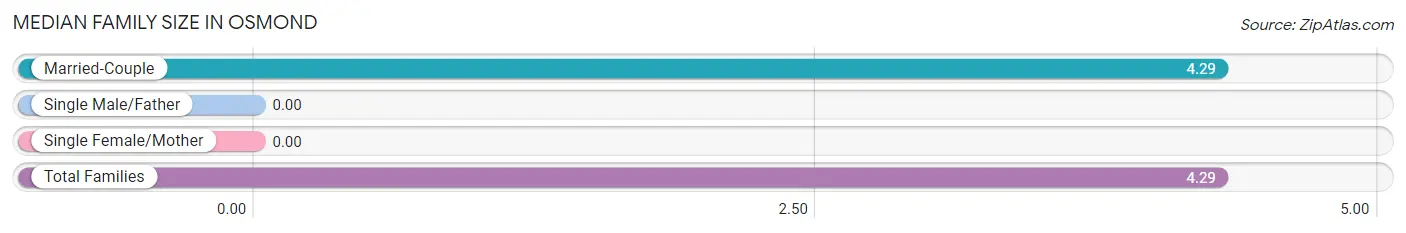
| Family Type | # Families | Family Size |
| Married-Couple | 186 (100.0%) | 4.29 |
| Single Male/Father | 0 (0.0%) | - |
| Single Female/Mother | 0 (0.0%) | - |
| Total Families | 186 (100.0%) | 4.29 |
Median Household Size in Osmond
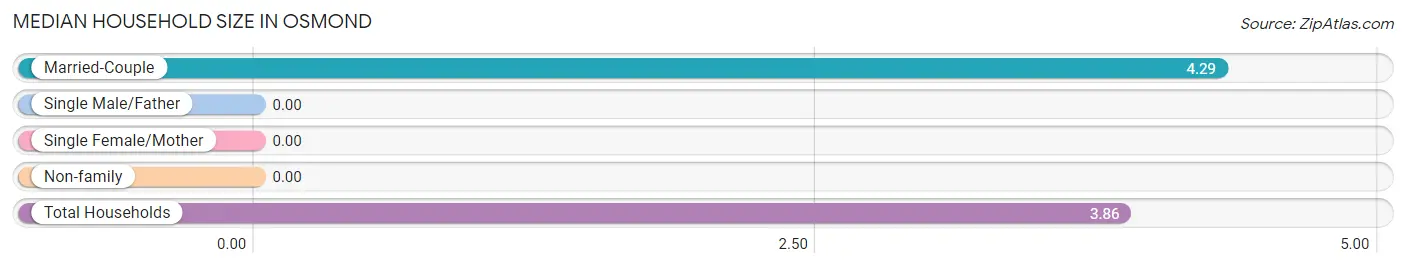
| Household Type | # Households | Household Size |
| Married-Couple | 186 (86.9%) | 4.29 |
| Single Male/Father | 0 (0.0%) | - |
| Single Female/Mother | 0 (0.0%) | - |
| Non-family | 28 (13.1%) | - |
| Total Households | 214 (100.0%) | 3.86 |
Household Size by Marriage Status in Osmond
Out of a total of 214 households in Osmond, 186 (86.9%) are family households, while 28 (13.1%) are nonfamily households. The most numerous type of family households are 5-person households, comprising 126, and the most common type of nonfamily households are 1-person households, comprising 28.
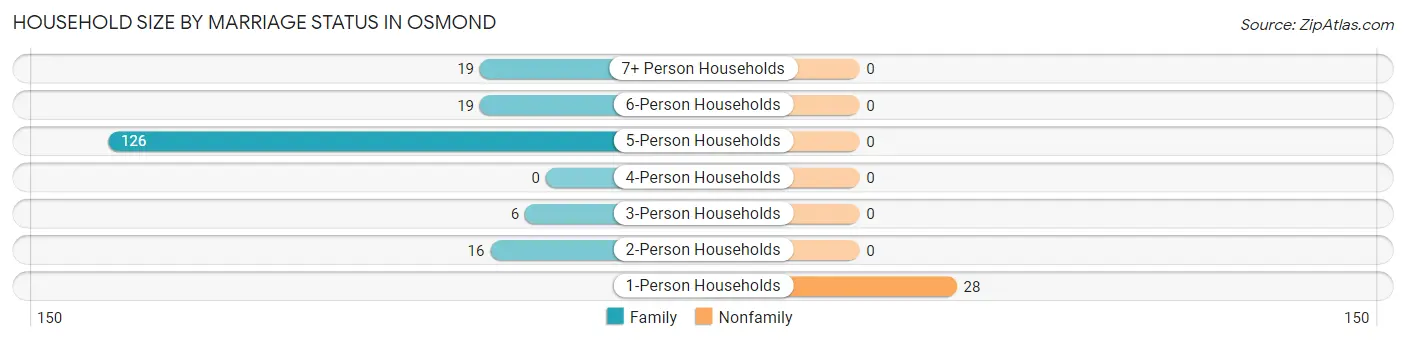
| Household Size | Family Households | Nonfamily Households |
| 1-Person Households | - | 28 (13.1%) |
| 2-Person Households | 16 (7.5%) | 0 (0.0%) |
| 3-Person Households | 6 (2.8%) | 0 (0.0%) |
| 4-Person Households | 0 (0.0%) | 0 (0.0%) |
| 5-Person Households | 126 (58.9%) | 0 (0.0%) |
| 6-Person Households | 19 (8.9%) | 0 (0.0%) |
| 7+ Person Households | 19 (8.9%) | 0 (0.0%) |
| Total | 186 (86.9%) | 28 (13.1%) |
Female Fertility in Osmond
Fertility by Age in Osmond
| Age Bracket | Women with Births | Births / 1,000 Women |
| 15 to 19 years | 0 (0.0%) | 0.0 |
| 20 to 34 years | 0 (0.0%) | 0.0 |
| 35 to 50 years | 0 (0.0%) | 0.0 |
| Total | 0 (0.0%) | 0.0 |
Fertility by Age by Marriage Status in Osmond
| Age Bracket | Married | Unmarried |
| 15 to 19 years | 0 (0.0%) | 0 (0.0%) |
| 20 to 34 years | 0 (0.0%) | 0 (0.0%) |
| 35 to 50 years | 0 (0.0%) | 0 (0.0%) |
| Total | 0 (0.0%) | 0 (0.0%) |
Fertility by Education in Osmond
| Educational Attainment | Women with Births | Births / 1,000 Women |
| Less than High School | 0 (0.0%) | 0.0 |
| High School Diploma | 0 (0.0%) | 0.0 |
| College or Associate's Degree | 0 (0.0%) | 0.0 |
| Bachelor's Degree | 0 (0.0%) | 0.0 |
| Graduate Degree | 0 (0.0%) | 0.0 |
| Total | 0 (0.0%) | 0.0 |
Fertility by Education by Marriage Status in Osmond
| Educational Attainment | Married | Unmarried |
| Less than High School | 0 (0.0%) | 0 (0.0%) |
| High School Diploma | 0 (0.0%) | 0 (0.0%) |
| College or Associate's Degree | 0 (0.0%) | 0 (0.0%) |
| Bachelor's Degree | 0 (0.0%) | 0 (0.0%) |
| Graduate Degree | 0 (0.0%) | 0 (0.0%) |
| Total | 0 (0.0%) | 0 (0.0%) |
Employment Characteristics in Osmond
Employment by Class of Employer in Osmond
Among the 339 employed individuals in Osmond, private company employees (206 | 60.8%), self-employed (not incorporated) (46 | 13.6%), and self-employed (incorporated) (37 | 10.9%) make up the most common classes of employment.
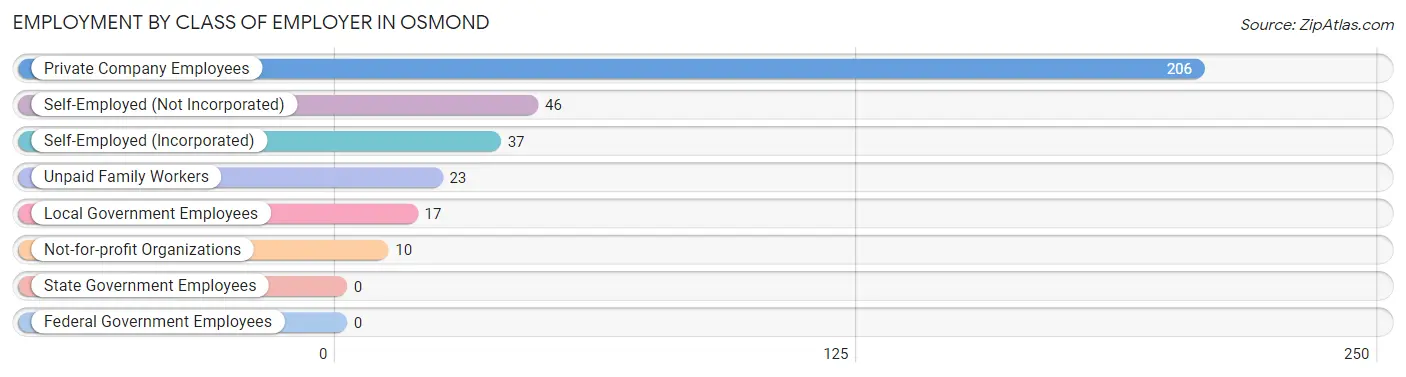
| Employer Class | # Employees | % Employees |
| Private Company Employees | 206 | 60.8% |
| Self-Employed (Incorporated) | 37 | 10.9% |
| Self-Employed (Not Incorporated) | 46 | 13.6% |
| Not-for-profit Organizations | 10 | 2.9% |
| Local Government Employees | 17 | 5.0% |
| State Government Employees | 0 | 0.0% |
| Federal Government Employees | 0 | 0.0% |
| Unpaid Family Workers | 23 | 6.8% |
| Total | 339 | 100.0% |
Employment Status by Age in Osmond
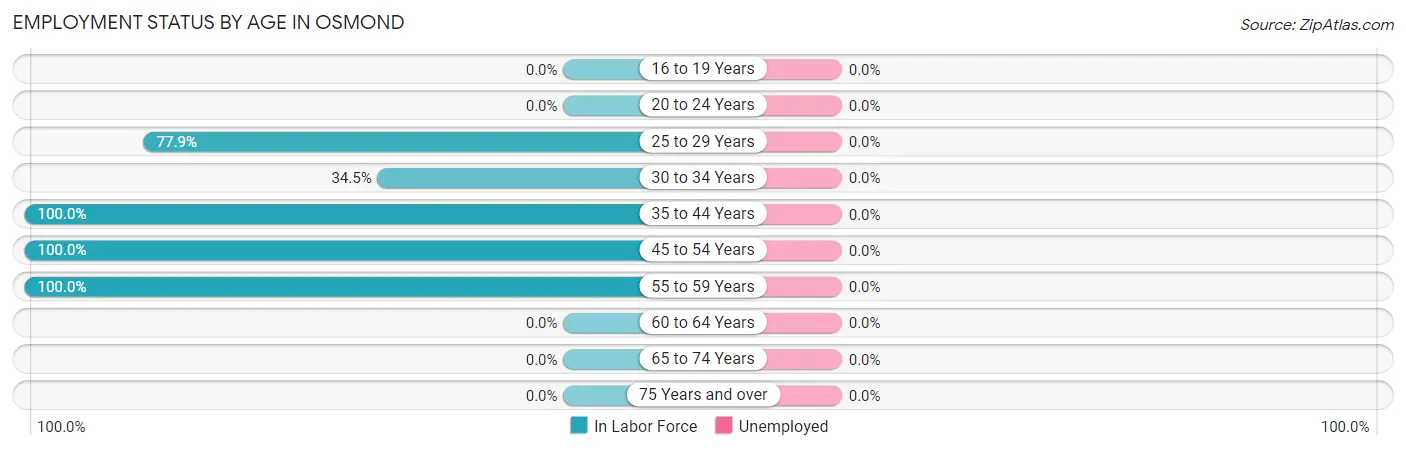
| Age Bracket | In Labor Force | Unemployed |
| 16 to 19 Years | 0 (0.0%) | 0 (0.0%) |
| 20 to 24 Years | 0 (0.0%) | 0 (0.0%) |
| 25 to 29 Years | 74 (77.9%) | 0 (0.0%) |
| 30 to 34 Years | 10 (34.5%) | 0 (0.0%) |
| 35 to 44 Years | 176 (100.0%) | 0 (0.0%) |
| 45 to 54 Years | 99 (100.0%) | 0 (0.0%) |
| 55 to 59 Years | 18 (100.0%) | 0 (0.0%) |
| 60 to 64 Years | 0 (0.0%) | 0 (0.0%) |
| 65 to 74 Years | 0 (0.0%) | 0 (0.0%) |
| 75 Years and over | 0 (0.0%) | 0 (0.0%) |
| Total | 377 (81.3%) | 0 (0.0%) |
Employment Status by Educational Attainment in Osmond
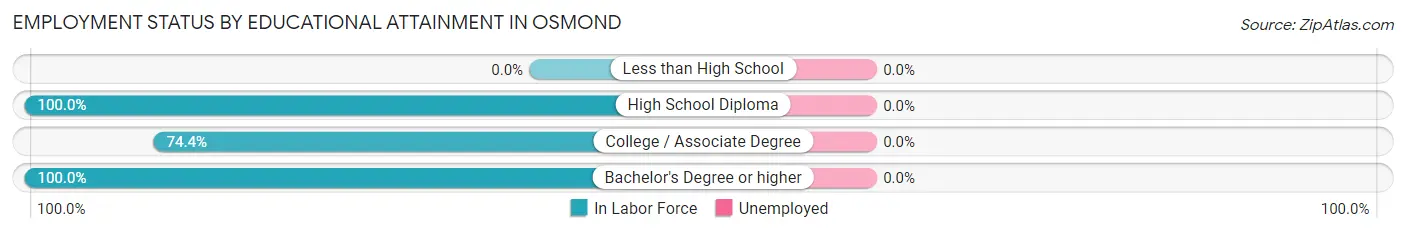
| Educational Attainment | In Labor Force | Unemployed |
| Less than High School | 0 (0.0%) | 0 (0.0%) |
| High School Diploma | 98 (100.0%) | 0 (0.0%) |
| College / Associate Degree | 145 (74.4%) | 0 (0.0%) |
| Bachelor's Degree or higher | 134 (100.0%) | 0 (0.0%) |
| Total | 377 (88.3%) | 0 (0.0%) |
Employment Occupations by Sex in Osmond
Management, Business, Science and Arts Occupations
The most common Management, Business, Science and Arts occupations in Osmond are Community & Social Service (51 | 13.5%), Education, Arts & Media (34 | 9.0%), Business & Financial (27 | 7.2%), Education Instruction & Library (17 | 4.5%), and Management (10 | 2.6%).
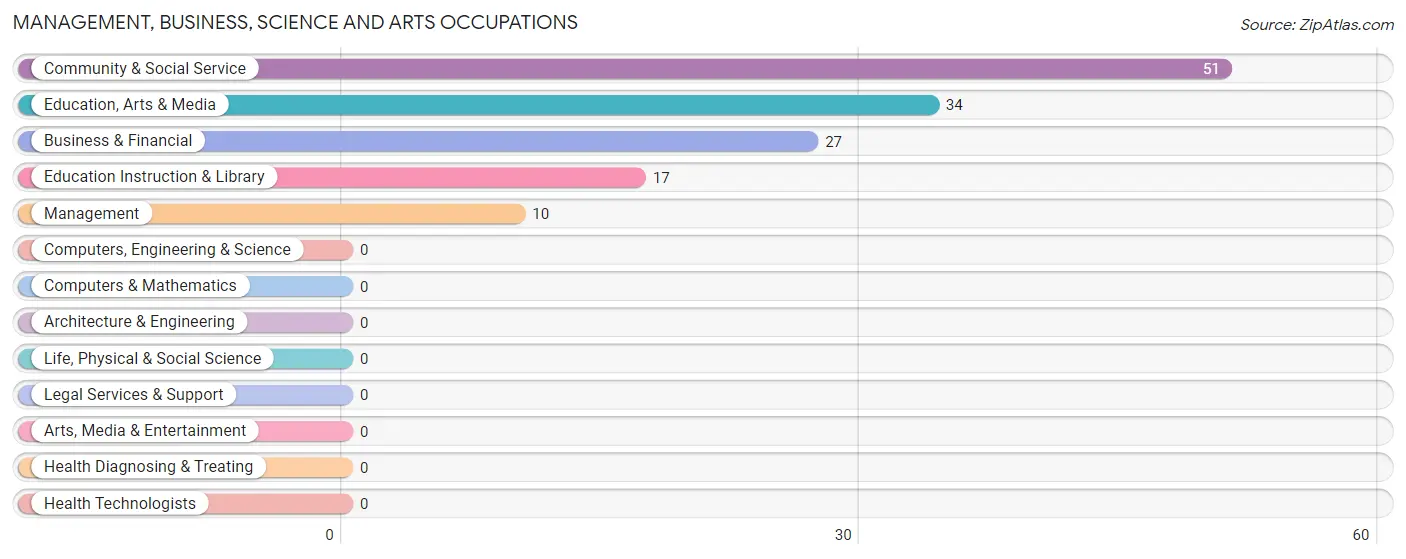
Management, Business, Science and Arts Occupations by Sex
Within the Management, Business, Science and Arts occupations in Osmond, the most male-oriented occupations are Management (100.0%), Business & Financial (100.0%), and Education, Arts & Media (100.0%), while the most female-oriented occupations are Education Instruction & Library (100.0%), and Community & Social Service (33.3%).
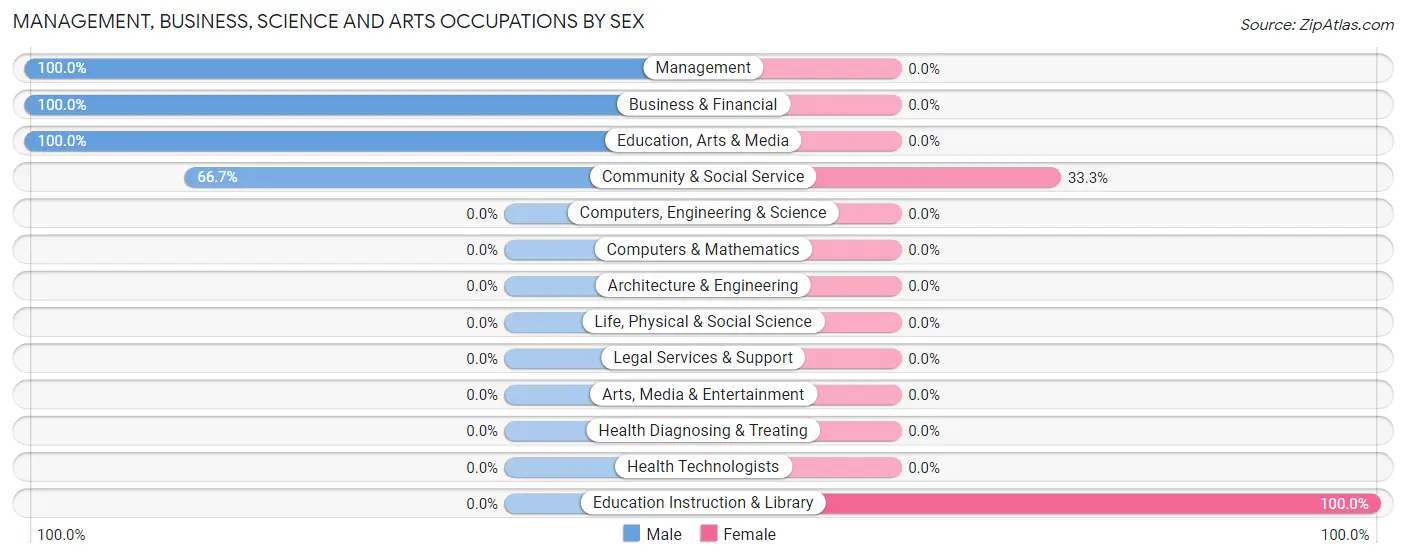
| Occupation | Male | Female |
| Management | 10 (100.0%) | 0 (0.0%) |
| Business & Financial | 27 (100.0%) | 0 (0.0%) |
| Computers, Engineering & Science | 0 (0.0%) | 0 (0.0%) |
| Computers & Mathematics | 0 (0.0%) | 0 (0.0%) |
| Architecture & Engineering | 0 (0.0%) | 0 (0.0%) |
| Life, Physical & Social Science | 0 (0.0%) | 0 (0.0%) |
| Community & Social Service | 34 (66.7%) | 17 (33.3%) |
| Education, Arts & Media | 34 (100.0%) | 0 (0.0%) |
| Legal Services & Support | 0 (0.0%) | 0 (0.0%) |
| Education Instruction & Library | 0 (0.0%) | 17 (100.0%) |
| Arts, Media & Entertainment | 0 (0.0%) | 0 (0.0%) |
| Health Diagnosing & Treating | 0 (0.0%) | 0 (0.0%) |
| Health Technologists | 0 (0.0%) | 0 (0.0%) |
| Total (Category) | 71 (80.7%) | 17 (19.3%) |
| Total (Overall) | 281 (74.5%) | 96 (25.5%) |
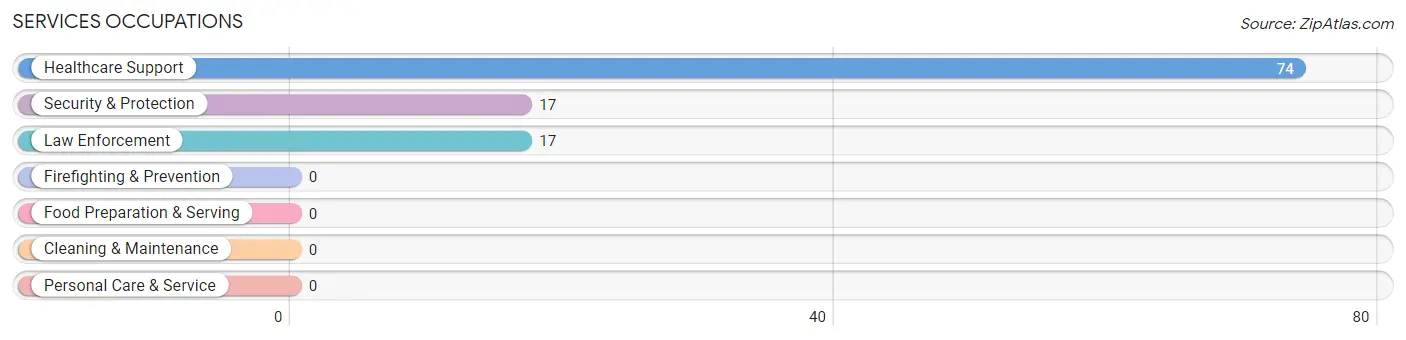
Services Occupations
The most common Services occupations in Osmond are Healthcare Support (74 | 19.6%), Security & Protection (17 | 4.5%), and Law Enforcement (17 | 4.5%).
Services Occupations by Sex
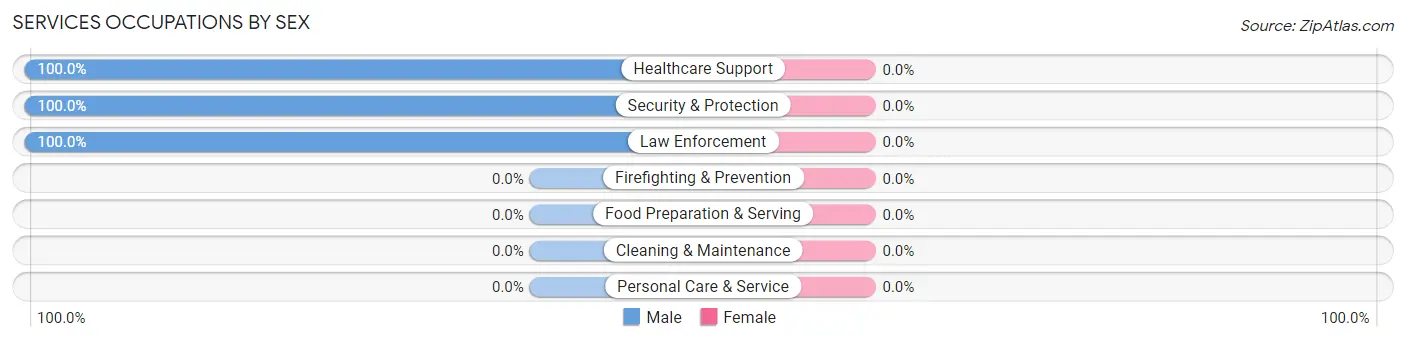
| Occupation | Male | Female |
| Healthcare Support | 74 (100.0%) | 0 (0.0%) |
| Security & Protection | 17 (100.0%) | 0 (0.0%) |
| Firefighting & Prevention | 0 (0.0%) | 0 (0.0%) |
| Law Enforcement | 17 (100.0%) | 0 (0.0%) |
| Food Preparation & Serving | 0 (0.0%) | 0 (0.0%) |
| Cleaning & Maintenance | 0 (0.0%) | 0 (0.0%) |
| Personal Care & Service | 0 (0.0%) | 0 (0.0%) |
| Total (Category) | 91 (100.0%) | 0 (0.0%) |
| Total (Overall) | 281 (74.5%) | 96 (25.5%) |
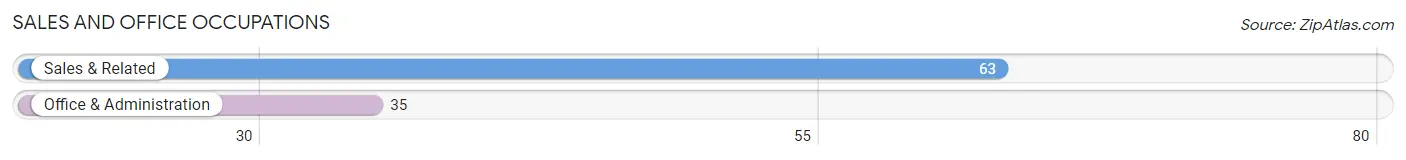
Sales and Office Occupations
The most common Sales and Office occupations in Osmond are Sales & Related (63 | 16.7%), and Office & Administration (35 | 9.3%).
Sales and Office Occupations by Sex

| Occupation | Male | Female |
| Sales & Related | 19 (30.2%) | 44 (69.8%) |
| Office & Administration | 0 (0.0%) | 35 (100.0%) |
| Total (Category) | 19 (19.4%) | 79 (80.6%) |
| Total (Overall) | 281 (74.5%) | 96 (25.5%) |
Natural Resources, Construction and Maintenance Occupations
The most common Natural Resources, Construction and Maintenance occupations in Osmond are , and Construction & Extraction (100 | 26.5%).

Natural Resources, Construction and Maintenance Occupations by Sex
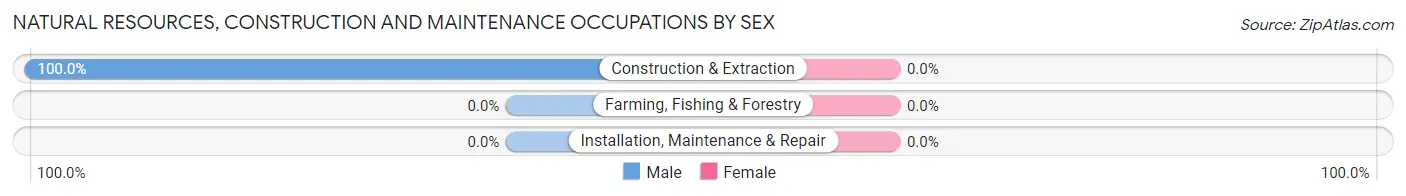
| Occupation | Male | Female |
| Farming, Fishing & Forestry | 0 (0.0%) | 0 (0.0%) |
| Construction & Extraction | 100 (100.0%) | 0 (0.0%) |
| Installation, Maintenance & Repair | 0 (0.0%) | 0 (0.0%) |
| Total (Category) | 100 (100.0%) | 0 (0.0%) |
| Total (Overall) | 281 (74.5%) | 96 (25.5%) |
Production, Transportation and Moving Occupations
Production, Transportation and Moving Occupations by Sex
| Occupation | Male | Female |
| Production | 0 (0.0%) | 0 (0.0%) |
| Transportation | 0 (0.0%) | 0 (0.0%) |
| Material Moving | 0 (0.0%) | 0 (0.0%) |
| Total (Category) | 0 (0.0%) | 0 (0.0%) |
| Total (Overall) | 281 (74.5%) | 96 (25.5%) |
Employment Industries by Sex in Osmond
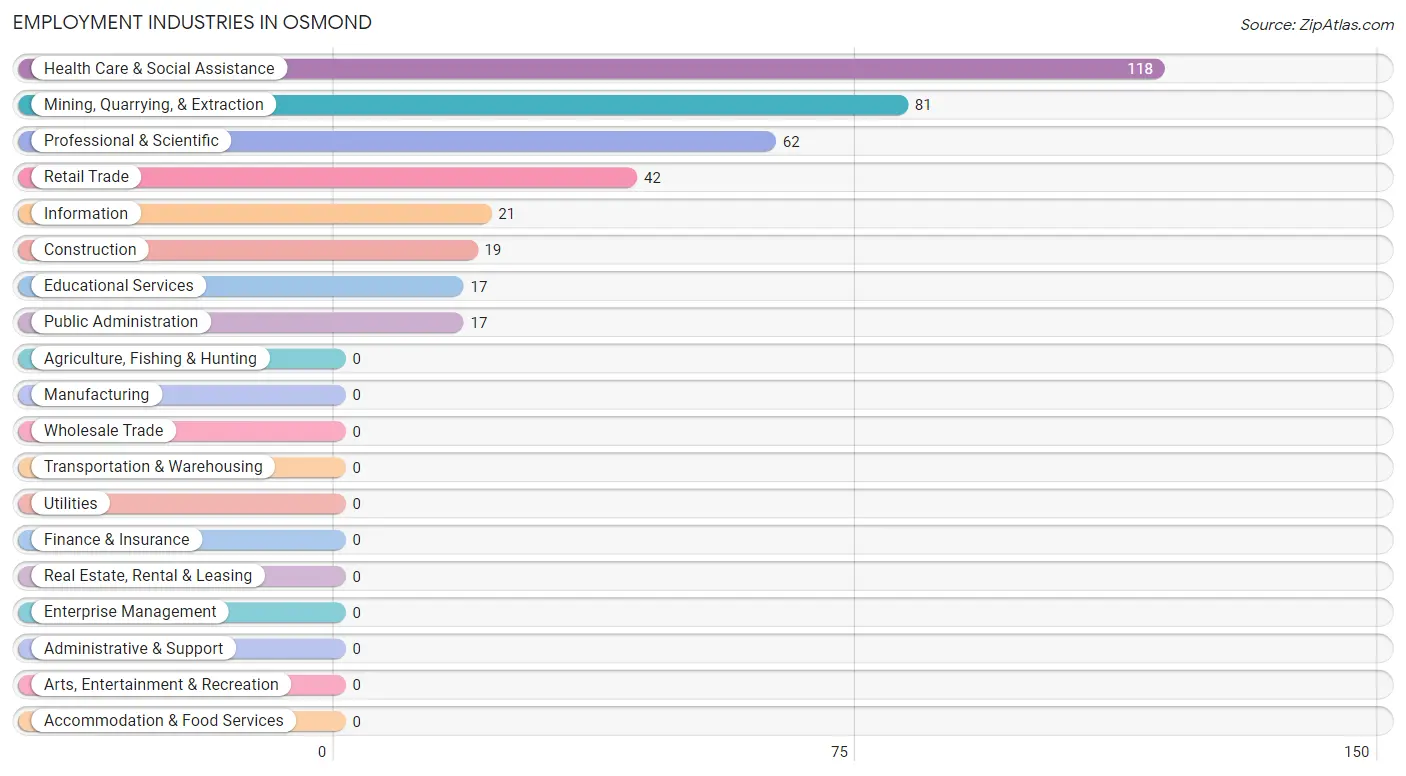
Employment Industries in Osmond
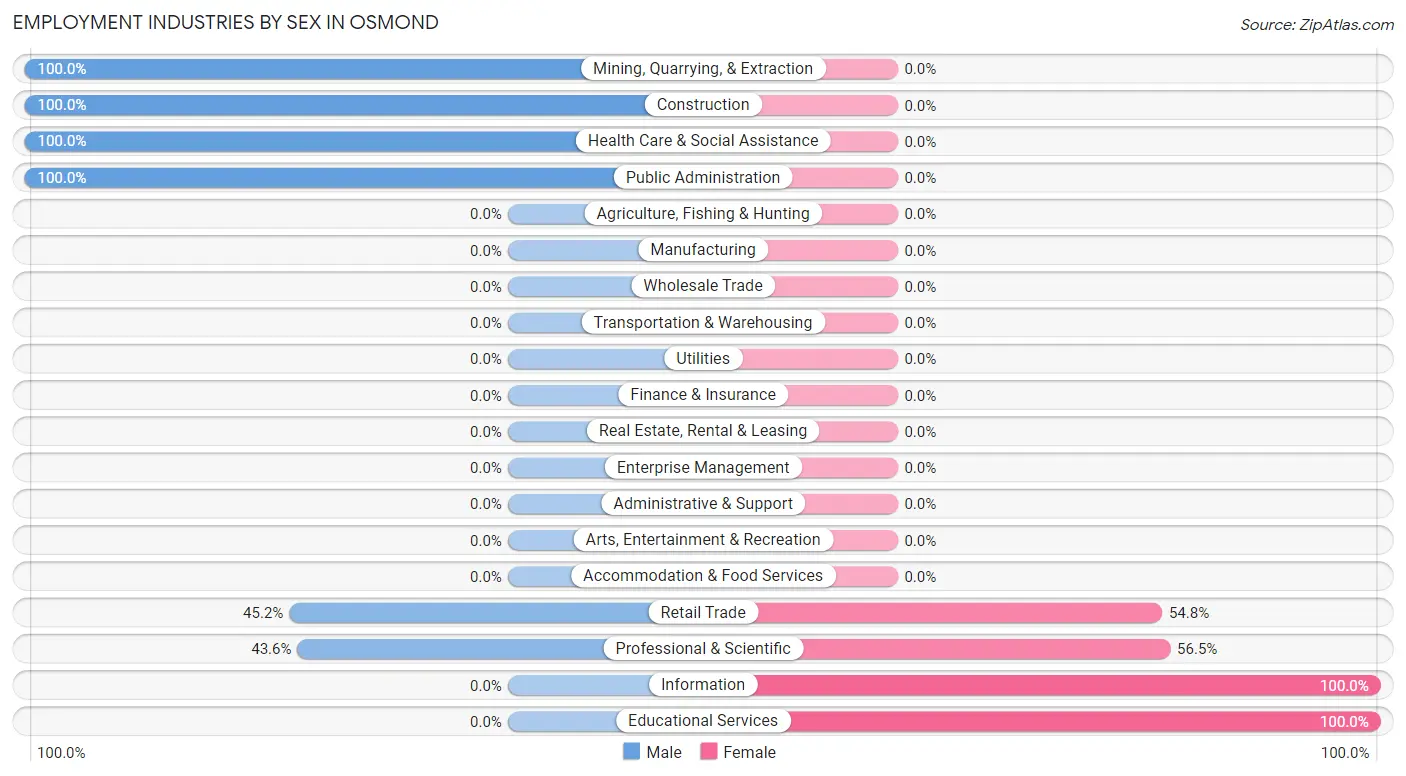
The major employment industries in Osmond include Health Care & Social Assistance (118 | 31.3%), Mining, Quarrying, & Extraction (81 | 21.5%), Professional & Scientific (62 | 16.5%), Retail Trade (42 | 11.1%), and Information (21 | 5.6%).
Employment Industries by Sex in Osmond
The Osmond industries that see more men than women are Mining, Quarrying, & Extraction (100.0%), Construction (100.0%), and Health Care & Social Assistance (100.0%), whereas the industries that tend to have a higher number of women are Information (100.0%), Educational Services (100.0%), and Professional & Scientific (56.5%).
| Industry | Male | Female |
| Agriculture, Fishing & Hunting | 0 (0.0%) | 0 (0.0%) |
| Mining, Quarrying, & Extraction | 81 (100.0%) | 0 (0.0%) |
| Construction | 19 (100.0%) | 0 (0.0%) |
| Manufacturing | 0 (0.0%) | 0 (0.0%) |
| Wholesale Trade | 0 (0.0%) | 0 (0.0%) |
| Retail Trade | 19 (45.2%) | 23 (54.8%) |
| Transportation & Warehousing | 0 (0.0%) | 0 (0.0%) |
| Utilities | 0 (0.0%) | 0 (0.0%) |
| Information | 0 (0.0%) | 21 (100.0%) |
| Finance & Insurance | 0 (0.0%) | 0 (0.0%) |
| Real Estate, Rental & Leasing | 0 (0.0%) | 0 (0.0%) |
| Professional & Scientific | 27 (43.5%) | 35 (56.5%) |
| Enterprise Management | 0 (0.0%) | 0 (0.0%) |
| Administrative & Support | 0 (0.0%) | 0 (0.0%) |
| Educational Services | 0 (0.0%) | 17 (100.0%) |
| Health Care & Social Assistance | 118 (100.0%) | 0 (0.0%) |
| Arts, Entertainment & Recreation | 0 (0.0%) | 0 (0.0%) |
| Accommodation & Food Services | 0 (0.0%) | 0 (0.0%) |
| Public Administration | 17 (100.0%) | 0 (0.0%) |
| Total | 281 (74.5%) | 96 (25.5%) |
Education in Osmond
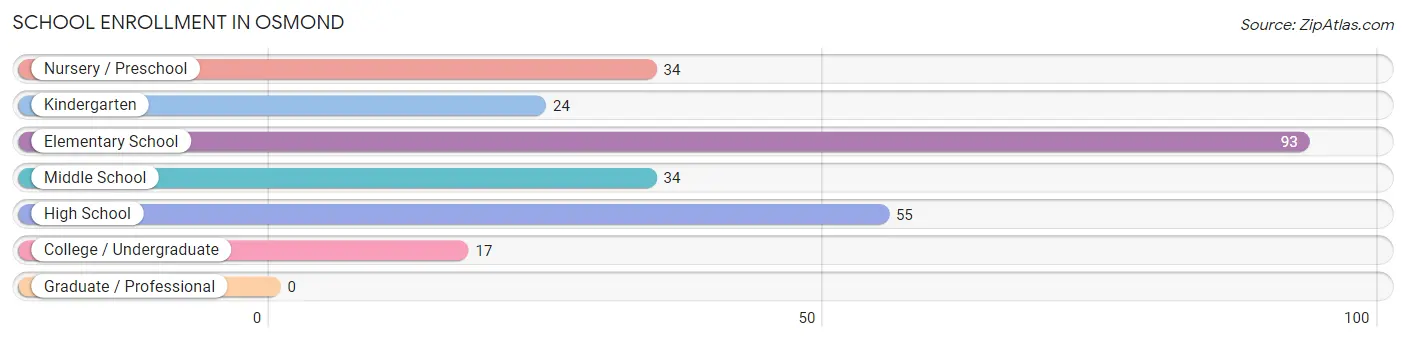
School Enrollment in Osmond
The most common levels of schooling among the 257 students in Osmond are elementary school (93 | 36.2%), high school (55 | 21.4%), and nursery / preschool (34 | 13.2%).
| School Level | # Students | % Students |
| Nursery / Preschool | 34 | 13.2% |
| Kindergarten | 24 | 9.3% |
| Elementary School | 93 | 36.2% |
| Middle School | 34 | 13.2% |
| High School | 55 | 21.4% |
| College / Undergraduate | 17 | 6.6% |
| Graduate / Professional | 0 | 0.0% |
| Total | 257 | 100.0% |
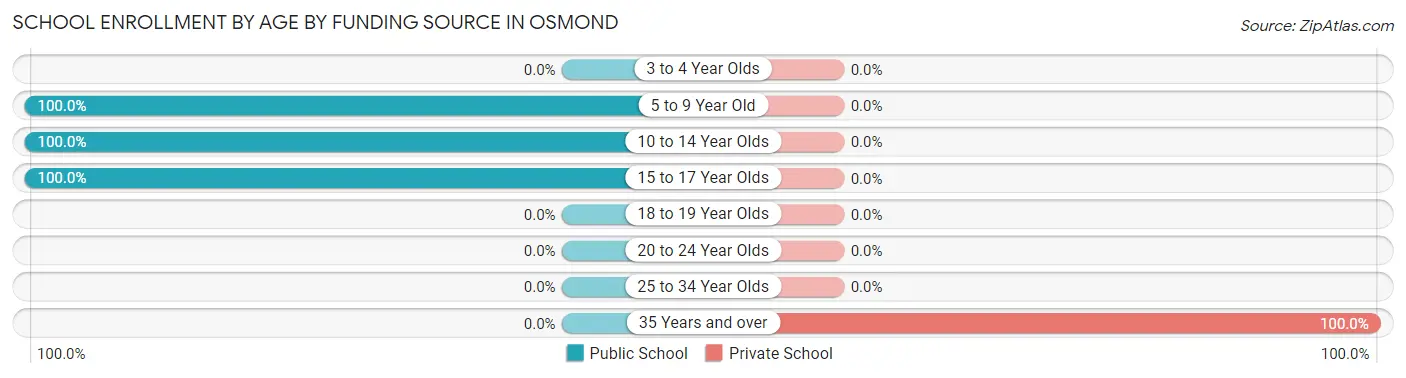
School Enrollment by Age by Funding Source in Osmond
Out of a total of 257 students who are enrolled in schools in Osmond, 17 (6.6%) attend a private institution, while the remaining 240 (93.4%) are enrolled in public schools. The age group of 35 years and over has the highest likelihood of being enrolled in private schools, with 17 (100.0% in the age bracket) enrolled. Conversely, the age group of 5 to 9 year old has the lowest likelihood of being enrolled in a private school, with 126 (100.0% in the age bracket) attending a public institution.
| Age Bracket | Public School | Private School |
| 3 to 4 Year Olds | 0 (0.0%) | 0 (0.0%) |
| 5 to 9 Year Old | 126 (100.0%) | 0 (0.0%) |
| 10 to 14 Year Olds | 59 (100.0%) | 0 (0.0%) |
| 15 to 17 Year Olds | 55 (100.0%) | 0 (0.0%) |
| 18 to 19 Year Olds | 0 (0.0%) | 0 (0.0%) |
| 20 to 24 Year Olds | 0 (0.0%) | 0 (0.0%) |
| 25 to 34 Year Olds | 0 (0.0%) | 0 (0.0%) |
| 35 Years and over | 0 (0.0%) | 17 (100.0%) |
| Total | 240 (93.4%) | 17 (6.6%) |
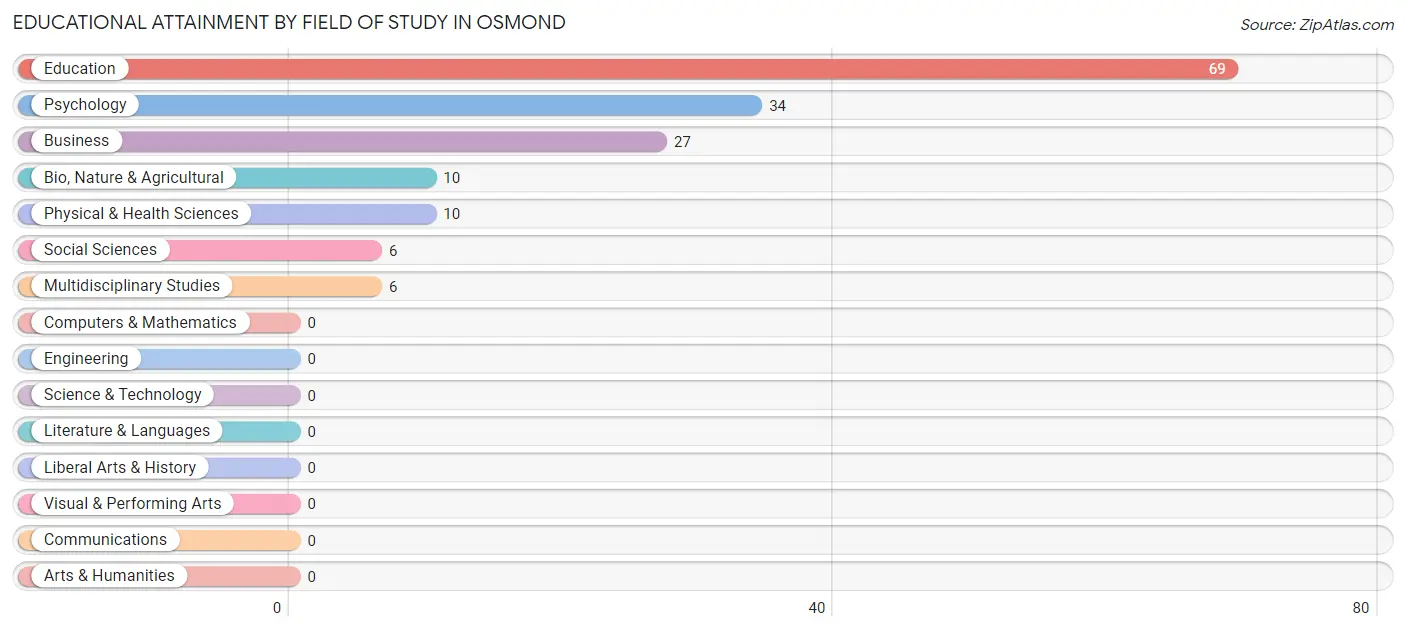
Educational Attainment by Field of Study in Osmond
Education (69 | 42.6%), psychology (34 | 21.0%), business (27 | 16.7%), bio, nature & agricultural (10 | 6.2%), and physical & health sciences (10 | 6.2%) are the most common fields of study among 162 individuals in Osmond who have obtained a bachelor's degree or higher.
| Field of Study | # Graduates | % Graduates |
| Computers & Mathematics | 0 | 0.0% |
| Bio, Nature & Agricultural | 10 | 6.2% |
| Physical & Health Sciences | 10 | 6.2% |
| Psychology | 34 | 21.0% |
| Social Sciences | 6 | 3.7% |
| Engineering | 0 | 0.0% |
| Multidisciplinary Studies | 6 | 3.7% |
| Science & Technology | 0 | 0.0% |
| Business | 27 | 16.7% |
| Education | 69 | 42.6% |
| Literature & Languages | 0 | 0.0% |
| Liberal Arts & History | 0 | 0.0% |
| Visual & Performing Arts | 0 | 0.0% |
| Communications | 0 | 0.0% |
| Arts & Humanities | 0 | 0.0% |
| Total | 162 | 100.0% |
Transportation & Commute in Osmond
Vehicle Availability by Sex in Osmond
The most prevalent vehicle ownership categories in Osmond are males with 5 or more vehicles (101, accounting for 35.9%) and females with 5 or more vehicles (35, making up 174.1%).
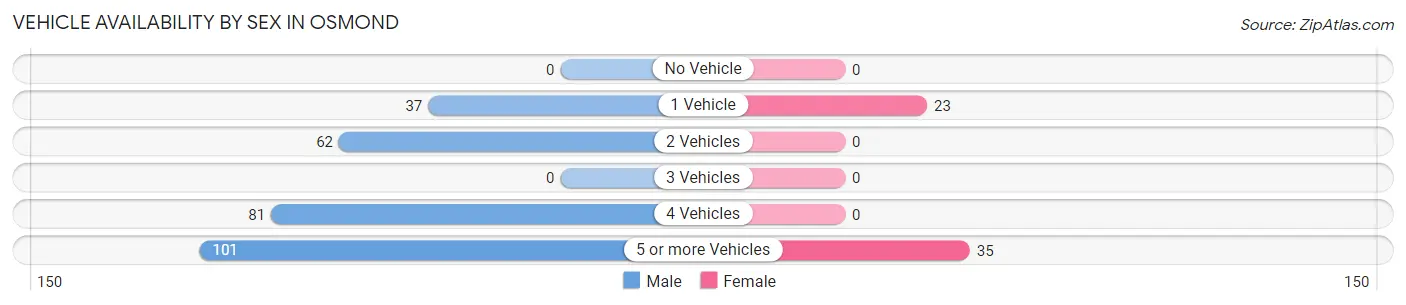
| Vehicles Available | Male | Female |
| No Vehicle | 0 (0.0%) | 0 (0.0%) |
| 1 Vehicle | 37 (13.2%) | 23 (39.7%) |
| 2 Vehicles | 62 (22.1%) | 0 (0.0%) |
| 3 Vehicles | 0 (0.0%) | 0 (0.0%) |
| 4 Vehicles | 81 (28.8%) | 0 (0.0%) |
| 5 or more Vehicles | 101 (35.9%) | 35 (60.3%) |
| Total | 281 (100.0%) | 58 (100.0%) |
Commute Time in Osmond
The most frequently occuring commute durations in Osmond are 10 to 14 minutes (136 commuters, 42.4%), 25 to 29 minutes (81 commuters, 25.2%), and 5 to 9 minutes (71 commuters, 22.1%).
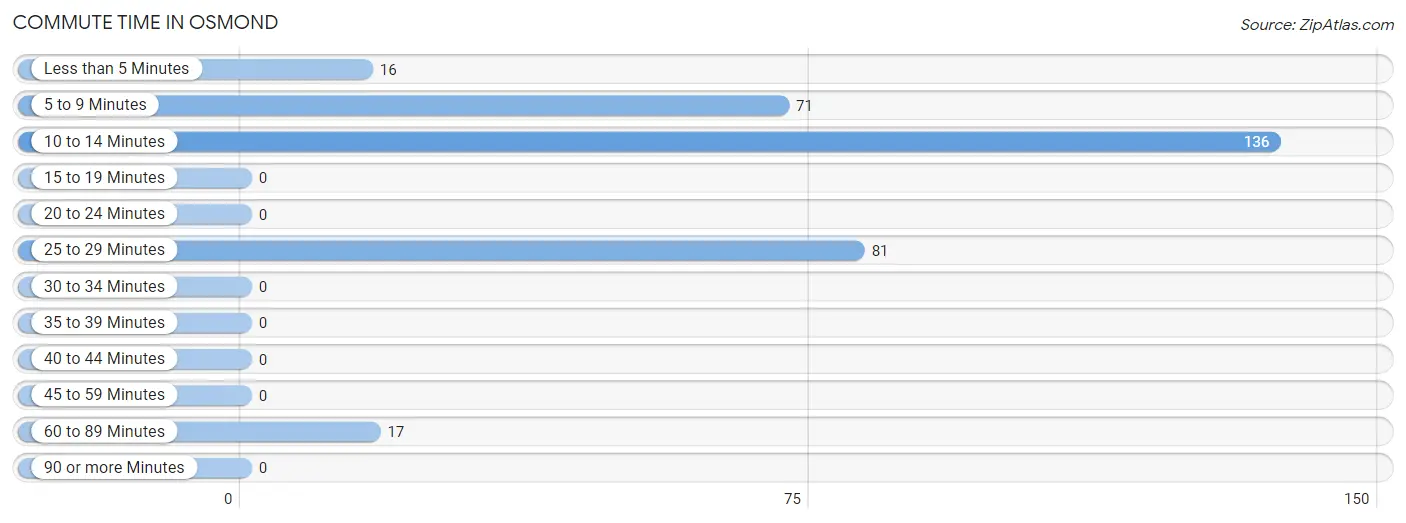
| Commute Time | # Commuters | % Commuters |
| Less than 5 Minutes | 16 | 5.0% |
| 5 to 9 Minutes | 71 | 22.1% |
| 10 to 14 Minutes | 136 | 42.4% |
| 15 to 19 Minutes | 0 | 0.0% |
| 20 to 24 Minutes | 0 | 0.0% |
| 25 to 29 Minutes | 81 | 25.2% |
| 30 to 34 Minutes | 0 | 0.0% |
| 35 to 39 Minutes | 0 | 0.0% |
| 40 to 44 Minutes | 0 | 0.0% |
| 45 to 59 Minutes | 0 | 0.0% |
| 60 to 89 Minutes | 17 | 5.3% |
| 90 or more Minutes | 0 | 0.0% |
Commute Time by Sex in Osmond
The most common commute times in Osmond are 10 to 14 minutes (101 commuters, 38.4%) for males and 10 to 14 minutes (35 commuters, 60.3%) for females.
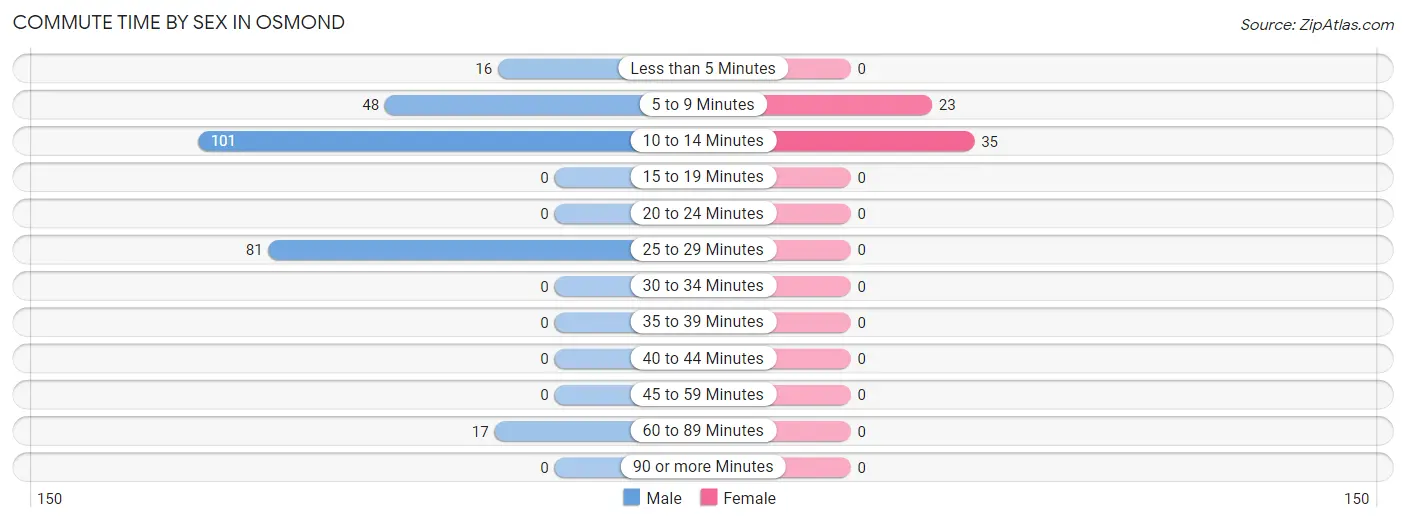
| Commute Time | Male | Female |
| Less than 5 Minutes | 16 (6.1%) | 0 (0.0%) |
| 5 to 9 Minutes | 48 (18.2%) | 23 (39.7%) |
| 10 to 14 Minutes | 101 (38.4%) | 35 (60.3%) |
| 15 to 19 Minutes | 0 (0.0%) | 0 (0.0%) |
| 20 to 24 Minutes | 0 (0.0%) | 0 (0.0%) |
| 25 to 29 Minutes | 81 (30.8%) | 0 (0.0%) |
| 30 to 34 Minutes | 0 (0.0%) | 0 (0.0%) |
| 35 to 39 Minutes | 0 (0.0%) | 0 (0.0%) |
| 40 to 44 Minutes | 0 (0.0%) | 0 (0.0%) |
| 45 to 59 Minutes | 0 (0.0%) | 0 (0.0%) |
| 60 to 89 Minutes | 17 (6.5%) | 0 (0.0%) |
| 90 or more Minutes | 0 (0.0%) | 0 (0.0%) |
Time of Departure to Work by Sex in Osmond
The most frequent times of departure to work in Osmond are 12:00 AM to 4:59 AM (117, 44.5%) for males and 9:00 AM to 9:59 AM (35, 60.3%) for females.
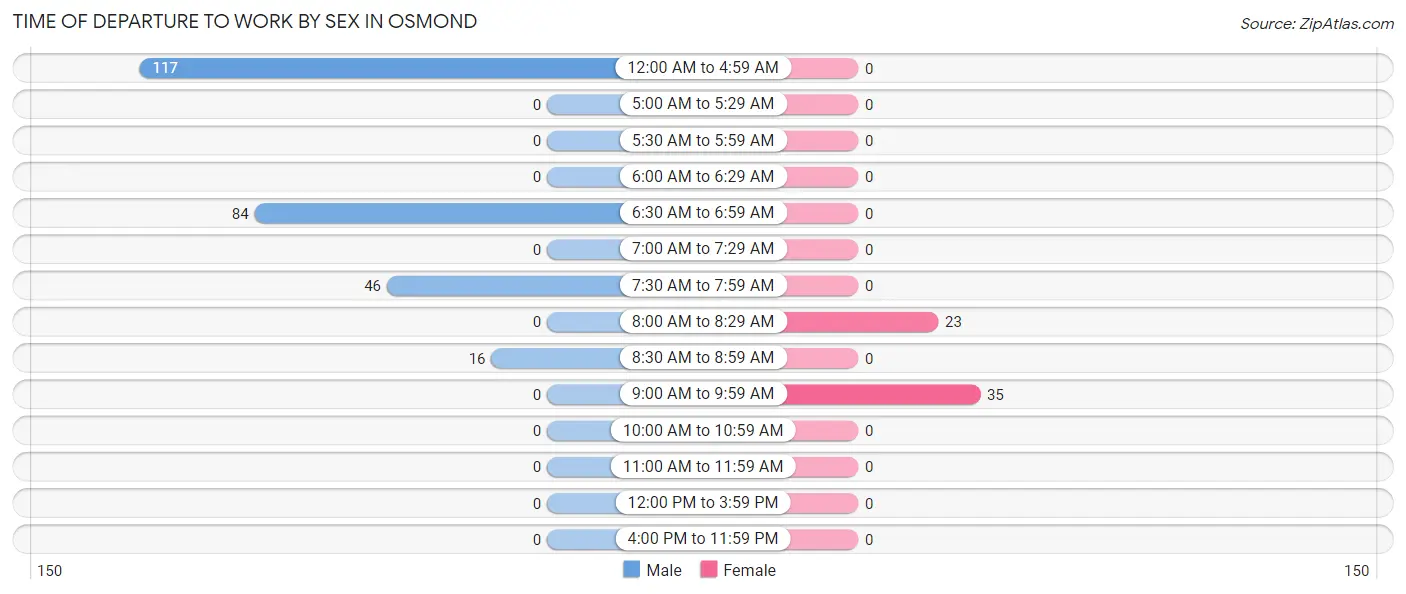
| Time of Departure | Male | Female |
| 12:00 AM to 4:59 AM | 117 (44.5%) | 0 (0.0%) |
| 5:00 AM to 5:29 AM | 0 (0.0%) | 0 (0.0%) |
| 5:30 AM to 5:59 AM | 0 (0.0%) | 0 (0.0%) |
| 6:00 AM to 6:29 AM | 0 (0.0%) | 0 (0.0%) |
| 6:30 AM to 6:59 AM | 84 (31.9%) | 0 (0.0%) |
| 7:00 AM to 7:29 AM | 0 (0.0%) | 0 (0.0%) |
| 7:30 AM to 7:59 AM | 46 (17.5%) | 0 (0.0%) |
| 8:00 AM to 8:29 AM | 0 (0.0%) | 23 (39.7%) |
| 8:30 AM to 8:59 AM | 16 (6.1%) | 0 (0.0%) |
| 9:00 AM to 9:59 AM | 0 (0.0%) | 35 (60.3%) |
| 10:00 AM to 10:59 AM | 0 (0.0%) | 0 (0.0%) |
| 11:00 AM to 11:59 AM | 0 (0.0%) | 0 (0.0%) |
| 12:00 PM to 3:59 PM | 0 (0.0%) | 0 (0.0%) |
| 4:00 PM to 11:59 PM | 0 (0.0%) | 0 (0.0%) |
| Total | 263 (100.0%) | 58 (100.0%) |
Housing Occupancy in Osmond
Occupancy by Ownership in Osmond
Of the total 214 dwellings in Osmond, owner-occupied units account for 127 (59.4%), while renter-occupied units make up 87 (40.6%).
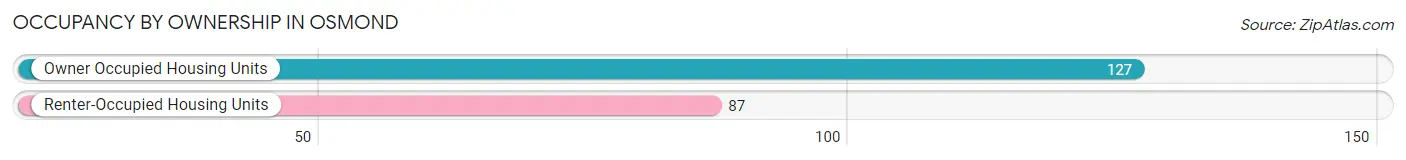
| Occupancy | # Housing Units | % Housing Units |
| Owner Occupied Housing Units | 127 | 59.4% |
| Renter-Occupied Housing Units | 87 | 40.6% |
| Total Occupied Housing Units | 214 | 100.0% |
Occupancy by Household Size in Osmond
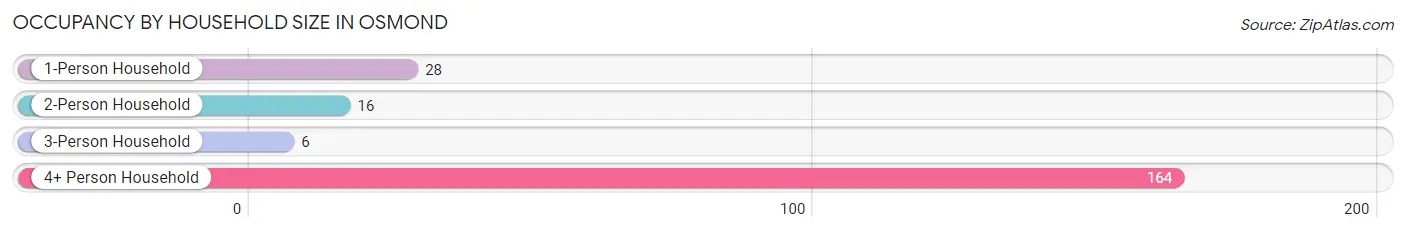
| Household Size | # Housing Units | % Housing Units |
| 1-Person Household | 28 | 13.1% |
| 2-Person Household | 16 | 7.5% |
| 3-Person Household | 6 | 2.8% |
| 4+ Person Household | 164 | 76.6% |
| Total Housing Units | 214 | 100.0% |
Occupancy by Ownership by Household Size in Osmond
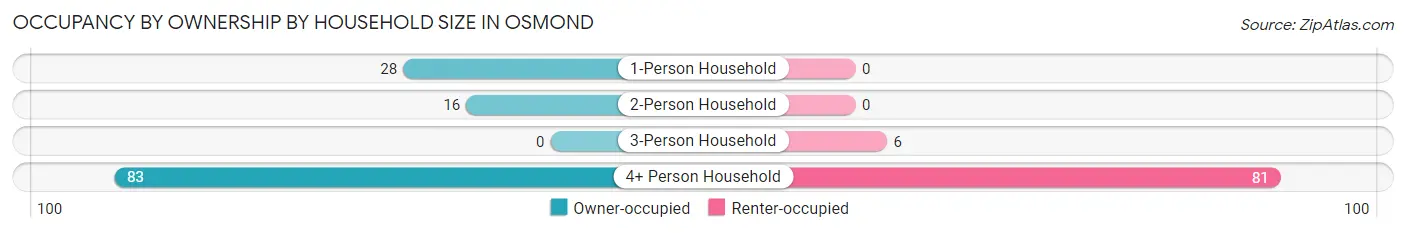
| Household Size | Owner-occupied | Renter-occupied |
| 1-Person Household | 28 (100.0%) | 0 (0.0%) |
| 2-Person Household | 16 (100.0%) | 0 (0.0%) |
| 3-Person Household | 0 (0.0%) | 6 (100.0%) |
| 4+ Person Household | 83 (50.6%) | 81 (49.4%) |
| Total Housing Units | 127 (59.4%) | 87 (40.6%) |
Occupancy by Educational Attainment in Osmond
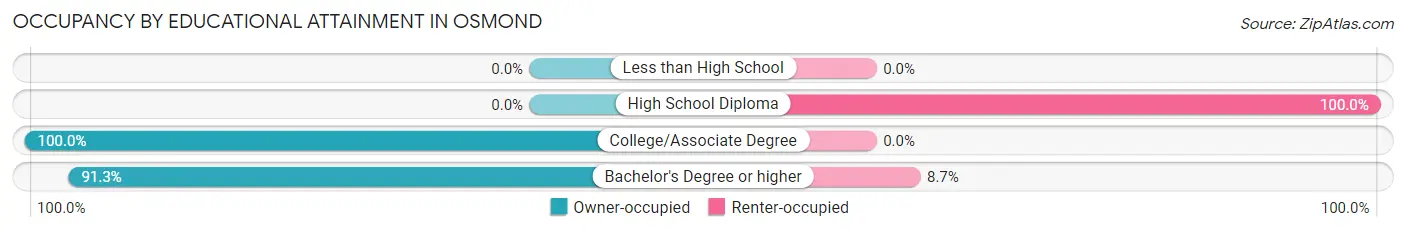
| Household Size | Owner-occupied | Renter-occupied |
| Less than High School | 0 (0.0%) | 0 (0.0%) |
| High School Diploma | 0 (0.0%) | 81 (100.0%) |
| College/Associate Degree | 64 (100.0%) | 0 (0.0%) |
| Bachelor's Degree or higher | 63 (91.3%) | 6 (8.7%) |
Occupancy by Age of Householder in Osmond
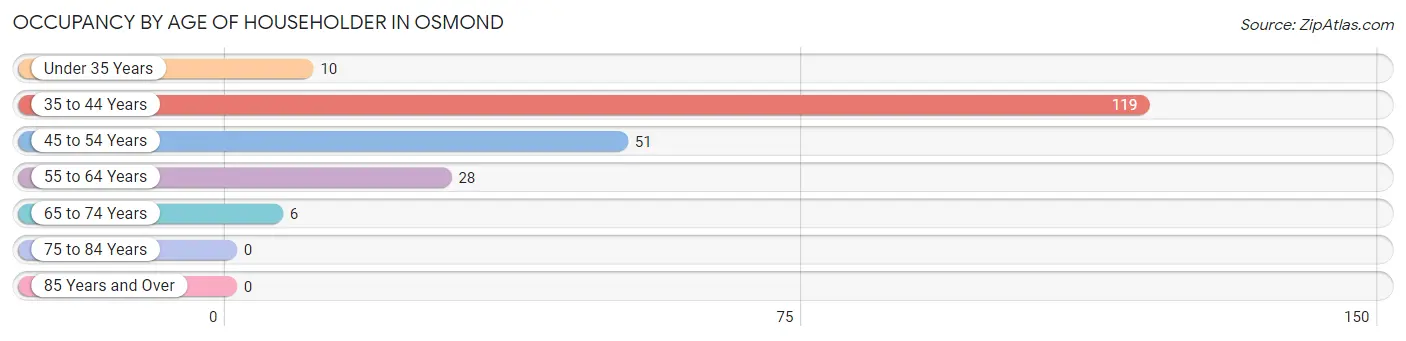
| Age Bracket | # Households | % Households |
| Under 35 Years | 10 | 4.7% |
| 35 to 44 Years | 119 | 55.6% |
| 45 to 54 Years | 51 | 23.8% |
| 55 to 64 Years | 28 | 13.1% |
| 65 to 74 Years | 6 | 2.8% |
| 75 to 84 Years | 0 | 0.0% |
| 85 Years and Over | 0 | 0.0% |
| Total | 214 | 100.0% |
Housing Finances in Osmond
Median Income by Occupancy in Osmond
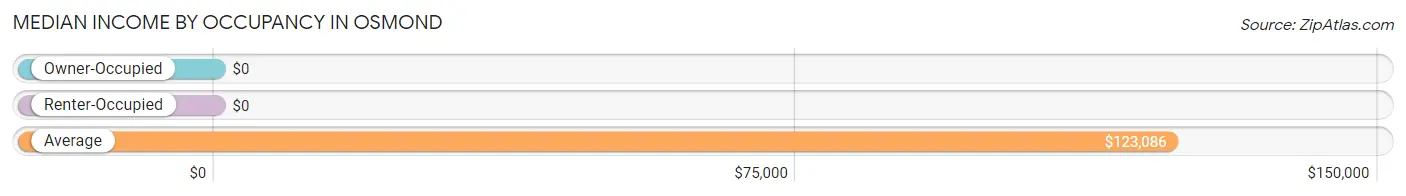
| Occupancy Type | # Households | Median Income |
| Owner-Occupied | 127 (59.4%) | $0 |
| Renter-Occupied | 87 (40.6%) | $0 |
| Average | 214 (100.0%) | $123,086 |
Occupancy by Householder Income Bracket in Osmond
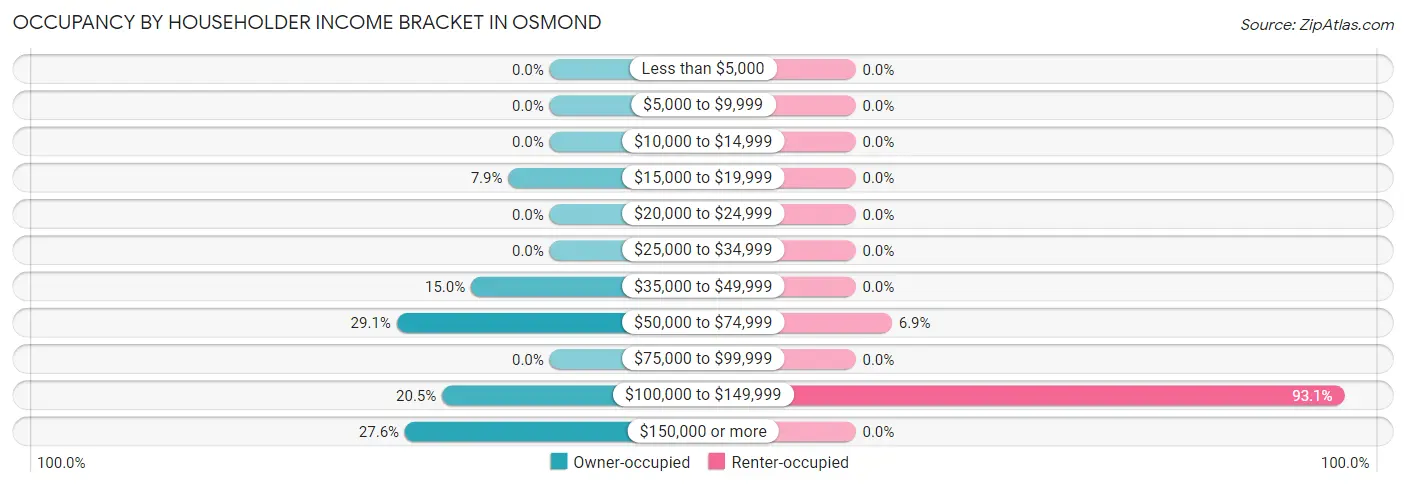
| Income Bracket | Owner-occupied | Renter-occupied |
| Less than $5,000 | 0 (0.0%) | 0 (0.0%) |
| $5,000 to $9,999 | 0 (0.0%) | 0 (0.0%) |
| $10,000 to $14,999 | 0 (0.0%) | 0 (0.0%) |
| $15,000 to $19,999 | 10 (7.9%) | 0 (0.0%) |
| $20,000 to $24,999 | 0 (0.0%) | 0 (0.0%) |
| $25,000 to $34,999 | 0 (0.0%) | 0 (0.0%) |
| $35,000 to $49,999 | 19 (15.0%) | 0 (0.0%) |
| $50,000 to $74,999 | 37 (29.1%) | 6 (6.9%) |
| $75,000 to $99,999 | 0 (0.0%) | 0 (0.0%) |
| $100,000 to $149,999 | 26 (20.5%) | 81 (93.1%) |
| $150,000 or more | 35 (27.6%) | 0 (0.0%) |
| Total | 127 (100.0%) | 87 (100.0%) |
Monthly Housing Cost Tiers in Osmond
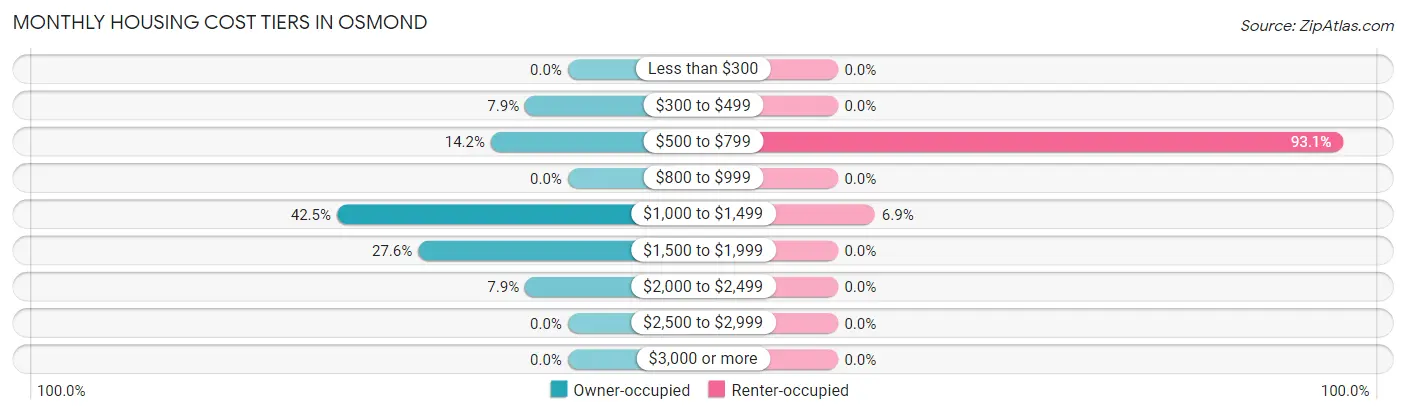
| Monthly Cost | Owner-occupied | Renter-occupied |
| Less than $300 | 0 (0.0%) | 0 (0.0%) |
| $300 to $499 | 10 (7.9%) | 0 (0.0%) |
| $500 to $799 | 18 (14.2%) | 81 (93.1%) |
| $800 to $999 | 0 (0.0%) | 0 (0.0%) |
| $1,000 to $1,499 | 54 (42.5%) | 6 (6.9%) |
| $1,500 to $1,999 | 35 (27.6%) | 0 (0.0%) |
| $2,000 to $2,499 | 10 (7.9%) | 0 (0.0%) |
| $2,500 to $2,999 | 0 (0.0%) | 0 (0.0%) |
| $3,000 or more | 0 (0.0%) | 0 (0.0%) |
| Total | 127 (100.0%) | 87 (100.0%) |
Physical Housing Characteristics in Osmond
Housing Structures in Osmond
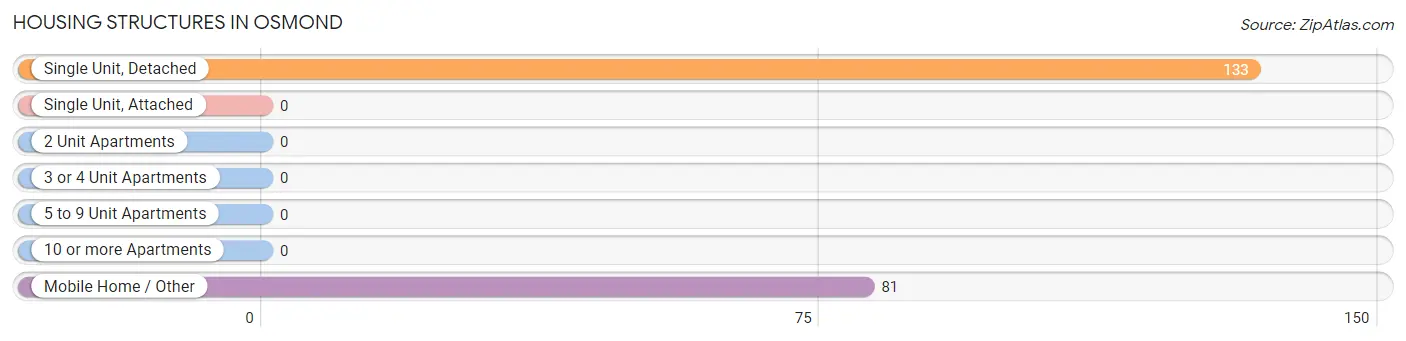
| Structure Type | # Housing Units | % Housing Units |
| Single Unit, Detached | 133 | 62.2% |
| Single Unit, Attached | 0 | 0.0% |
| 2 Unit Apartments | 0 | 0.0% |
| 3 or 4 Unit Apartments | 0 | 0.0% |
| 5 to 9 Unit Apartments | 0 | 0.0% |
| 10 or more Apartments | 0 | 0.0% |
| Mobile Home / Other | 81 | 37.9% |
| Total | 214 | 100.0% |
Housing Structures by Occupancy in Osmond
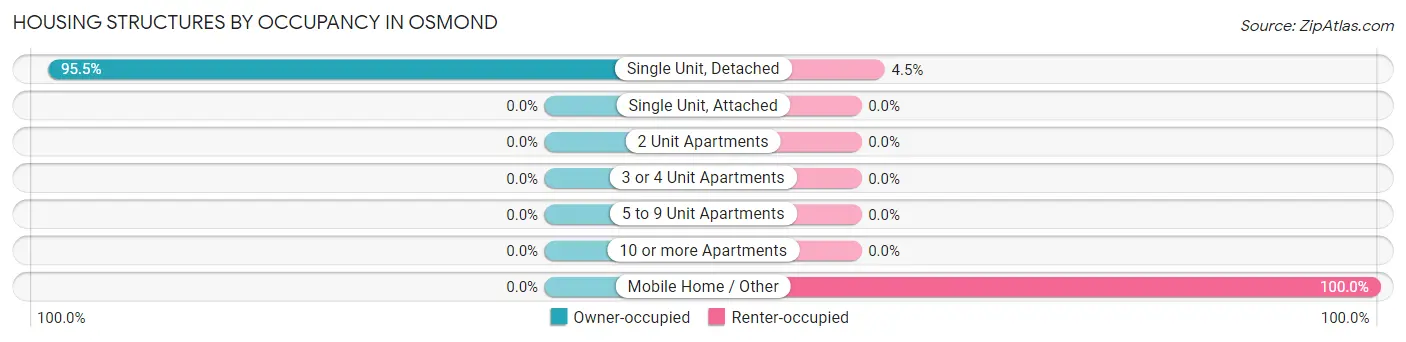
| Structure Type | Owner-occupied | Renter-occupied |
| Single Unit, Detached | 127 (95.5%) | 6 (4.5%) |
| Single Unit, Attached | 0 (0.0%) | 0 (0.0%) |
| 2 Unit Apartments | 0 (0.0%) | 0 (0.0%) |
| 3 or 4 Unit Apartments | 0 (0.0%) | 0 (0.0%) |
| 5 to 9 Unit Apartments | 0 (0.0%) | 0 (0.0%) |
| 10 or more Apartments | 0 (0.0%) | 0 (0.0%) |
| Mobile Home / Other | 0 (0.0%) | 81 (100.0%) |
| Total | 127 (59.4%) | 87 (40.6%) |
Housing Structures by Number of Rooms in Osmond
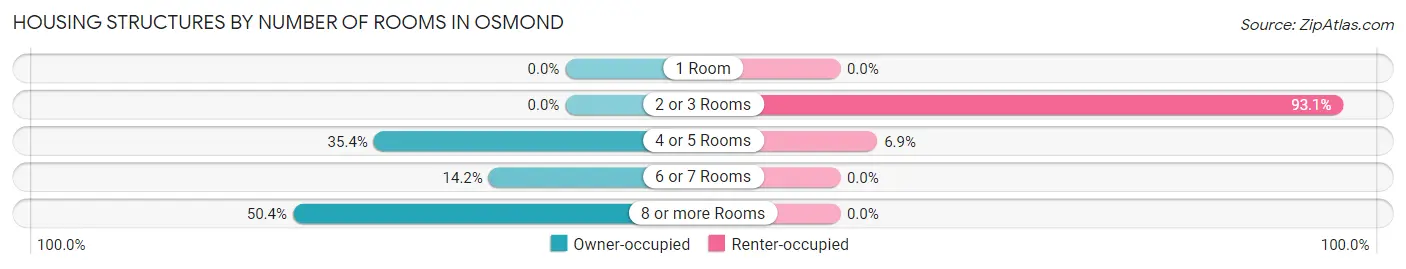
| Number of Rooms | Owner-occupied | Renter-occupied |
| 1 Room | 0 (0.0%) | 0 (0.0%) |
| 2 or 3 Rooms | 0 (0.0%) | 81 (93.1%) |
| 4 or 5 Rooms | 45 (35.4%) | 6 (6.9%) |
| 6 or 7 Rooms | 18 (14.2%) | 0 (0.0%) |
| 8 or more Rooms | 64 (50.4%) | 0 (0.0%) |
| Total | 127 (100.0%) | 87 (100.0%) |
Housing Structure by Heating Type in Osmond
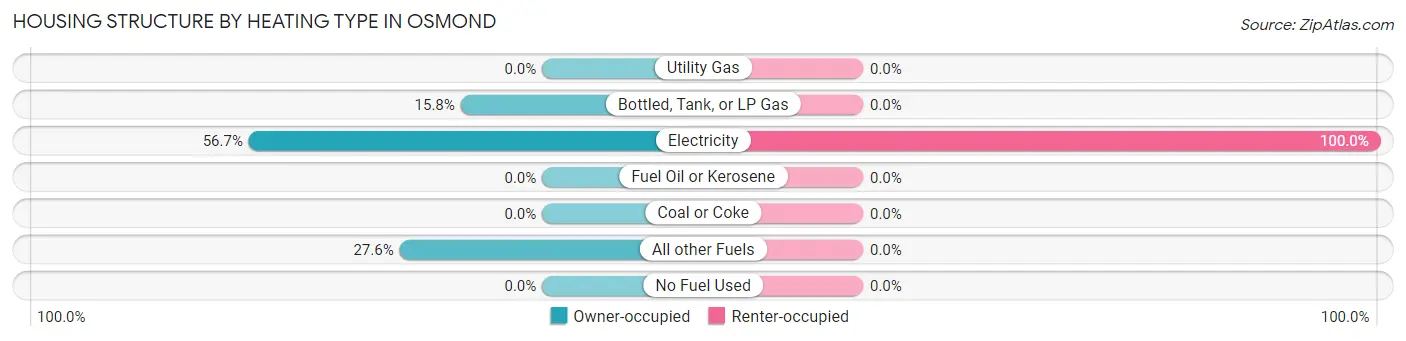
| Heating Type | Owner-occupied | Renter-occupied |
| Utility Gas | 0 (0.0%) | 0 (0.0%) |
| Bottled, Tank, or LP Gas | 20 (15.8%) | 0 (0.0%) |
| Electricity | 72 (56.7%) | 87 (100.0%) |
| Fuel Oil or Kerosene | 0 (0.0%) | 0 (0.0%) |
| Coal or Coke | 0 (0.0%) | 0 (0.0%) |
| All other Fuels | 35 (27.6%) | 0 (0.0%) |
| No Fuel Used | 0 (0.0%) | 0 (0.0%) |
| Total | 127 (100.0%) | 87 (100.0%) |
Household Vehicle Usage in Osmond
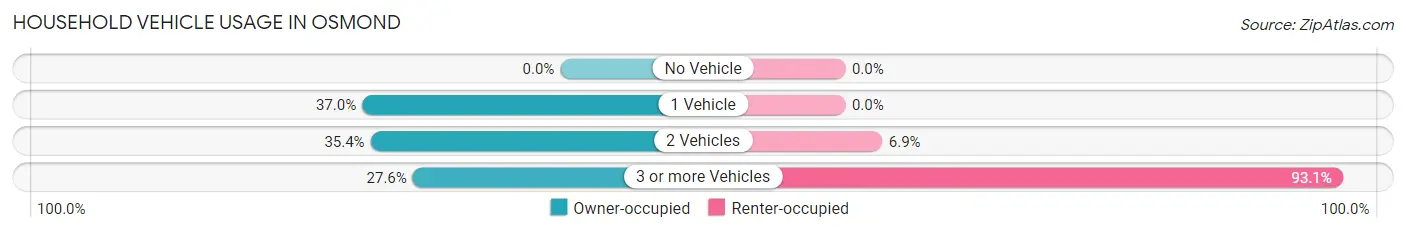
| Vehicles per Household | Owner-occupied | Renter-occupied |
| No Vehicle | 0 (0.0%) | 0 (0.0%) |
| 1 Vehicle | 47 (37.0%) | 0 (0.0%) |
| 2 Vehicles | 45 (35.4%) | 6 (6.9%) |
| 3 or more Vehicles | 35 (27.6%) | 81 (93.1%) |
| Total | 127 (100.0%) | 87 (100.0%) |
Real Estate & Mortgages in Osmond
Real Estate and Mortgage Overview in Osmond
| Characteristic | Without Mortgage | With Mortgage |
| Housing Units | 10 | 117 |
| Median Property Value | - | - |
| Median Household Income | - | - |
| Monthly Housing Costs | - | - |
| Real Estate Taxes | - | - |
Property Value by Mortgage Status in Osmond
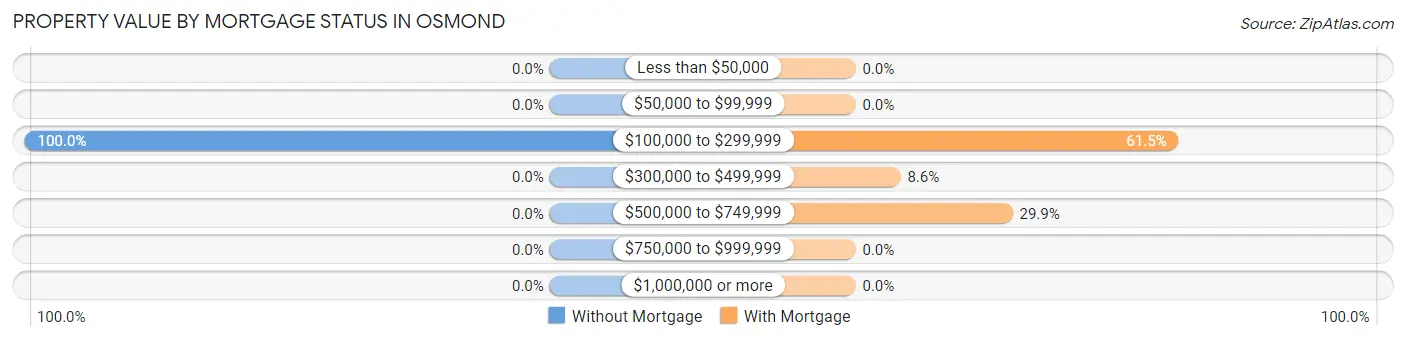
| Property Value | Without Mortgage | With Mortgage |
| Less than $50,000 | 0 (0.0%) | 0 (0.0%) |
| $50,000 to $99,999 | 0 (0.0%) | 0 (0.0%) |
| $100,000 to $299,999 | 10 (100.0%) | 72 (61.5%) |
| $300,000 to $499,999 | 0 (0.0%) | 10 (8.6%) |
| $500,000 to $749,999 | 0 (0.0%) | 35 (29.9%) |
| $750,000 to $999,999 | 0 (0.0%) | 0 (0.0%) |
| $1,000,000 or more | 0 (0.0%) | 0 (0.0%) |
| Total | 10 (100.0%) | 117 (100.0%) |
Household Income by Mortgage Status in Osmond
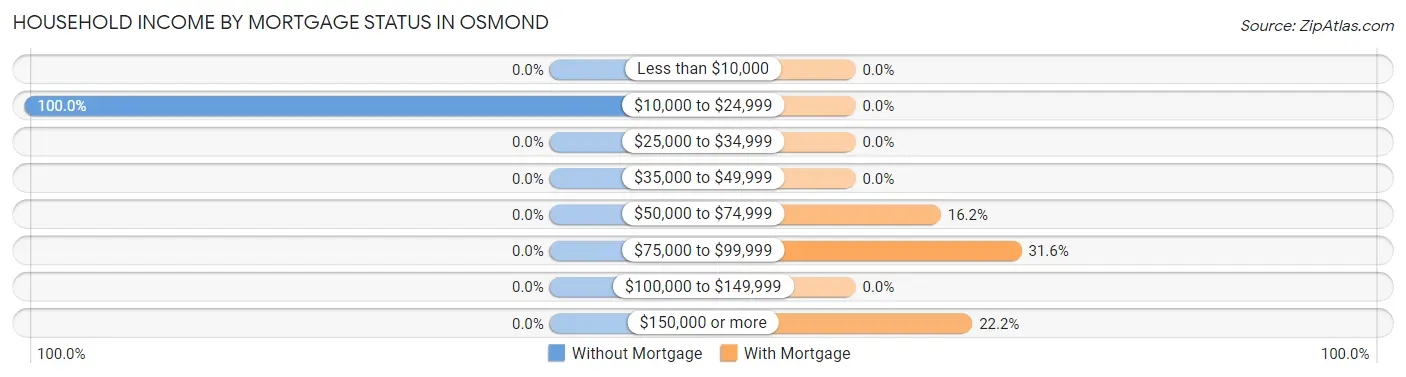
| Household Income | Without Mortgage | With Mortgage |
| Less than $10,000 | 0 (0.0%) | 0 (0.0%) |
| $10,000 to $24,999 | 10 (100.0%) | 0 (0.0%) |
| $25,000 to $34,999 | 0 (0.0%) | 0 (0.0%) |
| $35,000 to $49,999 | 0 (0.0%) | 0 (0.0%) |
| $50,000 to $74,999 | 0 (0.0%) | 19 (16.2%) |
| $75,000 to $99,999 | 0 (0.0%) | 37 (31.6%) |
| $100,000 to $149,999 | 0 (0.0%) | 0 (0.0%) |
| $150,000 or more | 0 (0.0%) | 26 (22.2%) |
| Total | 10 (100.0%) | 117 (100.0%) |
Property Value to Household Income Ratio in Osmond
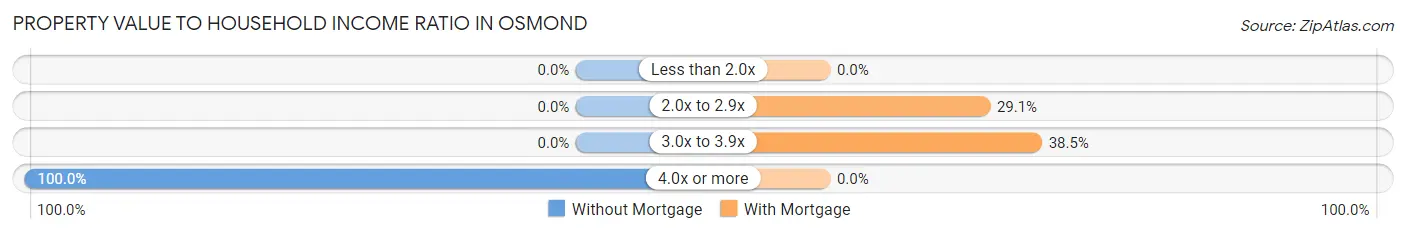
| Value-to-Income Ratio | Without Mortgage | With Mortgage |
| Less than 2.0x | 0 (0.0%) | 0 (0.0%) |
| 2.0x to 2.9x | 0 (0.0%) | 34 (29.1%) |
| 3.0x to 3.9x | 0 (0.0%) | 45 (38.5%) |
| 4.0x or more | 10 (100.0%) | 0 (0.0%) |
| Total | 10 (100.0%) | 117 (100.0%) |
Real Estate Taxes by Mortgage Status in Osmond
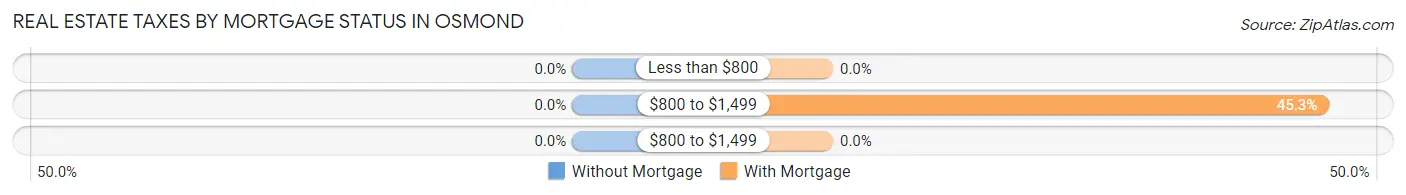
| Property Taxes | Without Mortgage | With Mortgage |
| Less than $800 | 0 (0.0%) | 0 (0.0%) |
| $800 to $1,499 | 0 (0.0%) | 53 (45.3%) |
| $800 to $1,499 | 0 (0.0%) | 0 (0.0%) |
| Total | 10 (100.0%) | 117 (100.0%) |
Health & Disability in Osmond
Health Insurance Coverage by Age in Osmond
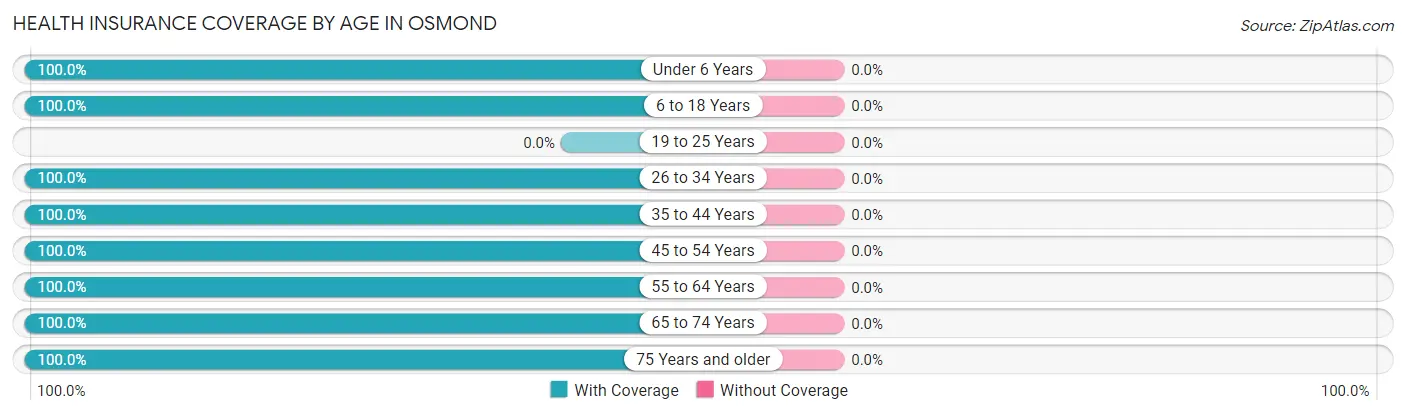
| Age Bracket | With Coverage | Without Coverage |
| Under 6 Years | 197 (100.0%) | 0 (0.0%) |
| 6 to 18 Years | 191 (100.0%) | 0 (0.0%) |
| 19 to 25 Years | 0 (0.0%) | 0 (0.0%) |
| 26 to 34 Years | 124 (100.0%) | 0 (0.0%) |
| 35 to 44 Years | 176 (100.0%) | 0 (0.0%) |
| 45 to 54 Years | 99 (100.0%) | 0 (0.0%) |
| 55 to 64 Years | 28 (100.0%) | 0 (0.0%) |
| 65 to 74 Years | 6 (100.0%) | 0 (0.0%) |
| 75 Years and older | 5 (100.0%) | 0 (0.0%) |
| Total | 826 (100.0%) | 0 (0.0%) |
Health Insurance Coverage by Citizenship Status in Osmond
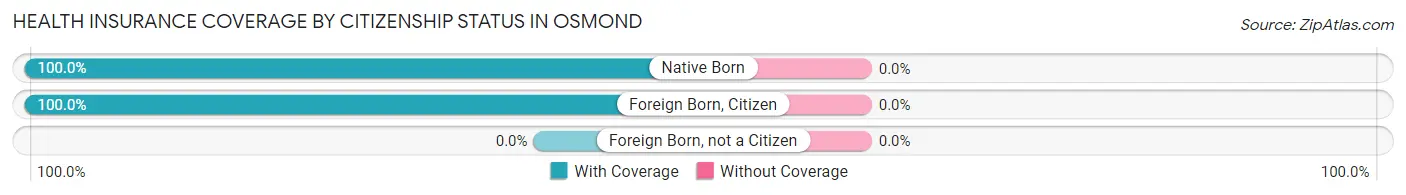
| Citizenship Status | With Coverage | Without Coverage |
| Native Born | 197 (100.0%) | 0 (0.0%) |
| Foreign Born, Citizen | 191 (100.0%) | 0 (0.0%) |
| Foreign Born, not a Citizen | 0 (0.0%) | 0 (0.0%) |
Health Insurance Coverage by Household Income in Osmond
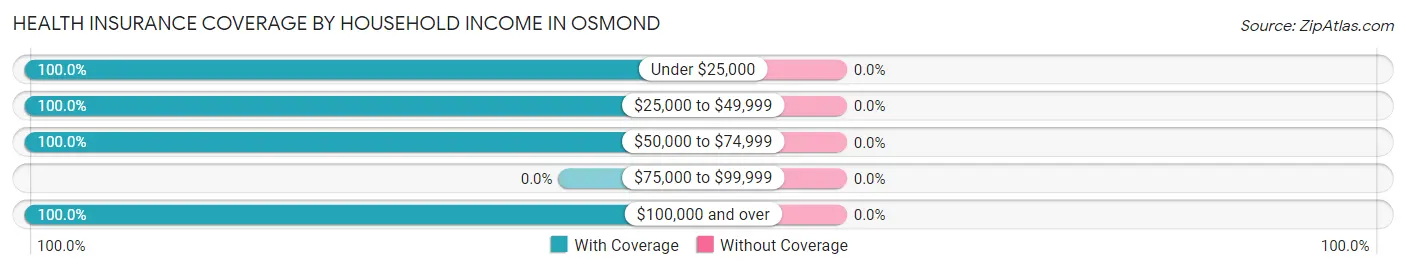
| Household Income | With Coverage | Without Coverage |
| Under $25,000 | 10 (100.0%) | 0 (0.0%) |
| $25,000 to $49,999 | 121 (100.0%) | 0 (0.0%) |
| $50,000 to $74,999 | 244 (100.0%) | 0 (0.0%) |
| $75,000 to $99,999 | 0 (0.0%) | 0 (0.0%) |
| $100,000 and over | 451 (100.0%) | 0 (0.0%) |
Public vs Private Health Insurance Coverage by Age in Osmond
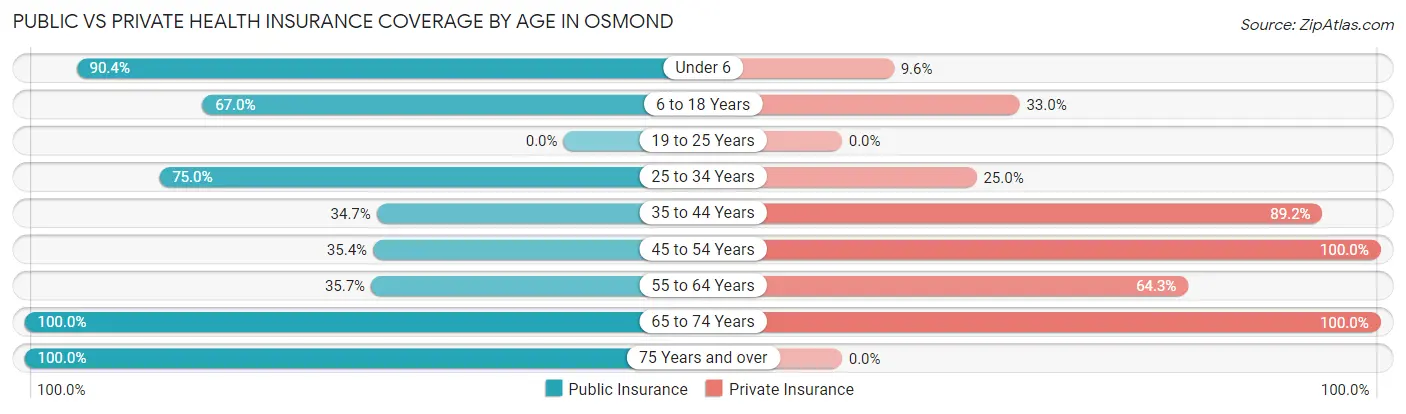
| Age Bracket | Public Insurance | Private Insurance |
| Under 6 | 178 (90.4%) | 19 (9.6%) |
| 6 to 18 Years | 128 (67.0%) | 63 (33.0%) |
| 19 to 25 Years | 0 (0.0%) | 0 (0.0%) |
| 25 to 34 Years | 93 (75.0%) | 31 (25.0%) |
| 35 to 44 Years | 61 (34.7%) | 157 (89.2%) |
| 45 to 54 Years | 35 (35.3%) | 99 (100.0%) |
| 55 to 64 Years | 10 (35.7%) | 18 (64.3%) |
| 65 to 74 Years | 6 (100.0%) | 6 (100.0%) |
| 75 Years and over | 5 (100.0%) | 0 (0.0%) |
| Total | 516 (62.5%) | 393 (47.6%) |
Disability Status by Sex by Age in Osmond
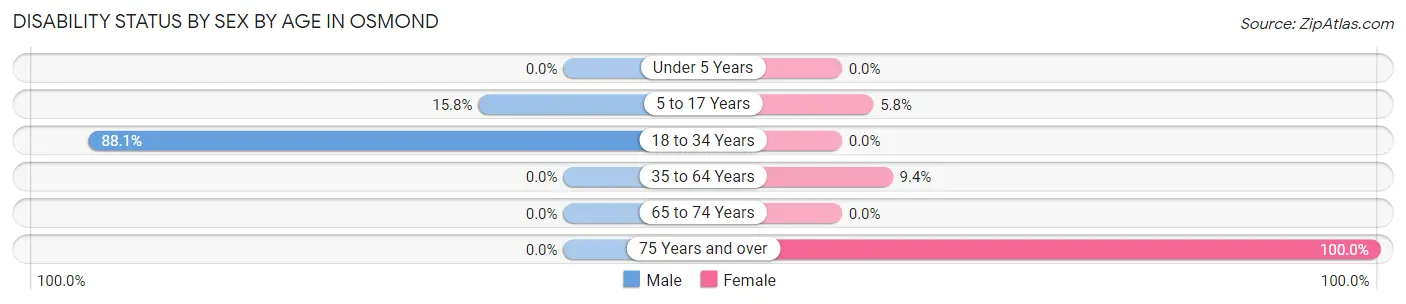
| Age Bracket | Male | Female |
| Under 5 Years | 0 (0.0%) | 0 (0.0%) |
| 5 to 17 Years | 15 (15.8%) | 9 (5.8%) |
| 18 to 34 Years | 74 (88.1%) | 0 (0.0%) |
| 35 to 64 Years | 0 (0.0%) | 10 (9.4%) |
| 65 to 74 Years | 0 (0.0%) | 0 (0.0%) |
| 75 Years and over | 0 (0.0%) | 5 (100.0%) |
Disability Class by Sex by Age in Osmond
Disability Class: Hearing Difficulty
| Age Bracket | Male | Female |
| Under 5 Years | 0 (0.0%) | 0 (0.0%) |
| 5 to 17 Years | 0 (0.0%) | 0 (0.0%) |
| 18 to 34 Years | 0 (0.0%) | 0 (0.0%) |
| 35 to 64 Years | 0 (0.0%) | 0 (0.0%) |
| 65 to 74 Years | 0 (0.0%) | 0 (0.0%) |
| 75 Years and over | 0 (0.0%) | 0 (0.0%) |
Disability Class: Vision Difficulty
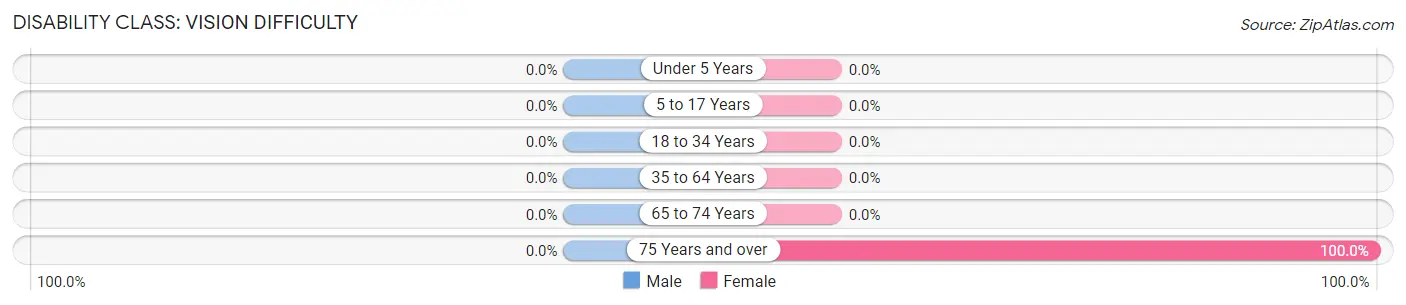
| Age Bracket | Male | Female |
| Under 5 Years | 0 (0.0%) | 0 (0.0%) |
| 5 to 17 Years | 0 (0.0%) | 0 (0.0%) |
| 18 to 34 Years | 0 (0.0%) | 0 (0.0%) |
| 35 to 64 Years | 0 (0.0%) | 0 (0.0%) |
| 65 to 74 Years | 0 (0.0%) | 0 (0.0%) |
| 75 Years and over | 0 (0.0%) | 5 (100.0%) |
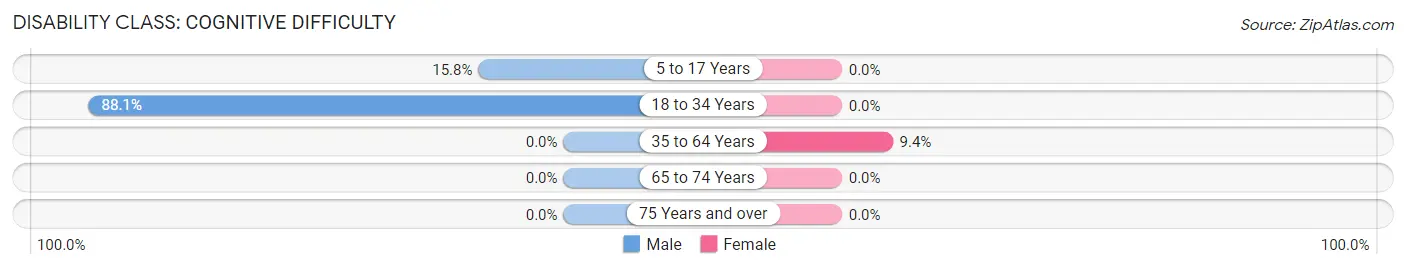
Disability Class: Cognitive Difficulty
| Age Bracket | Male | Female |
| 5 to 17 Years | 15 (15.8%) | 0 (0.0%) |
| 18 to 34 Years | 74 (88.1%) | 0 (0.0%) |
| 35 to 64 Years | 0 (0.0%) | 10 (9.4%) |
| 65 to 74 Years | 0 (0.0%) | 0 (0.0%) |
| 75 Years and over | 0 (0.0%) | 0 (0.0%) |
Disability Class: Ambulatory Difficulty
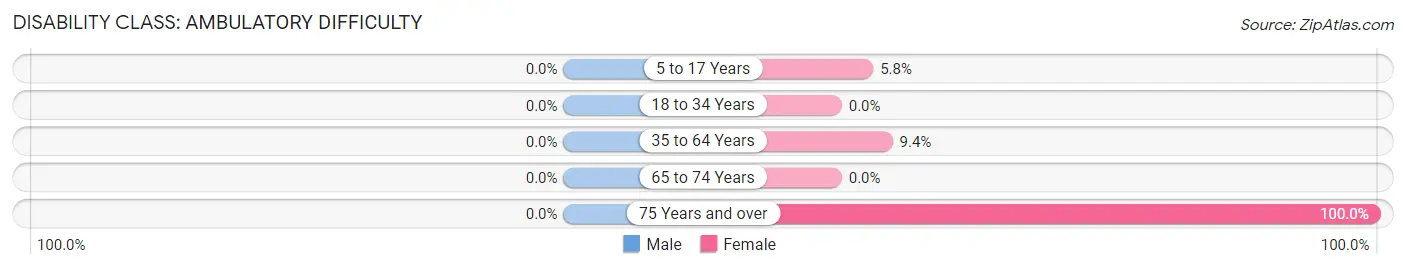
| Age Bracket | Male | Female |
| 5 to 17 Years | 0 (0.0%) | 9 (5.8%) |
| 18 to 34 Years | 0 (0.0%) | 0 (0.0%) |
| 35 to 64 Years | 0 (0.0%) | 10 (9.4%) |
| 65 to 74 Years | 0 (0.0%) | 0 (0.0%) |
| 75 Years and over | 0 (0.0%) | 5 (100.0%) |
Disability Class: Self-Care Difficulty
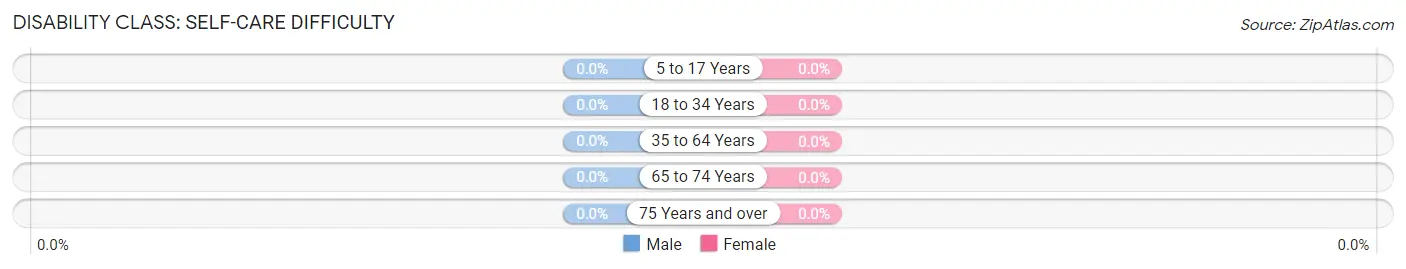
| Age Bracket | Male | Female |
| 5 to 17 Years | 0 (0.0%) | 0 (0.0%) |
| 18 to 34 Years | 0 (0.0%) | 0 (0.0%) |
| 35 to 64 Years | 0 (0.0%) | 0 (0.0%) |
| 65 to 74 Years | 0 (0.0%) | 0 (0.0%) |
| 75 Years and over | 0 (0.0%) | 0 (0.0%) |
Technology Access in Osmond
Computing Device Access in Osmond
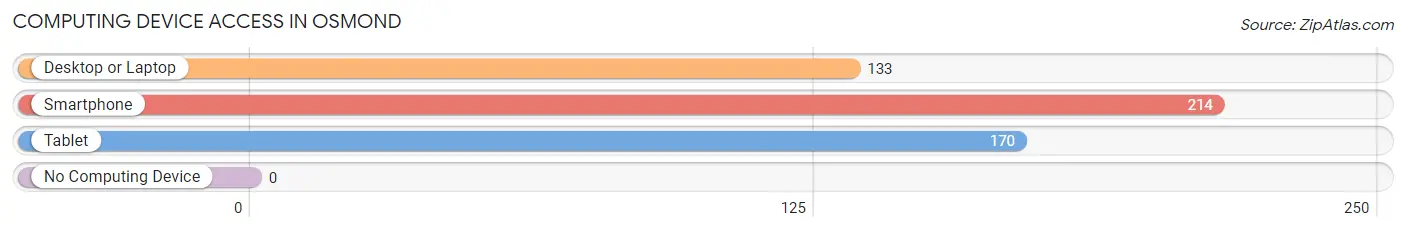
| Device Type | # Households | % Households |
| Desktop or Laptop | 133 | 62.2% |
| Smartphone | 214 | 100.0% |
| Tablet | 170 | 79.4% |
| No Computing Device | 0 | 0.0% |
| Total | 214 | 100.0% |
Internet Access in Osmond
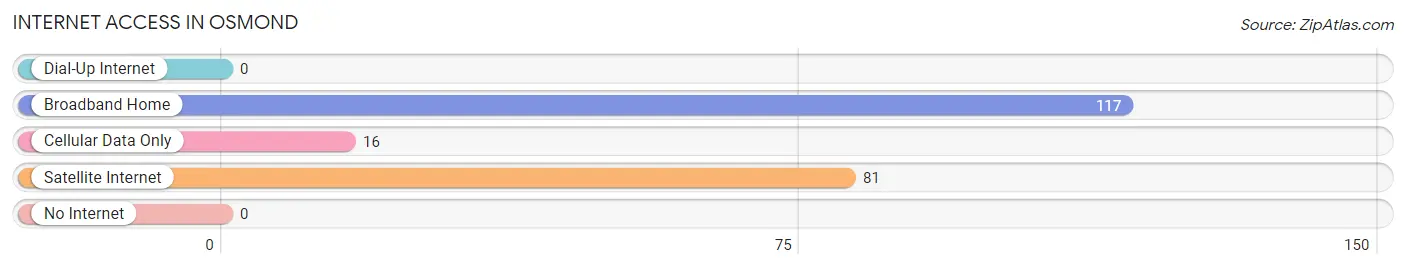
| Internet Type | # Households | % Households |
| Dial-Up Internet | 0 | 0.0% |
| Broadband Home | 117 | 54.7% |
| Cellular Data Only | 16 | 7.5% |
| Satellite Internet | 81 | 37.9% |
| No Internet | 0 | 0.0% |
| Total | 214 | 100.0% |
Osmond Summary
Osmond is a small town located in Niobrara County, Wyoming, United States. The town was founded in 1887 and is named after the Osmond family, who were among the first settlers in the area. As of the 2010 census, the population of Osmond was just over 200 people.
Geography
Osmond is located in the northern part of Niobrara County, Wyoming, at an elevation of 4,890 feet (1,490 m). The town is situated on the banks of the Niobrara River, which flows through the area. The town is surrounded by rolling hills and grasslands, and is located approximately 25 miles (40 km) south of the Wyoming-Nebraska border.
Economy
The economy of Osmond is largely based on agriculture and ranching. The town is home to several small farms and ranches, which produce a variety of crops and livestock. The town also has a small manufacturing sector, which produces a variety of products, including furniture, clothing, and other items.
Demographics
As of the 2010 census, the population of Osmond was just over 200 people. The racial makeup of the town was 97.5% White, 0.5% Native American, 0.5% Asian, and 1.5% from two or more races. The median household income in Osmond was $37,500, and the median family income was $41,250.
History
Osmond was founded in 1887 by the Osmond family, who were among the first settlers in the area. The town was originally known as Osmondville, but the name was changed to Osmond in 1895. The town was incorporated in 1901, and the first post office was established in 1902.
In the early 1900s, Osmond was a thriving agricultural and ranching community. The town was home to several small farms and ranches, which produced a variety of crops and livestock. The town also had a small manufacturing sector, which produced a variety of products, including furniture, clothing, and other items.
In the late 20th century, the economy of Osmond began to decline. The town's population began to decline, and many of the businesses in the town closed. In recent years, the town has seen a resurgence in its economy, with several new businesses opening in the area.
Today, Osmond is a small, rural town with a population of just over 200 people. The town is home to several small farms and ranches, and has a small manufacturing sector. The town is also home to several small businesses, including restaurants, shops, and other services.
Common Questions
What is Per Capita Income in Osmond?
Per Capita income in Osmond is $29,602.
What is the Median Family Income in Osmond?
Median Family Income in Osmond is $123,519.
What is the Median Household income in Osmond?
Median Household Income in Osmond is $123,086.
What is Inequality or Gini Index in Osmond?
Inequality or Gini Index in Osmond is 0.28.
What is the Total Population of Osmond?
Total Population of Osmond is 826.
What is the Total Male Population of Osmond?
Total Male Population of Osmond is 416.
What is the Total Female Population of Osmond?
Total Female Population of Osmond is 410.
What is the Ratio of Males per 100 Females in Osmond?
There are 101.46 Males per 100 Females in Osmond.
What is the Ratio of Females per 100 Males in Osmond?
There are 98.56 Females per 100 Males in Osmond.
What is the Median Population Age in Osmond?
Median Population Age in Osmond is 26.3 Years.
What is the Average Family Size in Osmond
Average Family Size in Osmond is 4.3 People.
What is the Average Household Size in Osmond
Average Household Size in Osmond is 3.9 People.
How Large is the Labor Force in Osmond?
There are 377 People in the Labor Forcein in Osmond.
What is the Percentage of People in the Labor Force in Osmond?
81.3% of People are in the Labor Force in Osmond.