Swedish vs Apache 4 or more Vehicles in Household
COMPARE
Swedish
Apache
4 or more Vehicles in Household
4 or more Vehicles in Household Comparison
Swedes
Apache
7.6%
4 OR MORE VEHICLES IN HOUSEHOLD
100.0/ 100
METRIC RATING
58th/ 347
METRIC RANK
7.4%
4 OR MORE VEHICLES IN HOUSEHOLD
99.9/ 100
METRIC RATING
77th/ 347
METRIC RANK
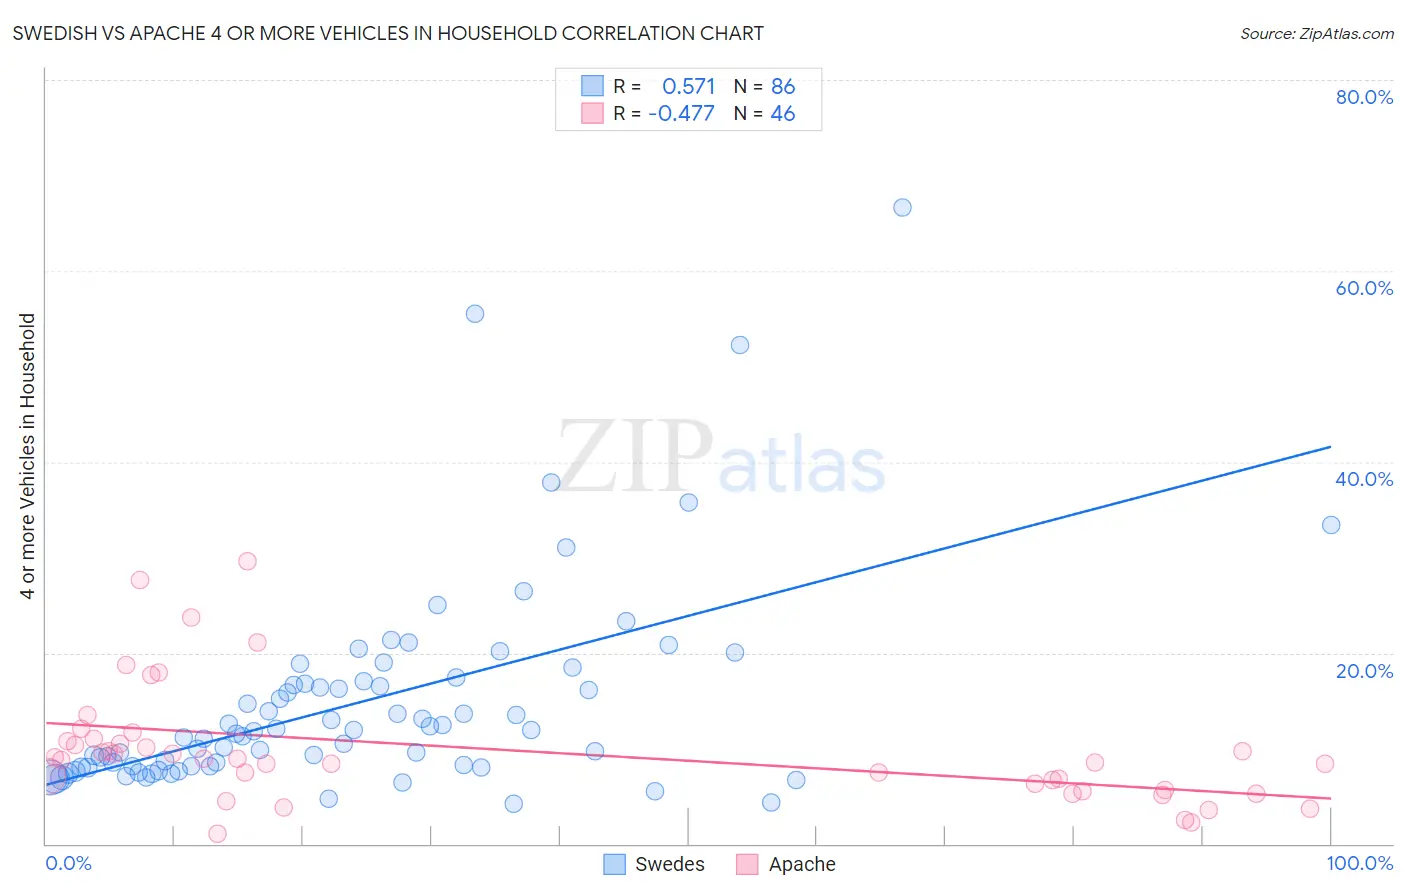
Swedish vs Apache 4 or more Vehicles in Household Correlation Chart
The statistical analysis conducted on geographies consisting of 536,277,844 people shows a substantial positive correlation between the proportion of Swedes and percentage of households with 4 or more vehicles available in the United States with a correlation coefficient (R) of 0.571 and weighted average of 7.6%. Similarly, the statistical analysis conducted on geographies consisting of 230,812,683 people shows a moderate negative correlation between the proportion of Apache and percentage of households with 4 or more vehicles available in the United States with a correlation coefficient (R) of -0.477 and weighted average of 7.4%, a difference of 3.4%.
4 or more Vehicles in Household Correlation Summary
| Measurement | Swedish | Apache |
| Minimum | 4.2% | 1.1% |
| Maximum | 66.7% | 29.6% |
| Range | 62.5% | 28.5% |
| Mean | 14.7% | 9.8% |
| Median | 11.6% | 8.9% |
| Interquartile 25% (IQ1) | 8.1% | 5.6% |
| Interquartile 75% (IQ3) | 16.7% | 10.7% |
| Interquartile Range (IQR) | 8.6% | 5.1% |
| Standard Deviation (Sample) | 10.8% | 6.2% |
| Standard Deviation (Population) | 10.8% | 6.2% |
Demographics Similar to Swedes and Apache by 4 or more Vehicles in Household
In terms of 4 or more vehicles in household, the demographic groups most similar to Swedes are Pennsylvania German (7.6%, a difference of 0.0%), Hispanic or Latino (7.6%, a difference of 0.040%), Spaniard (7.6%, a difference of 0.10%), European (7.6%, a difference of 0.36%), and Chippewa (7.6%, a difference of 0.62%). Similarly, the demographic groups most similar to Apache are Laotian (7.4%, a difference of 0.17%), Icelander (7.4%, a difference of 0.22%), Immigrants from Cambodia (7.4%, a difference of 0.22%), Portuguese (7.4%, a difference of 0.52%), and Scotch-Irish (7.4%, a difference of 0.62%).
| Demographics | Rating | Rank | 4 or more Vehicles in Household |
| Pennsylvania Germans | 100.0 /100 | #57 | Exceptional 7.6% |
| Swedes | 100.0 /100 | #58 | Exceptional 7.6% |
| Hispanics or Latinos | 100.0 /100 | #59 | Exceptional 7.6% |
| Spaniards | 100.0 /100 | #60 | Exceptional 7.6% |
| Europeans | 100.0 /100 | #61 | Exceptional 7.6% |
| Chippewa | 100.0 /100 | #62 | Exceptional 7.6% |
| Immigrants | Micronesia | 100.0 /100 | #63 | Exceptional 7.6% |
| Bangladeshis | 100.0 /100 | #64 | Exceptional 7.6% |
| Immigrants | Azores | 100.0 /100 | #65 | Exceptional 7.5% |
| Immigrants | Taiwan | 99.9 /100 | #66 | Exceptional 7.5% |
| Americans | 99.9 /100 | #67 | Exceptional 7.5% |
| Welsh | 99.9 /100 | #68 | Exceptional 7.5% |
| Germans | 99.9 /100 | #69 | Exceptional 7.5% |
| Scottish | 99.9 /100 | #70 | Exceptional 7.4% |
| Chickasaw | 99.9 /100 | #71 | Exceptional 7.4% |
| Scotch-Irish | 99.9 /100 | #72 | Exceptional 7.4% |
| Portuguese | 99.9 /100 | #73 | Exceptional 7.4% |
| Icelanders | 99.9 /100 | #74 | Exceptional 7.4% |
| Immigrants | Cambodia | 99.9 /100 | #75 | Exceptional 7.4% |
| Laotians | 99.9 /100 | #76 | Exceptional 7.4% |
| Apache | 99.9 /100 | #77 | Exceptional 7.4% |