Swedish vs Immigrants from Chile 4 or more Vehicles in Household
COMPARE
Swedish
Immigrants from Chile
4 or more Vehicles in Household
4 or more Vehicles in Household Comparison
Swedes
Immigrants from Chile
7.6%
4 OR MORE VEHICLES IN HOUSEHOLD
100.0/ 100
METRIC RATING
58th/ 347
METRIC RANK
6.1%
4 OR MORE VEHICLES IN HOUSEHOLD
16.9/ 100
METRIC RATING
207th/ 347
METRIC RANK
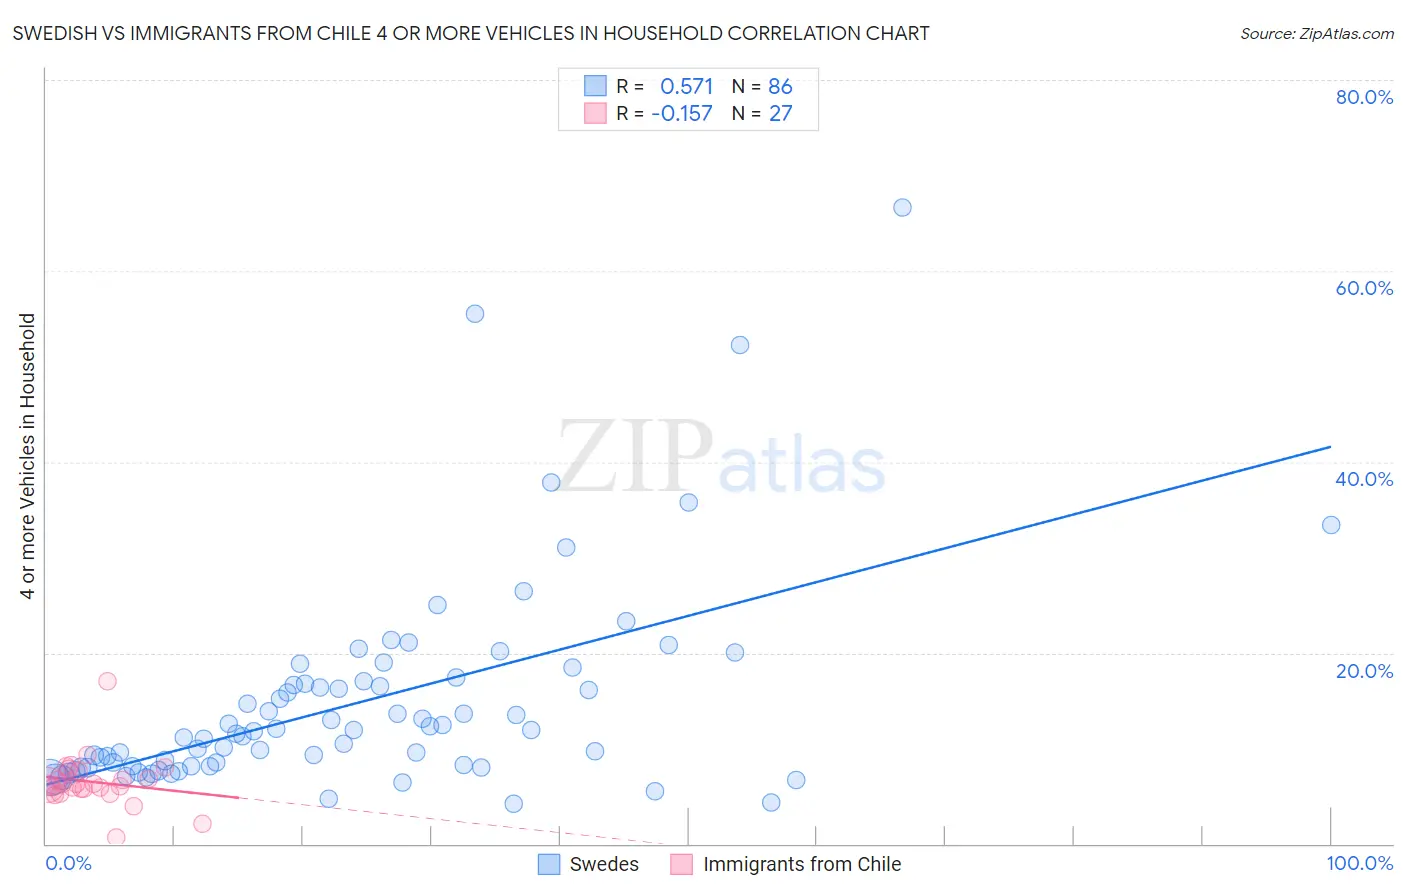
Swedish vs Immigrants from Chile 4 or more Vehicles in Household Correlation Chart
The statistical analysis conducted on geographies consisting of 536,277,844 people shows a substantial positive correlation between the proportion of Swedes and percentage of households with 4 or more vehicles available in the United States with a correlation coefficient (R) of 0.571 and weighted average of 7.6%. Similarly, the statistical analysis conducted on geographies consisting of 217,712,613 people shows a poor negative correlation between the proportion of Immigrants from Chile and percentage of households with 4 or more vehicles available in the United States with a correlation coefficient (R) of -0.157 and weighted average of 6.1%, a difference of 25.5%.
4 or more Vehicles in Household Correlation Summary
| Measurement | Swedish | Immigrants from Chile |
| Minimum | 4.2% | 0.72% |
| Maximum | 66.7% | 17.1% |
| Range | 62.5% | 16.4% |
| Mean | 14.7% | 6.5% |
| Median | 11.6% | 6.1% |
| Interquartile 25% (IQ1) | 8.1% | 5.7% |
| Interquartile 75% (IQ3) | 16.7% | 7.6% |
| Interquartile Range (IQR) | 8.6% | 1.9% |
| Standard Deviation (Sample) | 10.8% | 2.8% |
| Standard Deviation (Population) | 10.8% | 2.7% |
Similar Demographics by 4 or more Vehicles in Household
Demographics Similar to Swedes by 4 or more Vehicles in Household
In terms of 4 or more vehicles in household, the demographic groups most similar to Swedes are Pennsylvania German (7.6%, a difference of 0.0%), Hispanic or Latino (7.6%, a difference of 0.040%), Spaniard (7.6%, a difference of 0.10%), English (7.6%, a difference of 0.12%), and Immigrants from Oceania (7.6%, a difference of 0.14%).
| Demographics | Rating | Rank | 4 or more Vehicles in Household |
| Immigrants | Laos | 100.0 /100 | #51 | Exceptional 7.7% |
| Japanese | 100.0 /100 | #52 | Exceptional 7.7% |
| Malaysians | 100.0 /100 | #53 | Exceptional 7.7% |
| Dutch | 100.0 /100 | #54 | Exceptional 7.7% |
| Immigrants | Oceania | 100.0 /100 | #55 | Exceptional 7.6% |
| English | 100.0 /100 | #56 | Exceptional 7.6% |
| Pennsylvania Germans | 100.0 /100 | #57 | Exceptional 7.6% |
| Swedes | 100.0 /100 | #58 | Exceptional 7.6% |
| Hispanics or Latinos | 100.0 /100 | #59 | Exceptional 7.6% |
| Spaniards | 100.0 /100 | #60 | Exceptional 7.6% |
| Europeans | 100.0 /100 | #61 | Exceptional 7.6% |
| Chippewa | 100.0 /100 | #62 | Exceptional 7.6% |
| Immigrants | Micronesia | 100.0 /100 | #63 | Exceptional 7.6% |
| Bangladeshis | 100.0 /100 | #64 | Exceptional 7.6% |
| Immigrants | Azores | 100.0 /100 | #65 | Exceptional 7.5% |
Demographics Similar to Immigrants from Chile by 4 or more Vehicles in Household
In terms of 4 or more vehicles in household, the demographic groups most similar to Immigrants from Chile are Immigrants from Nigeria (6.1%, a difference of 0.27%), Kenyan (6.1%, a difference of 0.28%), Immigrants from Honduras (6.1%, a difference of 0.30%), Immigrants from Zimbabwe (6.0%, a difference of 0.35%), and Honduran (6.1%, a difference of 0.42%).
| Demographics | Rating | Rank | 4 or more Vehicles in Household |
| Latvians | 21.7 /100 | #200 | Fair 6.1% |
| Egyptians | 21.4 /100 | #201 | Fair 6.1% |
| Immigrants | South Central Asia | 21.3 /100 | #202 | Fair 6.1% |
| Immigrants | Sierra Leone | 20.5 /100 | #203 | Fair 6.1% |
| Immigrants | Belize | 19.8 /100 | #204 | Poor 6.1% |
| Hondurans | 19.3 /100 | #205 | Poor 6.1% |
| Kenyans | 18.5 /100 | #206 | Poor 6.1% |
| Immigrants | Chile | 16.9 /100 | #207 | Poor 6.1% |
| Immigrants | Nigeria | 15.6 /100 | #208 | Poor 6.1% |
| Immigrants | Honduras | 15.4 /100 | #209 | Poor 6.1% |
| Immigrants | Zimbabwe | 15.1 /100 | #210 | Poor 6.0% |
| Panamanians | 14.8 /100 | #211 | Poor 6.0% |
| Immigrants | Egypt | 14.7 /100 | #212 | Poor 6.0% |
| Arabs | 14.4 /100 | #213 | Poor 6.0% |
| Immigrants | Austria | 14.3 /100 | #214 | Poor 6.0% |