Swedish vs Immigrants from Sweden 4 or more Vehicles in Household
COMPARE
Swedish
Immigrants from Sweden
4 or more Vehicles in Household
4 or more Vehicles in Household Comparison
Swedes
Immigrants from Sweden
7.6%
4 OR MORE VEHICLES IN HOUSEHOLD
100.0/ 100
METRIC RATING
58th/ 347
METRIC RANK
6.2%
4 OR MORE VEHICLES IN HOUSEHOLD
27.0/ 100
METRIC RATING
194th/ 347
METRIC RANK
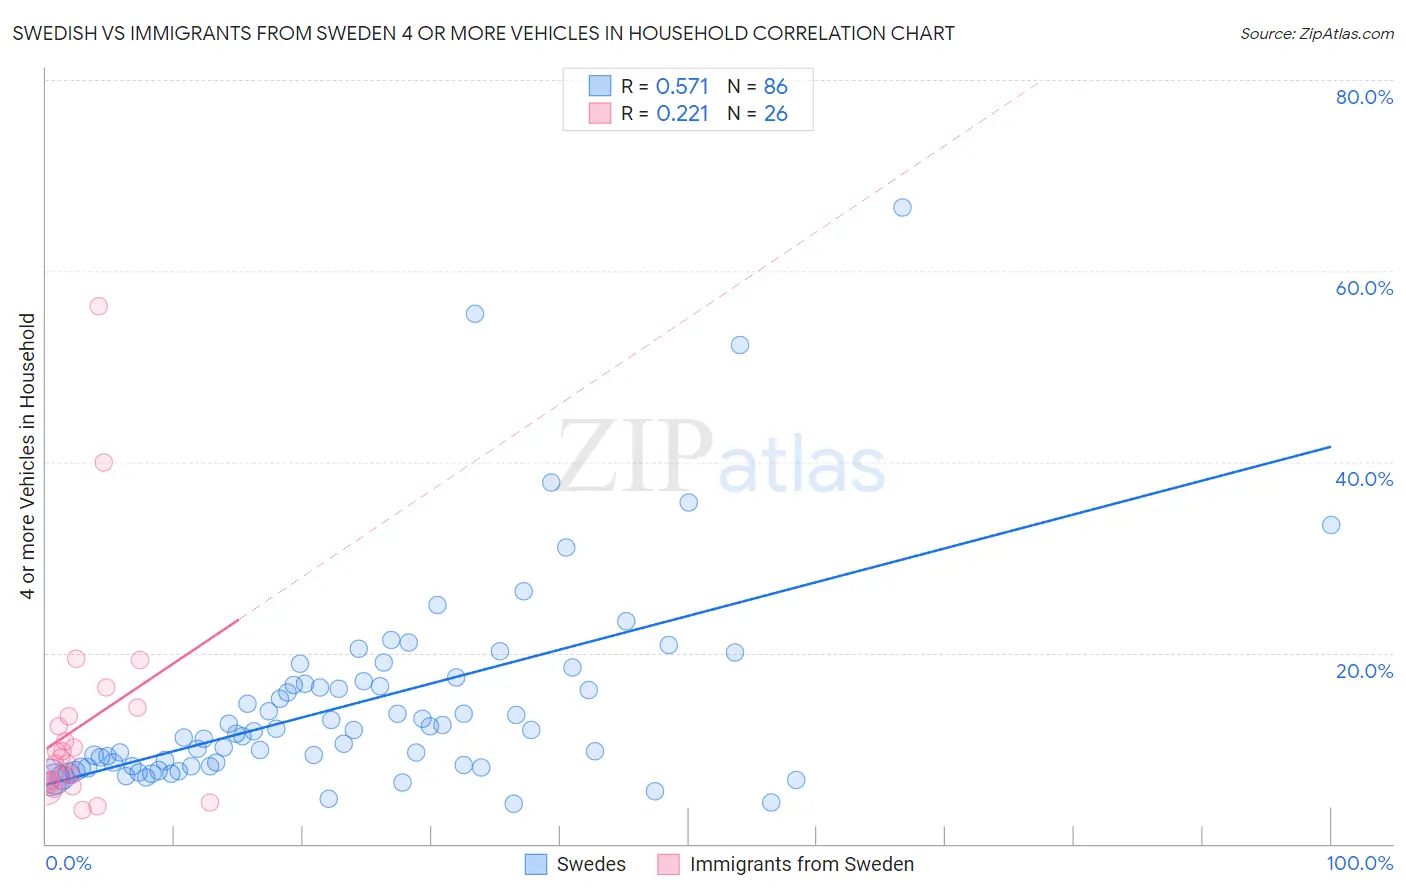
Swedish vs Immigrants from Sweden 4 or more Vehicles in Household Correlation Chart
The statistical analysis conducted on geographies consisting of 536,277,844 people shows a substantial positive correlation between the proportion of Swedes and percentage of households with 4 or more vehicles available in the United States with a correlation coefficient (R) of 0.571 and weighted average of 7.6%. Similarly, the statistical analysis conducted on geographies consisting of 163,976,202 people shows a weak positive correlation between the proportion of Immigrants from Sweden and percentage of households with 4 or more vehicles available in the United States with a correlation coefficient (R) of 0.221 and weighted average of 6.2%, a difference of 23.5%.
4 or more Vehicles in Household Correlation Summary
| Measurement | Swedish | Immigrants from Sweden |
| Minimum | 4.2% | 3.6% |
| Maximum | 66.7% | 56.4% |
| Range | 62.5% | 52.8% |
| Mean | 14.7% | 12.3% |
| Median | 11.6% | 8.7% |
| Interquartile 25% (IQ1) | 8.1% | 6.2% |
| Interquartile 75% (IQ3) | 16.7% | 13.4% |
| Interquartile Range (IQR) | 8.6% | 7.2% |
| Standard Deviation (Sample) | 10.8% | 11.6% |
| Standard Deviation (Population) | 10.8% | 11.4% |
Similar Demographics by 4 or more Vehicles in Household
Demographics Similar to Swedes by 4 or more Vehicles in Household
In terms of 4 or more vehicles in household, the demographic groups most similar to Swedes are Pennsylvania German (7.6%, a difference of 0.0%), Hispanic or Latino (7.6%, a difference of 0.040%), Spaniard (7.6%, a difference of 0.10%), English (7.6%, a difference of 0.12%), and Immigrants from Oceania (7.6%, a difference of 0.14%).
| Demographics | Rating | Rank | 4 or more Vehicles in Household |
| Immigrants | Laos | 100.0 /100 | #51 | Exceptional 7.7% |
| Japanese | 100.0 /100 | #52 | Exceptional 7.7% |
| Malaysians | 100.0 /100 | #53 | Exceptional 7.7% |
| Dutch | 100.0 /100 | #54 | Exceptional 7.7% |
| Immigrants | Oceania | 100.0 /100 | #55 | Exceptional 7.6% |
| English | 100.0 /100 | #56 | Exceptional 7.6% |
| Pennsylvania Germans | 100.0 /100 | #57 | Exceptional 7.6% |
| Swedes | 100.0 /100 | #58 | Exceptional 7.6% |
| Hispanics or Latinos | 100.0 /100 | #59 | Exceptional 7.6% |
| Spaniards | 100.0 /100 | #60 | Exceptional 7.6% |
| Europeans | 100.0 /100 | #61 | Exceptional 7.6% |
| Chippewa | 100.0 /100 | #62 | Exceptional 7.6% |
| Immigrants | Micronesia | 100.0 /100 | #63 | Exceptional 7.6% |
| Bangladeshis | 100.0 /100 | #64 | Exceptional 7.6% |
| Immigrants | Azores | 100.0 /100 | #65 | Exceptional 7.5% |
Demographics Similar to Immigrants from Sweden by 4 or more Vehicles in Household
In terms of 4 or more vehicles in household, the demographic groups most similar to Immigrants from Sweden are Argentinean (6.2%, a difference of 0.0%), Tsimshian (6.2%, a difference of 0.070%), Immigrants from Kuwait (6.2%, a difference of 0.13%), Immigrants from Sri Lanka (6.1%, a difference of 0.45%), and Romanian (6.2%, a difference of 0.47%).
| Demographics | Rating | Rank | 4 or more Vehicles in Household |
| Immigrants | South Africa | 35.4 /100 | #187 | Fair 6.2% |
| Kiowa | 34.7 /100 | #188 | Fair 6.2% |
| Immigrants | Eastern Asia | 33.3 /100 | #189 | Fair 6.2% |
| South Africans | 32.2 /100 | #190 | Fair 6.2% |
| Inupiat | 30.7 /100 | #191 | Fair 6.2% |
| Romanians | 30.7 /100 | #192 | Fair 6.2% |
| Immigrants | Kuwait | 28.0 /100 | #193 | Fair 6.2% |
| Immigrants | Sweden | 27.0 /100 | #194 | Fair 6.2% |
| Argentineans | 27.0 /100 | #195 | Fair 6.2% |
| Tsimshian | 26.4 /100 | #196 | Fair 6.2% |
| Immigrants | Sri Lanka | 23.7 /100 | #197 | Fair 6.1% |
| Immigrants | Portugal | 22.3 /100 | #198 | Fair 6.1% |
| Immigrants | Norway | 21.8 /100 | #199 | Fair 6.1% |
| Latvians | 21.7 /100 | #200 | Fair 6.1% |
| Egyptians | 21.4 /100 | #201 | Fair 6.1% |