New Zealander vs Estonian 4 or more Vehicles in Household
COMPARE
New Zealander
Estonian
4 or more Vehicles in Household
4 or more Vehicles in Household Comparison
New Zealanders
Estonians
6.5%
4 OR MORE VEHICLES IN HOUSEHOLD
73.3/ 100
METRIC RATING
150th/ 347
METRIC RANK
6.4%
4 OR MORE VEHICLES IN HOUSEHOLD
55.1/ 100
METRIC RATING
169th/ 347
METRIC RANK
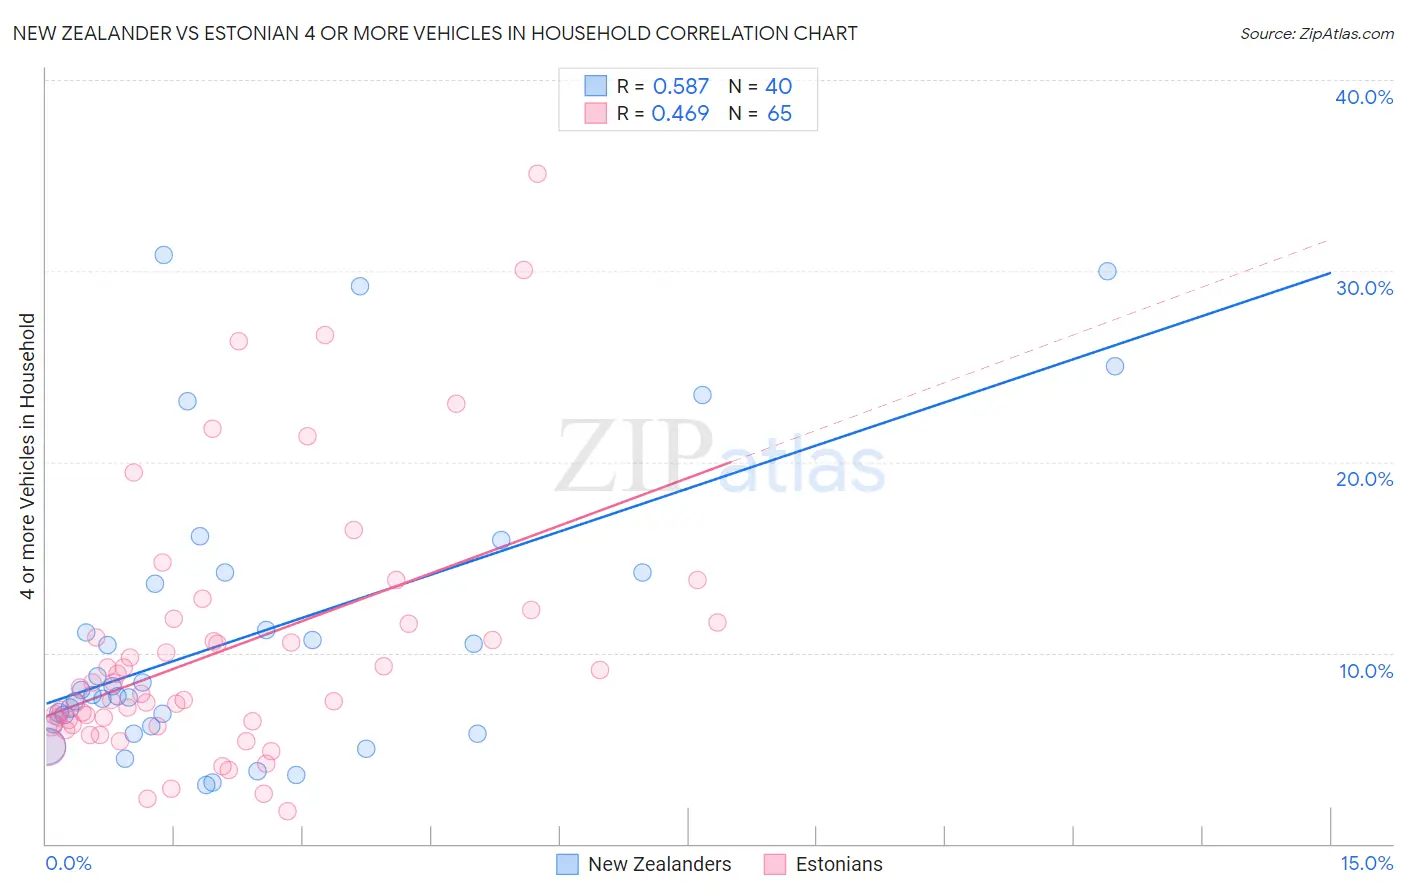
New Zealander vs Estonian 4 or more Vehicles in Household Correlation Chart
The statistical analysis conducted on geographies consisting of 106,639,386 people shows a substantial positive correlation between the proportion of New Zealanders and percentage of households with 4 or more vehicles available in the United States with a correlation coefficient (R) of 0.587 and weighted average of 6.5%. Similarly, the statistical analysis conducted on geographies consisting of 123,188,089 people shows a moderate positive correlation between the proportion of Estonians and percentage of households with 4 or more vehicles available in the United States with a correlation coefficient (R) of 0.469 and weighted average of 6.4%, a difference of 2.0%.
4 or more Vehicles in Household Correlation Summary
| Measurement | New Zealander | Estonian |
| Minimum | 3.1% | 1.7% |
| Maximum | 30.9% | 35.1% |
| Range | 27.8% | 33.4% |
| Mean | 11.0% | 10.1% |
| Median | 7.9% | 7.9% |
| Interquartile 25% (IQ1) | 6.2% | 6.2% |
| Interquartile 75% (IQ3) | 13.9% | 11.6% |
| Interquartile Range (IQR) | 7.7% | 5.3% |
| Standard Deviation (Sample) | 7.6% | 6.7% |
| Standard Deviation (Population) | 7.5% | 6.7% |
Demographics Similar to New Zealanders and Estonians by 4 or more Vehicles in Household
In terms of 4 or more vehicles in household, the demographic groups most similar to New Zealanders are Greek (6.5%, a difference of 0.040%), Immigrants from Hong Kong (6.5%, a difference of 0.14%), Yuman (6.5%, a difference of 0.15%), Immigrants from Armenia (6.5%, a difference of 0.26%), and Central American Indian (6.5%, a difference of 0.28%). Similarly, the demographic groups most similar to Estonians are Lebanese (6.4%, a difference of 0.070%), Polish (6.4%, a difference of 0.18%), Immigrants from Denmark (6.4%, a difference of 0.28%), Immigrants from Peru (6.4%, a difference of 0.49%), and Chilean (6.4%, a difference of 0.63%).
| Demographics | Rating | Rank | 4 or more Vehicles in Household |
| Greeks | 73.6 /100 | #149 | Good 6.5% |
| New Zealanders | 73.3 /100 | #150 | Good 6.5% |
| Immigrants | Hong Kong | 72.2 /100 | #151 | Good 6.5% |
| Yuman | 72.1 /100 | #152 | Good 6.5% |
| Immigrants | Armenia | 71.2 /100 | #153 | Good 6.5% |
| Central American Indians | 71.1 /100 | #154 | Good 6.5% |
| Iroquois | 70.4 /100 | #155 | Good 6.5% |
| Iranians | 69.9 /100 | #156 | Good 6.5% |
| Peruvians | 69.4 /100 | #157 | Good 6.5% |
| Zimbabweans | 67.1 /100 | #158 | Good 6.4% |
| Indians (Asian) | 66.3 /100 | #159 | Good 6.4% |
| Palestinians | 65.8 /100 | #160 | Good 6.4% |
| Immigrants | Cameroon | 64.4 /100 | #161 | Good 6.4% |
| Immigrants | Pakistan | 63.2 /100 | #162 | Good 6.4% |
| Chileans | 61.2 /100 | #163 | Good 6.4% |
| Hungarians | 61.1 /100 | #164 | Good 6.4% |
| Immigrants | Peru | 59.8 /100 | #165 | Average 6.4% |
| Immigrants | Denmark | 57.8 /100 | #166 | Average 6.4% |
| Poles | 56.9 /100 | #167 | Average 6.4% |
| Lebanese | 55.8 /100 | #168 | Average 6.4% |
| Estonians | 55.1 /100 | #169 | Average 6.4% |