New Zealander vs Dutch West Indian 4 or more Vehicles in Household
COMPARE
New Zealander
Dutch West Indian
4 or more Vehicles in Household
4 or more Vehicles in Household Comparison
New Zealanders
Dutch West Indians
6.5%
4 OR MORE VEHICLES IN HOUSEHOLD
73.3/ 100
METRIC RATING
150th/ 347
METRIC RANK
7.1%
4 OR MORE VEHICLES IN HOUSEHOLD
99.3/ 100
METRIC RATING
94th/ 347
METRIC RANK
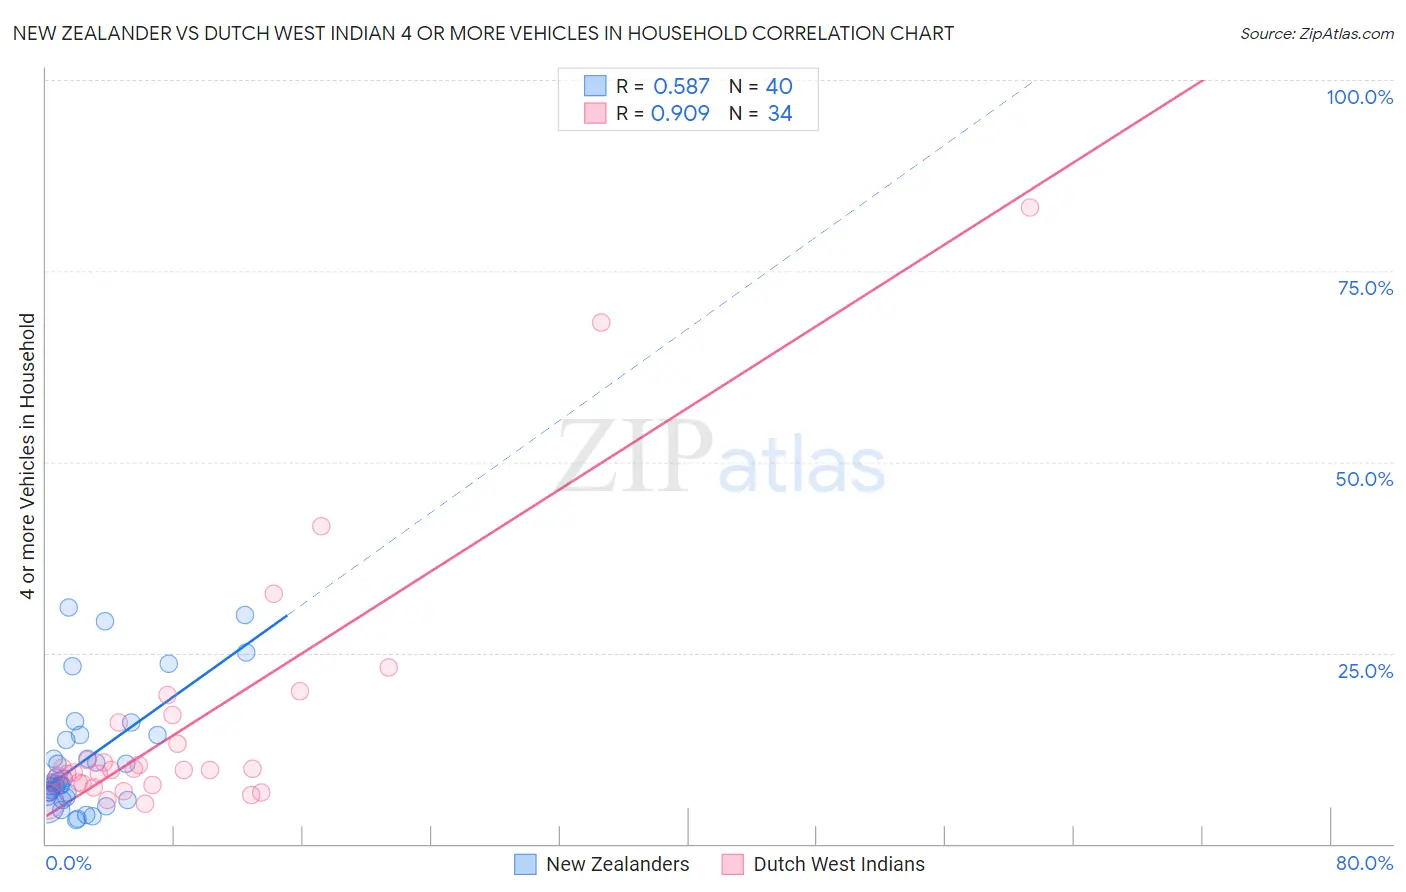
New Zealander vs Dutch West Indian 4 or more Vehicles in Household Correlation Chart
The statistical analysis conducted on geographies consisting of 106,639,386 people shows a substantial positive correlation between the proportion of New Zealanders and percentage of households with 4 or more vehicles available in the United States with a correlation coefficient (R) of 0.587 and weighted average of 6.5%. Similarly, the statistical analysis conducted on geographies consisting of 85,699,538 people shows a near-perfect positive correlation between the proportion of Dutch West Indians and percentage of households with 4 or more vehicles available in the United States with a correlation coefficient (R) of 0.909 and weighted average of 7.1%, a difference of 9.9%.
4 or more Vehicles in Household Correlation Summary
| Measurement | New Zealander | Dutch West Indian |
| Minimum | 3.1% | 5.3% |
| Maximum | 30.9% | 83.3% |
| Range | 27.8% | 78.0% |
| Mean | 11.0% | 15.8% |
| Median | 7.9% | 9.7% |
| Interquartile 25% (IQ1) | 6.2% | 7.8% |
| Interquartile 75% (IQ3) | 13.9% | 15.8% |
| Interquartile Range (IQR) | 7.7% | 8.0% |
| Standard Deviation (Sample) | 7.6% | 17.2% |
| Standard Deviation (Population) | 7.5% | 16.9% |
Similar Demographics by 4 or more Vehicles in Household
Demographics Similar to New Zealanders by 4 or more Vehicles in Household
In terms of 4 or more vehicles in household, the demographic groups most similar to New Zealanders are Immigrants from Jordan (6.5%, a difference of 0.040%), Greek (6.5%, a difference of 0.040%), Immigrants from Iran (6.5%, a difference of 0.080%), Immigrants from Costa Rica (6.5%, a difference of 0.13%), and Immigrants from Hong Kong (6.5%, a difference of 0.14%).
| Demographics | Rating | Rank | 4 or more Vehicles in Household |
| Immigrants | Canada | 78.6 /100 | #143 | Good 6.5% |
| Immigrants | North America | 78.5 /100 | #144 | Good 6.5% |
| Croatians | 77.8 /100 | #145 | Good 6.5% |
| Immigrants | Costa Rica | 74.4 /100 | #146 | Good 6.5% |
| Immigrants | Iran | 73.9 /100 | #147 | Good 6.5% |
| Immigrants | Jordan | 73.7 /100 | #148 | Good 6.5% |
| Greeks | 73.6 /100 | #149 | Good 6.5% |
| New Zealanders | 73.3 /100 | #150 | Good 6.5% |
| Immigrants | Hong Kong | 72.2 /100 | #151 | Good 6.5% |
| Yuman | 72.1 /100 | #152 | Good 6.5% |
| Immigrants | Armenia | 71.2 /100 | #153 | Good 6.5% |
| Central American Indians | 71.1 /100 | #154 | Good 6.5% |
| Iroquois | 70.4 /100 | #155 | Good 6.5% |
| Iranians | 69.9 /100 | #156 | Good 6.5% |
| Peruvians | 69.4 /100 | #157 | Good 6.5% |
Demographics Similar to Dutch West Indians by 4 or more Vehicles in Household
In terms of 4 or more vehicles in household, the demographic groups most similar to Dutch West Indians are Immigrants from Afghanistan (7.1%, a difference of 0.010%), Immigrants from Latin America (7.1%, a difference of 0.18%), Czechoslovakian (7.1%, a difference of 0.21%), Central American (7.1%, a difference of 0.23%), and Assyrian/Chaldean/Syriac (7.2%, a difference of 0.34%).
| Demographics | Rating | Rank | 4 or more Vehicles in Household |
| Delaware | 99.6 /100 | #87 | Exceptional 7.2% |
| Immigrants | Nonimmigrants | 99.6 /100 | #88 | Exceptional 7.2% |
| British | 99.6 /100 | #89 | Exceptional 7.2% |
| Creek | 99.6 /100 | #90 | Exceptional 7.2% |
| Assyrians/Chaldeans/Syriacs | 99.4 /100 | #91 | Exceptional 7.2% |
| Immigrants | Latin America | 99.4 /100 | #92 | Exceptional 7.1% |
| Immigrants | Afghanistan | 99.3 /100 | #93 | Exceptional 7.1% |
| Dutch West Indians | 99.3 /100 | #94 | Exceptional 7.1% |
| Czechoslovakians | 99.3 /100 | #95 | Exceptional 7.1% |
| Central Americans | 99.3 /100 | #96 | Exceptional 7.1% |
| Celtics | 99.1 /100 | #97 | Exceptional 7.1% |
| Irish | 99.0 /100 | #98 | Exceptional 7.1% |
| Seminole | 98.8 /100 | #99 | Exceptional 7.0% |
| Taiwanese | 98.7 /100 | #100 | Exceptional 7.0% |
| Pakistanis | 98.7 /100 | #101 | Exceptional 7.0% |