Immigrants from Morocco vs Mongolian 4 or more Vehicles in Household
COMPARE
Immigrants from Morocco
Mongolian
4 or more Vehicles in Household
4 or more Vehicles in Household Comparison
Immigrants from Morocco
Mongolians
5.1%
4 OR MORE VEHICLES IN HOUSEHOLD
0.0/ 100
METRIC RATING
300th/ 347
METRIC RANK
5.8%
4 OR MORE VEHICLES IN HOUSEHOLD
3.7/ 100
METRIC RATING
241st/ 347
METRIC RANK
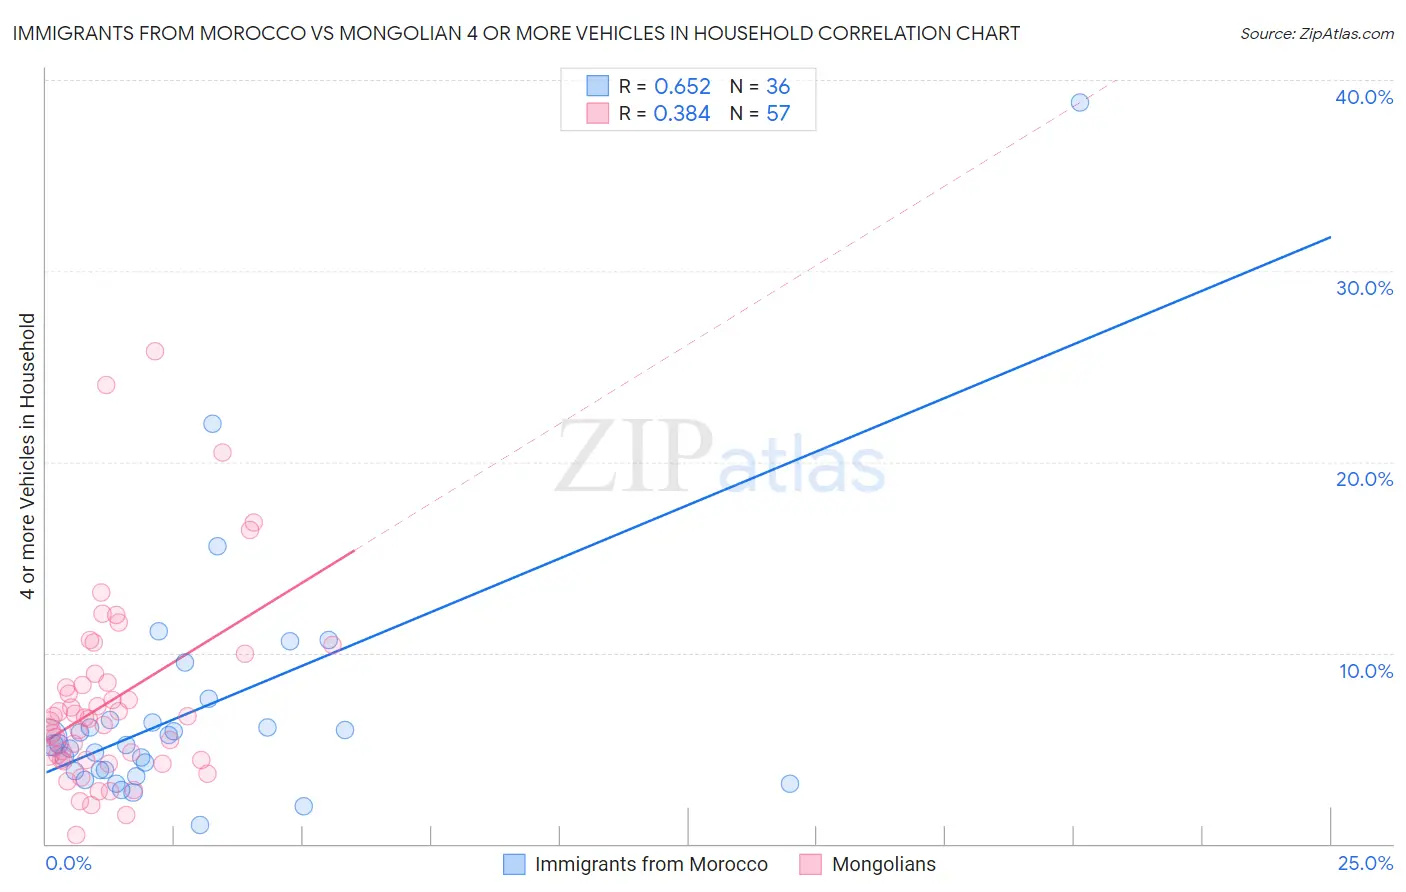
Immigrants from Morocco vs Mongolian 4 or more Vehicles in Household Correlation Chart
The statistical analysis conducted on geographies consisting of 178,286,205 people shows a significant positive correlation between the proportion of Immigrants from Morocco and percentage of households with 4 or more vehicles available in the United States with a correlation coefficient (R) of 0.652 and weighted average of 5.1%. Similarly, the statistical analysis conducted on geographies consisting of 139,675,009 people shows a mild positive correlation between the proportion of Mongolians and percentage of households with 4 or more vehicles available in the United States with a correlation coefficient (R) of 0.384 and weighted average of 5.8%, a difference of 13.8%.
4 or more Vehicles in Household Correlation Summary
| Measurement | Immigrants from Morocco | Mongolian |
| Minimum | 0.99% | 0.45% |
| Maximum | 38.8% | 25.8% |
| Range | 37.8% | 25.3% |
| Mean | 7.0% | 7.5% |
| Median | 5.2% | 6.5% |
| Interquartile 25% (IQ1) | 3.8% | 4.4% |
| Interquartile 75% (IQ3) | 6.4% | 8.7% |
| Interquartile Range (IQR) | 2.6% | 4.3% |
| Standard Deviation (Sample) | 6.7% | 5.1% |
| Standard Deviation (Population) | 6.6% | 5.0% |
Similar Demographics by 4 or more Vehicles in Household
Demographics Similar to Immigrants from Morocco by 4 or more Vehicles in Household
In terms of 4 or more vehicles in household, the demographic groups most similar to Immigrants from Morocco are Immigrants from Zaire (5.1%, a difference of 0.080%), Bahamian (5.1%, a difference of 0.39%), Immigrants from Greece (5.1%, a difference of 0.86%), Cypriot (5.0%, a difference of 1.4%), and Somali (5.0%, a difference of 1.4%).
| Demographics | Rating | Rank | 4 or more Vehicles in Household |
| Immigrants | Congo | 0.1 /100 | #293 | Tragic 5.2% |
| Ghanaians | 0.1 /100 | #294 | Tragic 5.2% |
| Immigrants | Brazil | 0.1 /100 | #295 | Tragic 5.2% |
| Israelis | 0.1 /100 | #296 | Tragic 5.2% |
| Immigrants | Venezuela | 0.1 /100 | #297 | Tragic 5.2% |
| Immigrants | South America | 0.1 /100 | #298 | Tragic 5.2% |
| Immigrants | Ghana | 0.1 /100 | #299 | Tragic 5.2% |
| Immigrants | Morocco | 0.0 /100 | #300 | Tragic 5.1% |
| Immigrants | Zaire | 0.0 /100 | #301 | Tragic 5.1% |
| Bahamians | 0.0 /100 | #302 | Tragic 5.1% |
| Immigrants | Greece | 0.0 /100 | #303 | Tragic 5.1% |
| Cypriots | 0.0 /100 | #304 | Tragic 5.0% |
| Somalis | 0.0 /100 | #305 | Tragic 5.0% |
| Immigrants | Serbia | 0.0 /100 | #306 | Tragic 5.0% |
| Menominee | 0.0 /100 | #307 | Tragic 5.0% |
Demographics Similar to Mongolians by 4 or more Vehicles in Household
In terms of 4 or more vehicles in household, the demographic groups most similar to Mongolians are Immigrants from Poland (5.8%, a difference of 0.090%), Immigrants from Australia (5.8%, a difference of 0.14%), Immigrants from Middle Africa (5.8%, a difference of 0.21%), Immigrants from Belgium (5.8%, a difference of 0.23%), and Turkish (5.8%, a difference of 0.35%).
| Demographics | Rating | Rank | 4 or more Vehicles in Household |
| Africans | 4.6 /100 | #234 | Tragic 5.8% |
| Immigrants | Hungary | 4.6 /100 | #235 | Tragic 5.8% |
| Immigrants | Eritrea | 4.5 /100 | #236 | Tragic 5.8% |
| Turks | 4.1 /100 | #237 | Tragic 5.8% |
| Immigrants | Belgium | 4.0 /100 | #238 | Tragic 5.8% |
| Immigrants | Australia | 3.8 /100 | #239 | Tragic 5.8% |
| Immigrants | Poland | 3.8 /100 | #240 | Tragic 5.8% |
| Mongolians | 3.7 /100 | #241 | Tragic 5.8% |
| Immigrants | Middle Africa | 3.4 /100 | #242 | Tragic 5.8% |
| Immigrants | Czechoslovakia | 3.2 /100 | #243 | Tragic 5.8% |
| Ethiopians | 3.2 /100 | #244 | Tragic 5.8% |
| Bulgarians | 3.1 /100 | #245 | Tragic 5.8% |
| Immigrants | North Macedonia | 2.5 /100 | #246 | Tragic 5.7% |
| Immigrants | Ethiopia | 2.4 /100 | #247 | Tragic 5.7% |
| Immigrants | Eastern Africa | 2.4 /100 | #248 | Tragic 5.7% |