Immigrants from Morocco vs Panamanian 4 or more Vehicles in Household
COMPARE
Immigrants from Morocco
Panamanian
4 or more Vehicles in Household
4 or more Vehicles in Household Comparison
Immigrants from Morocco
Panamanians
5.1%
4 OR MORE VEHICLES IN HOUSEHOLD
0.0/ 100
METRIC RATING
300th/ 347
METRIC RANK
6.0%
4 OR MORE VEHICLES IN HOUSEHOLD
14.8/ 100
METRIC RATING
211th/ 347
METRIC RANK
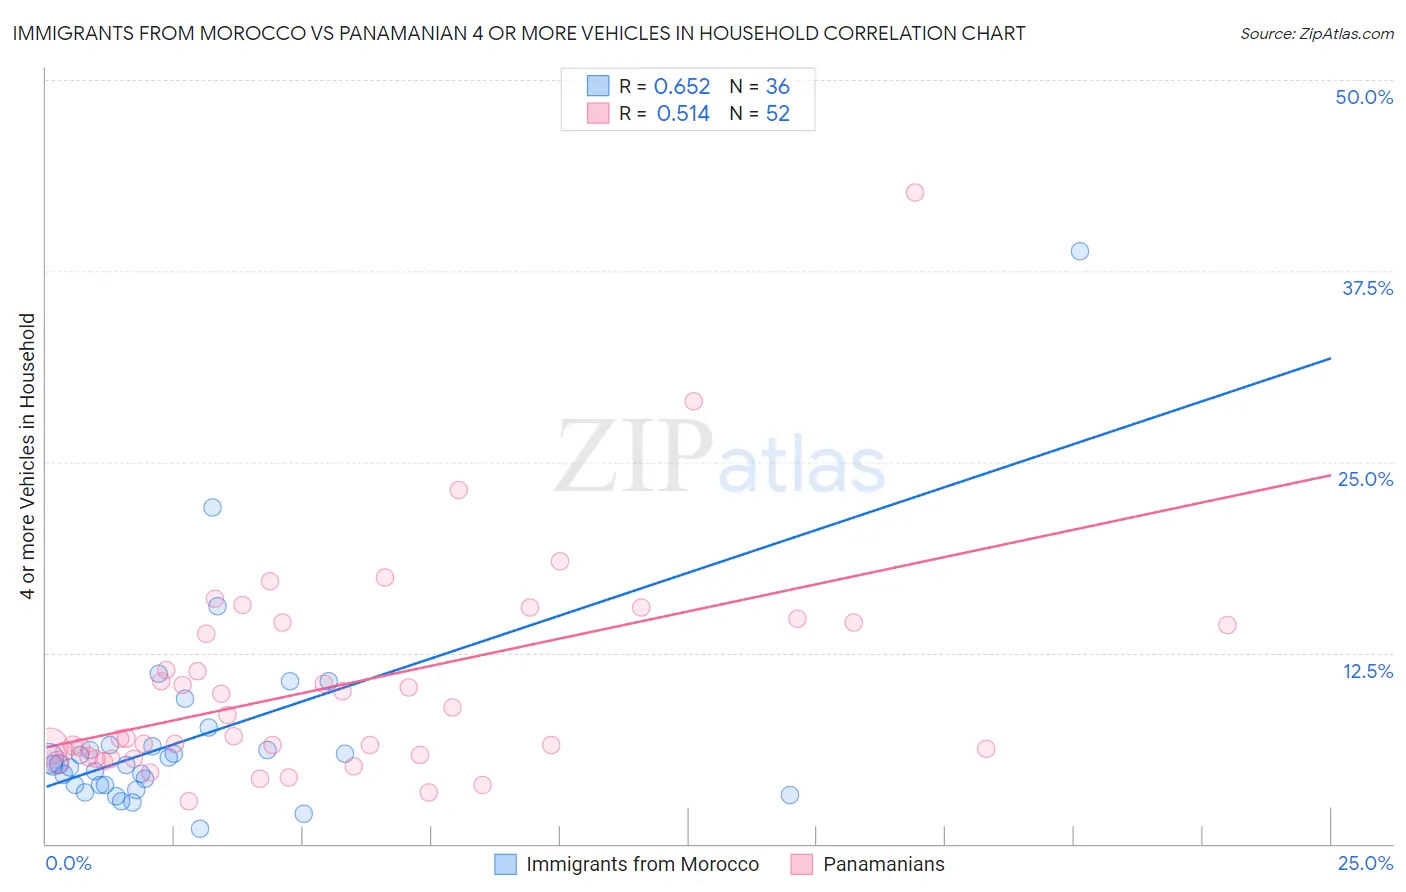
Immigrants from Morocco vs Panamanian 4 or more Vehicles in Household Correlation Chart
The statistical analysis conducted on geographies consisting of 178,286,205 people shows a significant positive correlation between the proportion of Immigrants from Morocco and percentage of households with 4 or more vehicles available in the United States with a correlation coefficient (R) of 0.652 and weighted average of 5.1%. Similarly, the statistical analysis conducted on geographies consisting of 279,879,359 people shows a substantial positive correlation between the proportion of Panamanians and percentage of households with 4 or more vehicles available in the United States with a correlation coefficient (R) of 0.514 and weighted average of 6.0%, a difference of 18.6%.
4 or more Vehicles in Household Correlation Summary
| Measurement | Immigrants from Morocco | Panamanian |
| Minimum | 0.99% | 2.8% |
| Maximum | 38.8% | 42.6% |
| Range | 37.8% | 39.9% |
| Mean | 7.0% | 10.3% |
| Median | 5.2% | 7.0% |
| Interquartile 25% (IQ1) | 3.8% | 5.7% |
| Interquartile 75% (IQ3) | 6.4% | 14.4% |
| Interquartile Range (IQR) | 2.6% | 8.7% |
| Standard Deviation (Sample) | 6.7% | 7.1% |
| Standard Deviation (Population) | 6.6% | 7.0% |
Similar Demographics by 4 or more Vehicles in Household
Demographics Similar to Immigrants from Morocco by 4 or more Vehicles in Household
In terms of 4 or more vehicles in household, the demographic groups most similar to Immigrants from Morocco are Immigrants from Zaire (5.1%, a difference of 0.080%), Bahamian (5.1%, a difference of 0.39%), Immigrants from Greece (5.1%, a difference of 0.86%), Cypriot (5.0%, a difference of 1.4%), and Somali (5.0%, a difference of 1.4%).
| Demographics | Rating | Rank | 4 or more Vehicles in Household |
| Immigrants | Congo | 0.1 /100 | #293 | Tragic 5.2% |
| Ghanaians | 0.1 /100 | #294 | Tragic 5.2% |
| Immigrants | Brazil | 0.1 /100 | #295 | Tragic 5.2% |
| Israelis | 0.1 /100 | #296 | Tragic 5.2% |
| Immigrants | Venezuela | 0.1 /100 | #297 | Tragic 5.2% |
| Immigrants | South America | 0.1 /100 | #298 | Tragic 5.2% |
| Immigrants | Ghana | 0.1 /100 | #299 | Tragic 5.2% |
| Immigrants | Morocco | 0.0 /100 | #300 | Tragic 5.1% |
| Immigrants | Zaire | 0.0 /100 | #301 | Tragic 5.1% |
| Bahamians | 0.0 /100 | #302 | Tragic 5.1% |
| Immigrants | Greece | 0.0 /100 | #303 | Tragic 5.1% |
| Cypriots | 0.0 /100 | #304 | Tragic 5.0% |
| Somalis | 0.0 /100 | #305 | Tragic 5.0% |
| Immigrants | Serbia | 0.0 /100 | #306 | Tragic 5.0% |
| Menominee | 0.0 /100 | #307 | Tragic 5.0% |
Demographics Similar to Panamanians by 4 or more Vehicles in Household
In terms of 4 or more vehicles in household, the demographic groups most similar to Panamanians are Immigrants from Egypt (6.0%, a difference of 0.020%), Immigrants from Zimbabwe (6.0%, a difference of 0.080%), Arab (6.0%, a difference of 0.080%), Immigrants from Austria (6.0%, a difference of 0.090%), and Immigrants from Honduras (6.1%, a difference of 0.13%).
| Demographics | Rating | Rank | 4 or more Vehicles in Household |
| Immigrants | Belize | 19.8 /100 | #204 | Poor 6.1% |
| Hondurans | 19.3 /100 | #205 | Poor 6.1% |
| Kenyans | 18.5 /100 | #206 | Poor 6.1% |
| Immigrants | Chile | 16.9 /100 | #207 | Poor 6.1% |
| Immigrants | Nigeria | 15.6 /100 | #208 | Poor 6.1% |
| Immigrants | Honduras | 15.4 /100 | #209 | Poor 6.1% |
| Immigrants | Zimbabwe | 15.1 /100 | #210 | Poor 6.0% |
| Panamanians | 14.8 /100 | #211 | Poor 6.0% |
| Immigrants | Egypt | 14.7 /100 | #212 | Poor 6.0% |
| Arabs | 14.4 /100 | #213 | Poor 6.0% |
| Immigrants | Austria | 14.3 /100 | #214 | Poor 6.0% |
| Immigrants | China | 13.8 /100 | #215 | Poor 6.0% |
| Immigrants | Romania | 13.8 /100 | #216 | Poor 6.0% |
| Nigerians | 12.2 /100 | #217 | Poor 6.0% |
| Immigrants | Italy | 11.0 /100 | #218 | Poor 6.0% |