Immigrants from Morocco vs Immigrants from Sudan 4 or more Vehicles in Household
COMPARE
Immigrants from Morocco
Immigrants from Sudan
4 or more Vehicles in Household
4 or more Vehicles in Household Comparison
Immigrants from Morocco
Immigrants from Sudan
5.1%
4 OR MORE VEHICLES IN HOUSEHOLD
0.0/ 100
METRIC RATING
300th/ 347
METRIC RANK
5.5%
4 OR MORE VEHICLES IN HOUSEHOLD
0.6/ 100
METRIC RATING
271st/ 347
METRIC RANK
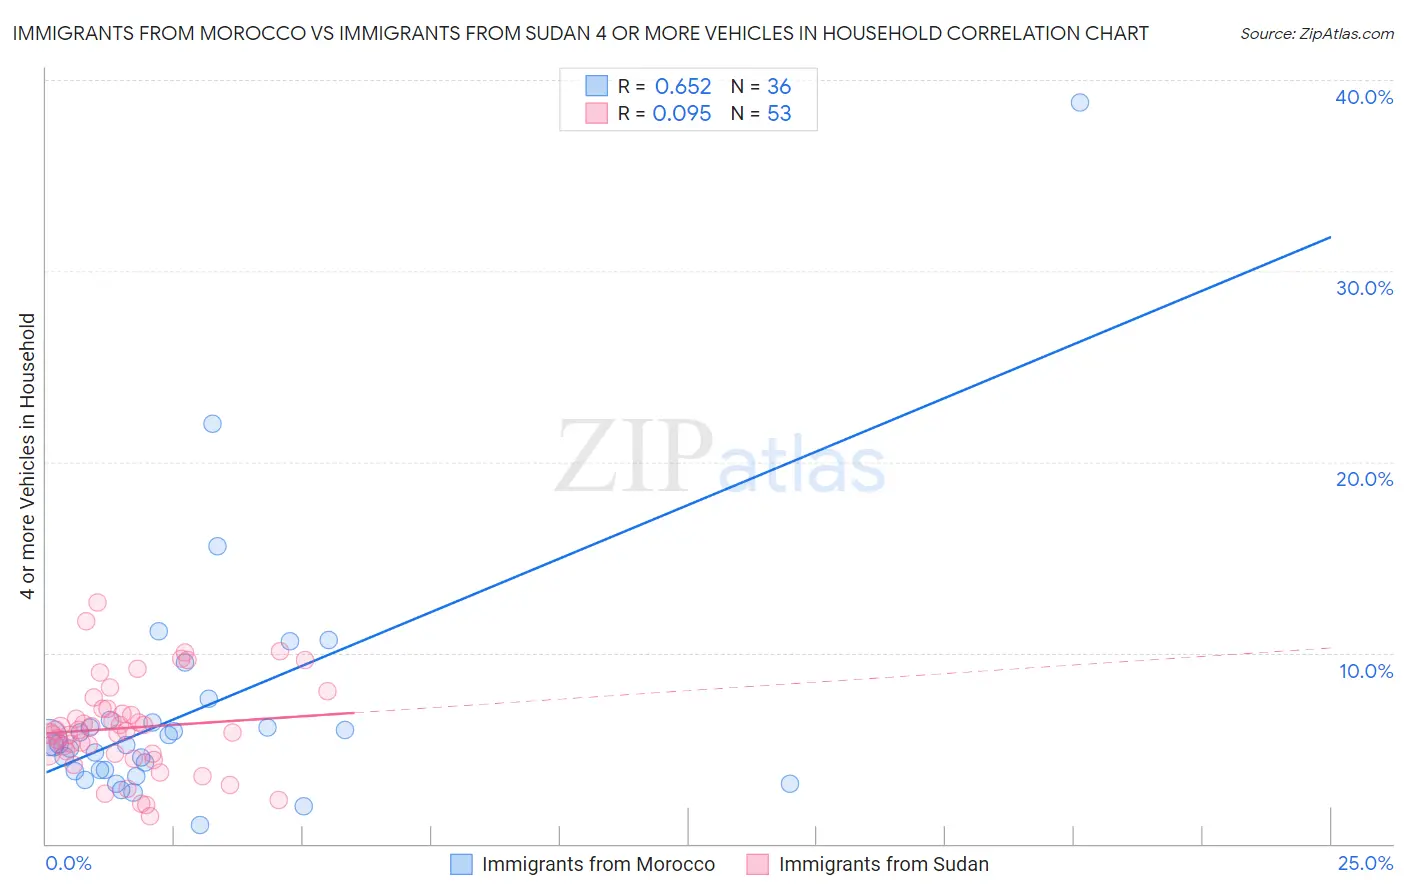
Immigrants from Morocco vs Immigrants from Sudan 4 or more Vehicles in Household Correlation Chart
The statistical analysis conducted on geographies consisting of 178,286,205 people shows a significant positive correlation between the proportion of Immigrants from Morocco and percentage of households with 4 or more vehicles available in the United States with a correlation coefficient (R) of 0.652 and weighted average of 5.1%. Similarly, the statistical analysis conducted on geographies consisting of 118,789,653 people shows a slight positive correlation between the proportion of Immigrants from Sudan and percentage of households with 4 or more vehicles available in the United States with a correlation coefficient (R) of 0.095 and weighted average of 5.5%, a difference of 8.2%.
4 or more Vehicles in Household Correlation Summary
| Measurement | Immigrants from Morocco | Immigrants from Sudan |
| Minimum | 0.99% | 1.4% |
| Maximum | 38.8% | 12.6% |
| Range | 37.8% | 11.2% |
| Mean | 7.0% | 6.1% |
| Median | 5.2% | 5.9% |
| Interquartile 25% (IQ1) | 3.8% | 4.7% |
| Interquartile 75% (IQ3) | 6.4% | 7.1% |
| Interquartile Range (IQR) | 2.6% | 2.4% |
| Standard Deviation (Sample) | 6.7% | 2.4% |
| Standard Deviation (Population) | 6.6% | 2.4% |
Similar Demographics by 4 or more Vehicles in Household
Demographics Similar to Immigrants from Morocco by 4 or more Vehicles in Household
In terms of 4 or more vehicles in household, the demographic groups most similar to Immigrants from Morocco are Immigrants from Zaire (5.1%, a difference of 0.080%), Bahamian (5.1%, a difference of 0.39%), Immigrants from Greece (5.1%, a difference of 0.86%), Cypriot (5.0%, a difference of 1.4%), and Somali (5.0%, a difference of 1.4%).
| Demographics | Rating | Rank | 4 or more Vehicles in Household |
| Immigrants | Congo | 0.1 /100 | #293 | Tragic 5.2% |
| Ghanaians | 0.1 /100 | #294 | Tragic 5.2% |
| Immigrants | Brazil | 0.1 /100 | #295 | Tragic 5.2% |
| Israelis | 0.1 /100 | #296 | Tragic 5.2% |
| Immigrants | Venezuela | 0.1 /100 | #297 | Tragic 5.2% |
| Immigrants | South America | 0.1 /100 | #298 | Tragic 5.2% |
| Immigrants | Ghana | 0.1 /100 | #299 | Tragic 5.2% |
| Immigrants | Morocco | 0.0 /100 | #300 | Tragic 5.1% |
| Immigrants | Zaire | 0.0 /100 | #301 | Tragic 5.1% |
| Bahamians | 0.0 /100 | #302 | Tragic 5.1% |
| Immigrants | Greece | 0.0 /100 | #303 | Tragic 5.1% |
| Cypriots | 0.0 /100 | #304 | Tragic 5.0% |
| Somalis | 0.0 /100 | #305 | Tragic 5.0% |
| Immigrants | Serbia | 0.0 /100 | #306 | Tragic 5.0% |
| Menominee | 0.0 /100 | #307 | Tragic 5.0% |
Demographics Similar to Immigrants from Sudan by 4 or more Vehicles in Household
In terms of 4 or more vehicles in household, the demographic groups most similar to Immigrants from Sudan are Okinawan (5.5%, a difference of 0.10%), Immigrants from Kazakhstan (5.5%, a difference of 0.19%), Macedonian (5.5%, a difference of 0.23%), Carpatho Rusyn (5.5%, a difference of 0.30%), and Black/African American (5.5%, a difference of 0.35%).
| Demographics | Rating | Rank | 4 or more Vehicles in Household |
| Immigrants | Africa | 1.0 /100 | #264 | Tragic 5.6% |
| South Americans | 0.9 /100 | #265 | Tragic 5.6% |
| Immigrants | Nepal | 0.9 /100 | #266 | Tragic 5.6% |
| Immigrants | Ukraine | 0.9 /100 | #267 | Tragic 5.6% |
| Colombians | 0.7 /100 | #268 | Tragic 5.5% |
| Carpatho Rusyns | 0.7 /100 | #269 | Tragic 5.5% |
| Okinawans | 0.6 /100 | #270 | Tragic 5.5% |
| Immigrants | Sudan | 0.6 /100 | #271 | Tragic 5.5% |
| Immigrants | Kazakhstan | 0.6 /100 | #272 | Tragic 5.5% |
| Macedonians | 0.6 /100 | #273 | Tragic 5.5% |
| Blacks/African Americans | 0.6 /100 | #274 | Tragic 5.5% |
| Cambodians | 0.5 /100 | #275 | Tragic 5.5% |
| Immigrants | Latvia | 0.5 /100 | #276 | Tragic 5.5% |
| Immigrants | Bulgaria | 0.5 /100 | #277 | Tragic 5.5% |
| Immigrants | Eastern Europe | 0.4 /100 | #278 | Tragic 5.4% |