Immigrants from Middle Africa Householder Income Ages 45 - 64 years

COMPARE

Immigrants from Middle Africa
Race
Ancestry
AfghanAfricanAlaska NativeAlaskan AthabascanAlbanianAleutAlsatianAmericanApacheArabArapahoArgentineanArmenianAssyrian/Chaldean/SyriacAustralianAustrianBahamianBangladeshiBarbadianBasqueBelgianBelizeanBermudanBhutaneseBlackfeetBolivianBrazilianBritishBritish West IndianBulgarianBurmeseCajunCambodianCanadianCape VerdeanCarpatho RusynCelticCentral AmericanCentral American IndianCherokeeCheyenneChickasawChileanChineseChippewaChoctawColombianColvilleComancheCosta RicanCreeCreekCroatianCrowCubanCypriotCzechCzechoslovakianDanishDelawareDominicanDutchDutch West IndianEastern EuropeanEcuadorianEgyptianEnglishEstonianEthiopianEuropeanFijianFilipinoFinnishFrenchFrench American IndianFrench CanadianGermanGerman RussianGhanaianGreekGuamanian/ChamorroGuatemalanGuyaneseHaitianHmongHonduranHopiHoumaHungarianIcelanderIndian (Asian)IndonesianInupiatIranianIraqiIrishIroquoisIsraeliItalianJamaicanJapaneseJordanianKenyanKiowaKoreanLaotianLatvianLebaneseLiberianLithuanianLumbeeLuxembourgerMacedonianMalaysianMalteseMarshalleseMenomineeMexicanMexican American IndianMongolianMoroccanNative HawaiianNavajoNepaleseNew ZealanderNicaraguanNigerianNorthern EuropeanNorwegianOkinawanOsageOttawaPaiutePakistaniPalestinianPanamanianParaguayanPennsylvania GermanPeruvianPimaPolishPortuguesePotawatomiPuebloPuerto RicanPuget Sound SalishRomanianRussianSalvadoranSamoanScandinavianScotch-IrishScottishSeminoleSenegaleseSerbianShoshoneSierra LeoneanSiouxSlavicSlovakSloveneSomaliSouth AfricanSouth AmericanSouth American IndianSoviet UnionSpaniardSpanishSpanish AmericanSpanish American IndianSri LankanSubsaharan AfricanSudaneseSwedishSwissSyrianTaiwaneseThaiTlingit-HaidaTohono O'OdhamTonganTrinidadian and TobagonianTsimshianTurkishU.S. Virgin IslanderUgandanUkrainianUruguayanUteVenezuelanVietnameseWelshWest IndianYakamaYaquiYugoslavianYumanYup'ikZimbabwean
Immigration
NonimmigrantsImmigrantsAfghanistanAfricaAlbaniaArgentinaArmeniaAsiaAustraliaAustriaBahamasBangladeshBarbadosBelarusBelgiumBelizeBoliviaBosnia and HerzegovinaBrazilBulgariaBurma/MyanmarCabo VerdeCambodiaCameroonCanadaCaribbeanCentral AmericaChileChinaColombiaCongoCosta RicaCroatiaCubaCzechoslovakiaDenmarkDominicaDominican RepublicEastern AfricaEastern AsiaEastern EuropeEcuadorEgyptEl SalvadorEnglandEritreaEthiopiaEuropeFijiFranceGermanyGhanaGreeceGrenadaGuatemalaGuyanaHaitiHondurasHong KongHungaryIndiaIndonesiaIranIraqIrelandIsraelItalyJamaicaJapanJordanKazakhstanKenyaKoreaKuwaitLaosLatin AmericaLatviaLebanonLiberiaLithuaniaMalaysiaMexicoMicronesiaMiddle AfricaMoldovaMoroccoNepalNetherlandsNicaraguaNigeriaNorth AmericaNorth MacedoniaNorthern AfricaNorthern EuropeNorwayOceaniaPakistanPanamaPeruPhilippinesPolandPortugalRomaniaRussiaSaudi ArabiaScotlandSenegalSerbiaSierra LeoneSingaporeSomaliaSouth AfricaSouth AmericaSouth Central AsiaSouth Eastern AsiaSouthern EuropeSpainSri LankaSt. Vincent and the GrenadinesSudanSwedenSwitzerlandSyriaTaiwanThailandTrinidad and TobagoTurkeyUgandaUkraineUruguayUzbekistanVenezuelaVietnamWest IndiesWestern AfricaWestern AsiaWestern EuropeYemenZaireZimbabweAzores
Select to Compare
Race
Ancestry
AfghanAfricanAlaska NativeAlaskan AthabascanAlbanianAleutAlsatianAmericanApacheArabArapahoArgentineanArmenianAssyrian/Chaldean/SyriacAustralianAustrianBahamianBangladeshiBarbadianBasqueBelgianBelizeanBermudanBhutaneseBlackfeetBolivianBrazilianBritishBritish West IndianBulgarianBurmeseCajunCambodianCanadianCape VerdeanCarpatho RusynCelticCentral AmericanCentral American IndianCherokeeCheyenneChickasawChileanChineseChippewaChoctawColombianColvilleComancheCosta RicanCreeCreekCroatianCrowCubanCypriotCzechCzechoslovakianDanishDelawareDominicanDutchDutch West IndianEastern EuropeanEcuadorianEgyptianEnglishEstonianEthiopianEuropeanFijianFilipinoFinnishFrenchFrench American IndianFrench CanadianGermanGerman RussianGhanaianGreekGuamanian/ChamorroGuatemalanGuyaneseHaitianHmongHonduranHopiHoumaHungarianIcelanderIndian (Asian)IndonesianInupiatIranianIraqiIrishIroquoisIsraeliItalianJamaicanJapaneseJordanianKenyanKiowaKoreanLaotianLatvianLebaneseLiberianLithuanianLumbeeLuxembourgerMacedonianMalaysianMalteseMarshalleseMenomineeMexicanMexican American IndianMongolianMoroccanNative HawaiianNavajoNepaleseNew ZealanderNicaraguanNigerianNorthern EuropeanNorwegianOkinawanOsageOttawaPaiutePakistaniPalestinianPanamanianParaguayanPennsylvania GermanPeruvianPimaPolishPortuguesePotawatomiPuebloPuerto RicanPuget Sound SalishRomanianRussianSalvadoranSamoanScandinavianScotch-IrishScottishSeminoleSenegaleseSerbianShoshoneSierra LeoneanSiouxSlavicSlovakSloveneSomaliSouth AfricanSouth AmericanSouth American IndianSoviet UnionSpaniardSpanishSpanish AmericanSpanish American IndianSri LankanSubsaharan AfricanSudaneseSwedishSwissSyrianTaiwaneseThaiTlingit-HaidaTohono O'OdhamTonganTrinidadian and TobagonianTsimshianTurkishU.S. Virgin IslanderUgandanUkrainianUruguayanUteVenezuelanVietnameseWelshWest IndianYakamaYaquiYugoslavianYumanYup'ikZimbabwean
Immigration
NonimmigrantsImmigrantsAfghanistanAfricaAlbaniaArgentinaArmeniaAsiaAustraliaAustriaBahamasBangladeshBarbadosBelarusBelgiumBelizeBoliviaBosnia and HerzegovinaBrazilBulgariaBurma/MyanmarCabo VerdeCambodiaCameroonCanadaCaribbeanCentral AmericaChileChinaColombiaCongoCosta RicaCroatiaCubaCzechoslovakiaDenmarkDominicaDominican RepublicEastern AfricaEastern AsiaEastern EuropeEcuadorEgyptEl SalvadorEnglandEritreaEthiopiaEuropeFijiFranceGermanyGhanaGreeceGrenadaGuatemalaGuyanaHaitiHondurasHong KongHungaryIndiaIndonesiaIranIraqIrelandIsraelItalyJamaicaJapanJordanKazakhstanKenyaKoreaKuwaitLaosLatin AmericaLatviaLebanonLiberiaLithuaniaMalaysiaMexicoMicronesiaMoldovaMoroccoNepalNetherlandsNicaraguaNigeriaNorth AmericaNorth MacedoniaNorthern AfricaNorthern EuropeNorwayOceaniaPakistanPanamaPeruPhilippinesPolandPortugalRomaniaRussiaSaudi ArabiaScotlandSenegalSerbiaSierra LeoneSingaporeSomaliaSouth AfricaSouth AmericaSouth Central AsiaSouth Eastern AsiaSouthern EuropeSpainSri LankaSt. Vincent and the GrenadinesSudanSwedenSwitzerlandSyriaTaiwanThailandTrinidad and TobagoTurkeyUgandaUkraineUruguayUzbekistanVenezuelaVietnamWest IndiesWestern AfricaWestern AsiaWestern EuropeYemenZaireZimbabweAzores
Householder Income Ages 45 - 64 years
Income
Poverty
Unemployment
Labor Participation
Family Structure
Vehicle Availability
Education Level
Disability

Immigrants from Middle Africa Householder Income Ages 45 - 64 years
Tragic

$91,293
HOUSEHOLD INCOME | AGE 45-64
1.1/ 100
METRIC RATING
244th/ 347
METRIC RANK

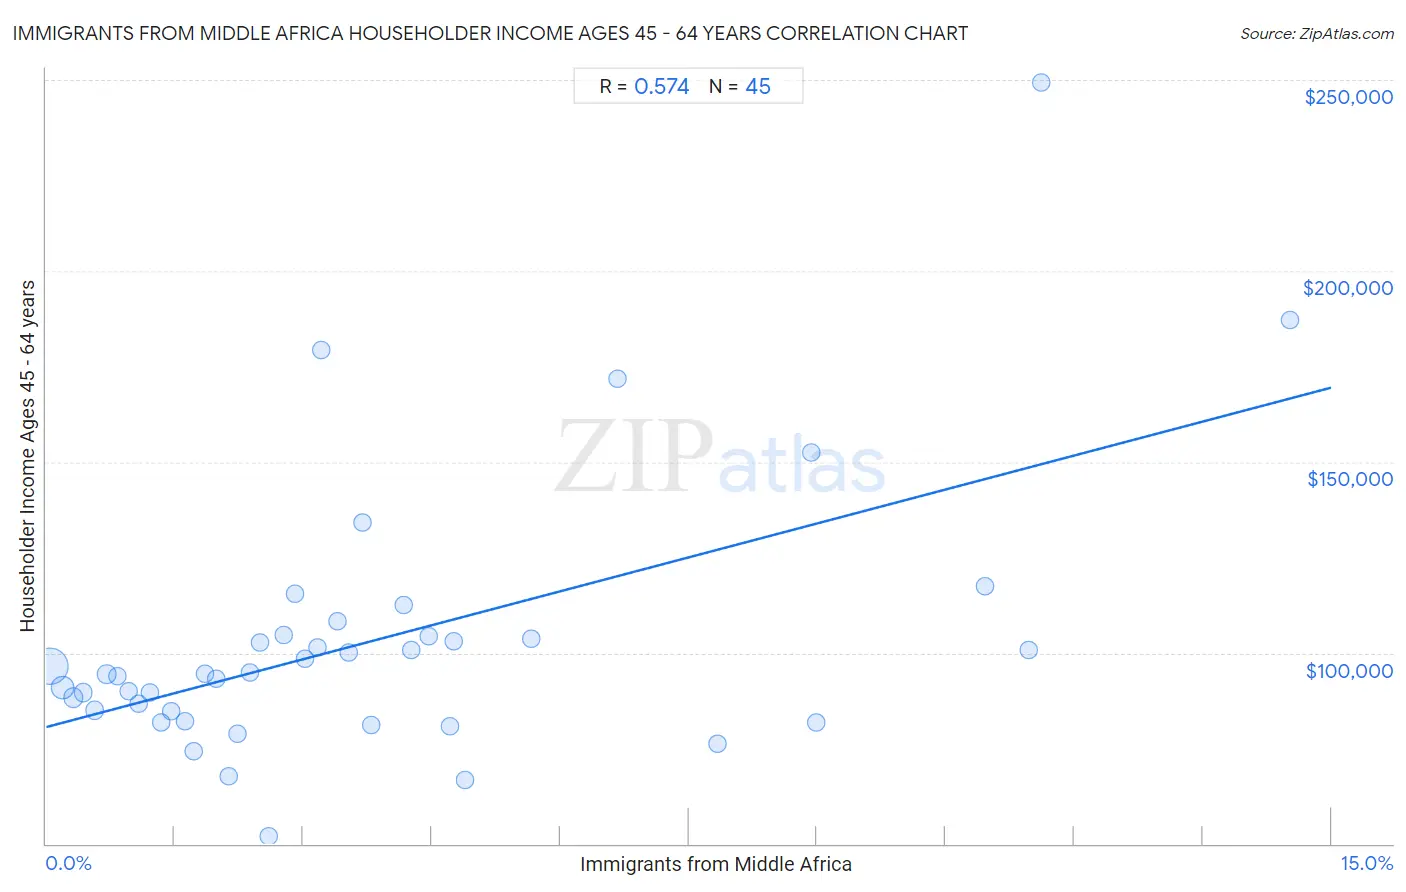
Immigrants from Middle Africa Householder Income Ages 45 - 64 years Correlation Chart

The statistical analysis conducted on geographies consisting of 202,576,362 people shows a substantial positive correlation between the proportion of Immigrants from Middle Africa and household income with householder between the ages 45 and 64 in the United States with a correlation coefficient (R) of 0.574 and weighted average of $91,293. On average, for every 1% (one percent) increase in Immigrants from Middle Africa within a typical geography, there is an increase of $5,925 in household income with householder between the ages 45 and 64.
Immigrants from Middle Africa Householder Income Ages 45 - 64 years
It is essential to understand that the correlation between the percentage of Immigrants from Middle Africa and household income with householder between the ages 45 and 64 does not imply a direct cause-and-effect relationship. It remains uncertain whether the presence of Immigrants from Middle Africa influences an upward or downward trend in the level of household income with householder between the ages 45 and 64 within an area, or if Immigrants from Middle Africa simply ended up residing in those areas with higher or lower levels of household income with householder between the ages 45 and 64 due to other factors.

Demographics Similar to Immigrants from Middle Africa by Householder Income Ages 45 - 64 years

In terms of householder income ages 45 - 64 years, the demographic groups most similar to Immigrants from Middle Africa are Immigrants from Trinidad and Tobago ($91,347, a difference of 0.060%), Trinidadian and Tobagonian ($91,357, a difference of 0.070%), Inupiat ($91,355, a difference of 0.070%), Immigrants from Burma/Myanmar ($91,385, a difference of 0.10%), and Immigrants from Ecuador ($91,462, a difference of 0.19%).
DemographicsRating | RankHouseholder Income Ages 45 - 64 years
Immigrants from Bangladesh
1.7
/100
|
#237
Tragic
$92,208
Pennsylvania Germans
1.5
/100
|
#238
Tragic
$91,956
Immigrants from Ecuador
1.2
/100
|
#239
Tragic
$91,462
Immigrants from Burma/Myanmar
1.1
/100
|
#240
Tragic
$91,385
Trinidadians and Tobagonians
1.1
/100
|
#241
Tragic
$91,357
Inupiat
1.1
/100
|
#242
Tragic
$91,355
Immigrants from Trinidad and Tobago
1.1
/100
|
#243
Tragic
$91,347
Immigrants from Middle Africa
1.1
/100
|
#244
Tragic
$91,293
Guyanese
0.9
/100
|
#245
Tragic
$90,966
Central Americans
0.9
/100
|
#246
Tragic
$90,951
Alaskan Athabascans
0.9
/100
|
#247
Tragic
$90,951
Immigrants from Laos
0.9
/100
|
#248
Tragic
$90,909
Mexican American Indians
0.8
/100
|
#249
Tragic
$90,811
Sub-Saharan Africans
0.8
/100
|
#250
Tragic
$90,691
Americans
0.7
/100
|
#251
Tragic
$90,536

Immigrants from Middle Africa Householder Income Ages 45 - 64 years Correlation Summary

MeasurementImmigrants from Middle Africa DataHouseholder Income Ages 45 - 64 years Data
Minimum0.047%$51,937
Maximum14.5%$249,250
Range14.5%$197,313
Mean3.8%$103,154
Median2.9%$94,432
Interquartile 25% (IQ1)1.4%$83,489
Interquartile 75% (IQ3)4.7%$104,529
Interquartile Range (IQR)3.3%$21,040
Standard Deviation (Sample)3.4%$35,287
Standard Deviation (Population)3.4%$34,892

Correlation Details

Immigrants from Middle Africa PercentileSample SizeHouseholder Income Ages 45 - 64 years
[
0.0%
-
0.5%
]
0.047%
132,018,981$96,472
[
0.0%
-
0.5%
]
0.19%
33,266,821$90,920
[
0.0%
-
0.5%
]
0.32%
15,074,159$88,363
[
0.0%
-
0.5%
]
0.43%
7,447,629$89,625
[
0.5%
-
1.0%
]
0.57%
4,546,812$84,892
[
0.5%
-
1.0%
]
0.70%
2,670,763$94,393
[
0.5%
-
1.0%
]
0.83%
1,571,316$93,802
[
0.5%
-
1.0%
]
0.96%
952,299$89,987
[
1.0%
-
1.5%
]
1.08%
945,229$86,683
[
1.0%
-
1.5%
]
1.21%
887,361$89,624
[
1.0%
-
1.5%
]
1.34%
620,695$81,811
[
1.0%
-
1.5%
]
1.45%
280,199$84,853
[
1.5%
-
2.0%
]
1.62%
226,667$82,124
[
1.5%
-
2.0%
]
1.73%
294,313$74,255
[
1.5%
-
2.0%
]
1.86%
294,753$94,432
[
1.5%
-
2.0%
]
1.98%
178,803$93,312
[
2.0%
-
2.5%
]
2.14%
122,311$67,520
[
2.0%
-
2.5%
]
2.23%
153,287$78,887
[
2.0%
-
2.5%
]
2.37%
199,553$94,804
[
2.0%
-
2.5%
]
2.50%
127,033$102,567
[
2.5%
-
3.0%
]
2.60%
12,365$51,937
[
2.5%
-
3.0%
]
2.77%
10,210$104,666
[
2.5%
-
3.0%
]
2.90%
105,607$115,614
[
3.0%
-
3.5%
]
3.02%
49,856$98,301
[
3.0%
-
3.5%
]
3.17%
20,174$101,336
[
3.0%
-
3.5%
]
3.21%
3,648$179,179
[
3.0%
-
3.5%
]
3.40%
43,554$108,106
[
3.5%
-
4.0%
]
3.54%
125,905$100,199
[
3.5%
-
4.0%
]
3.69%
2,330$134,038
[
3.5%
-
4.0%
]
3.79%
12,128$81,050
[
4.0%
-
4.5%
]
4.17%
69,634$112,542
[
4.0%
-
4.5%
]
4.27%
75,988$100,648
[
4.0%
-
4.5%
]
4.46%
28,427$104,391
[
4.5%
-
5.0%
]
4.71%
17,634$80,894
[
4.5%
-
5.0%
]
4.75%
27,909$103,026
[
4.5%
-
5.0%
]
4.89%
26,684$66,552
[
5.5%
-
6.0%
]
5.66%
21,985$103,802
[
6.5%
-
7.0%
]
6.67%
2,699$171,607
[
7.5%
-
8.0%
]
7.84%
13,580$76,099
[
8.5%
-
9.0%
]
8.92%
3,104$152,357
[
8.5%
-
9.0%
]
8.99%
15,489$81,674
[
10.5%
-
11.0%
]
10.96%
4,809$117,531
[
11.0%
-
11.5%
]
11.47%
1,997$100,724
[
11.5%
-
12.0%
]
11.61%
422$249,250
[
14.5%
-
15.0%
]
14.52%
1,240$187,083