Immigrants from Middle Africa vs Immigrants from Spain 4 or more Vehicles in Household
COMPARE
Immigrants from Middle Africa
Immigrants from Spain
4 or more Vehicles in Household
4 or more Vehicles in Household Comparison
Immigrants from Middle Africa
Immigrants from Spain
5.8%
4 OR MORE VEHICLES IN HOUSEHOLD
3.4/ 100
METRIC RATING
242nd/ 347
METRIC RANK
5.4%
4 OR MORE VEHICLES IN HOUSEHOLD
0.3/ 100
METRIC RATING
282nd/ 347
METRIC RANK
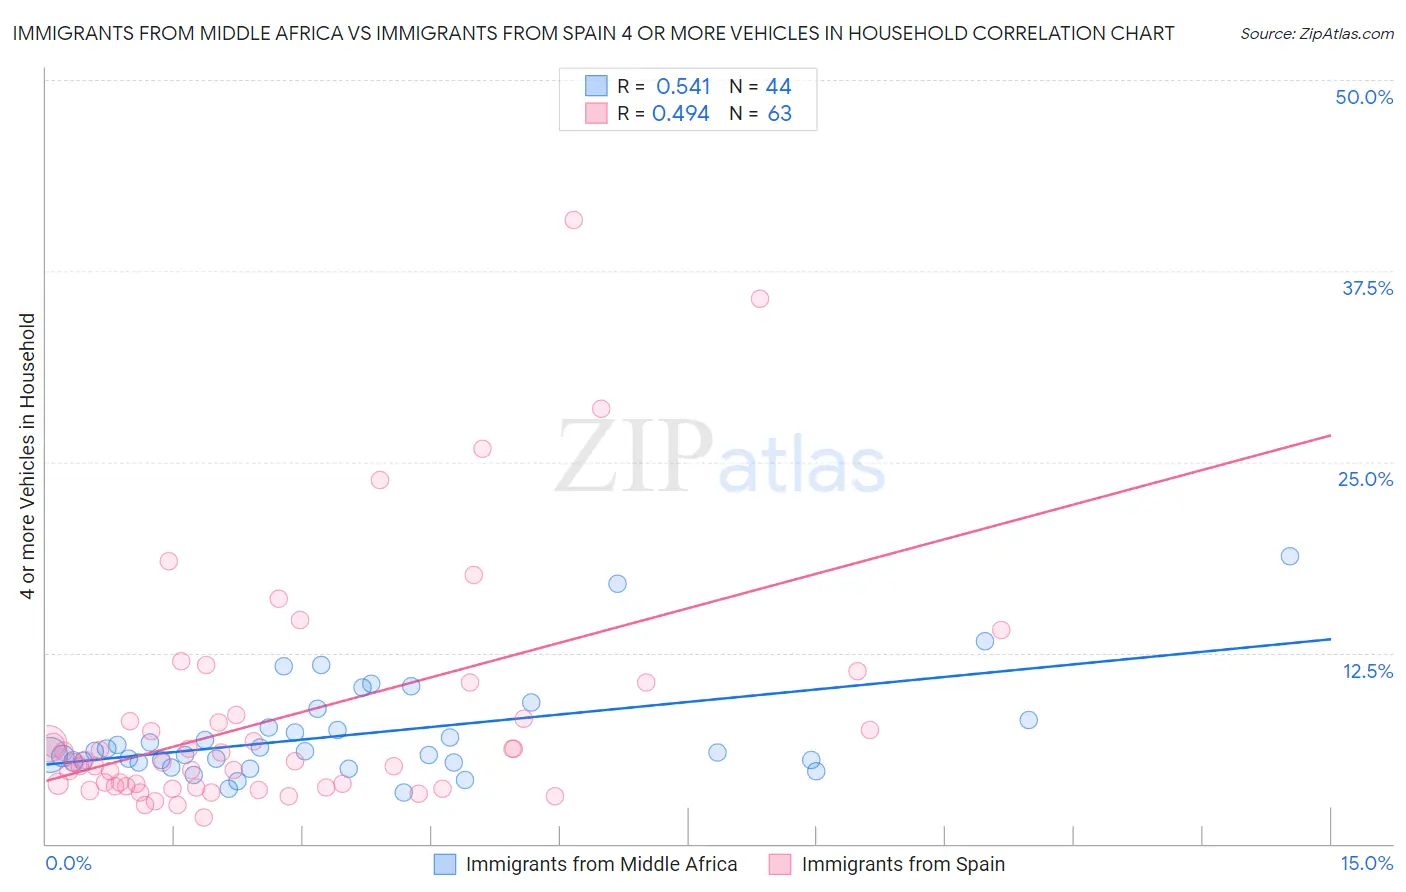
Immigrants from Middle Africa vs Immigrants from Spain 4 or more Vehicles in Household Correlation Chart
The statistical analysis conducted on geographies consisting of 201,882,462 people shows a substantial positive correlation between the proportion of Immigrants from Middle Africa and percentage of households with 4 or more vehicles available in the United States with a correlation coefficient (R) of 0.541 and weighted average of 5.8%. Similarly, the statistical analysis conducted on geographies consisting of 238,415,926 people shows a moderate positive correlation between the proportion of Immigrants from Spain and percentage of households with 4 or more vehicles available in the United States with a correlation coefficient (R) of 0.494 and weighted average of 5.4%, a difference of 7.3%.
4 or more Vehicles in Household Correlation Summary
| Measurement | Immigrants from Middle Africa | Immigrants from Spain |
| Minimum | 3.3% | 1.7% |
| Maximum | 18.8% | 40.8% |
| Range | 15.5% | 39.1% |
| Mean | 7.2% | 8.4% |
| Median | 6.0% | 5.4% |
| Interquartile 25% (IQ1) | 5.3% | 3.7% |
| Interquartile 75% (IQ3) | 7.9% | 8.4% |
| Interquartile Range (IQR) | 2.5% | 4.7% |
| Standard Deviation (Sample) | 3.3% | 7.8% |
| Standard Deviation (Population) | 3.2% | 7.8% |
Similar Demographics by 4 or more Vehicles in Household
Demographics Similar to Immigrants from Middle Africa by 4 or more Vehicles in Household
In terms of 4 or more vehicles in household, the demographic groups most similar to Immigrants from Middle Africa are Immigrants from Czechoslovakia (5.8%, a difference of 0.19%), Ethiopian (5.8%, a difference of 0.20%), Mongolian (5.8%, a difference of 0.21%), Bulgarian (5.8%, a difference of 0.24%), and Immigrants from Poland (5.8%, a difference of 0.30%).
| Demographics | Rating | Rank | 4 or more Vehicles in Household |
| Immigrants | Hungary | 4.6 /100 | #235 | Tragic 5.8% |
| Immigrants | Eritrea | 4.5 /100 | #236 | Tragic 5.8% |
| Turks | 4.1 /100 | #237 | Tragic 5.8% |
| Immigrants | Belgium | 4.0 /100 | #238 | Tragic 5.8% |
| Immigrants | Australia | 3.8 /100 | #239 | Tragic 5.8% |
| Immigrants | Poland | 3.8 /100 | #240 | Tragic 5.8% |
| Mongolians | 3.7 /100 | #241 | Tragic 5.8% |
| Immigrants | Middle Africa | 3.4 /100 | #242 | Tragic 5.8% |
| Immigrants | Czechoslovakia | 3.2 /100 | #243 | Tragic 5.8% |
| Ethiopians | 3.2 /100 | #244 | Tragic 5.8% |
| Bulgarians | 3.1 /100 | #245 | Tragic 5.8% |
| Immigrants | North Macedonia | 2.5 /100 | #246 | Tragic 5.7% |
| Immigrants | Ethiopia | 2.4 /100 | #247 | Tragic 5.7% |
| Immigrants | Eastern Africa | 2.4 /100 | #248 | Tragic 5.7% |
| Immigrants | Southern Europe | 2.3 /100 | #249 | Tragic 5.7% |
Demographics Similar to Immigrants from Spain by 4 or more Vehicles in Household
In terms of 4 or more vehicles in household, the demographic groups most similar to Immigrants from Spain are Immigrants from Ireland (5.4%, a difference of 0.080%), Immigrants from Western Africa (5.4%, a difference of 0.17%), Alsatian (5.4%, a difference of 0.24%), Immigrants from Uruguay (5.4%, a difference of 0.25%), and Brazilian (5.4%, a difference of 0.37%).
| Demographics | Rating | Rank | 4 or more Vehicles in Household |
| Cambodians | 0.5 /100 | #275 | Tragic 5.5% |
| Immigrants | Latvia | 0.5 /100 | #276 | Tragic 5.5% |
| Immigrants | Bulgaria | 0.5 /100 | #277 | Tragic 5.5% |
| Immigrants | Eastern Europe | 0.4 /100 | #278 | Tragic 5.4% |
| Immigrants | Uruguay | 0.3 /100 | #279 | Tragic 5.4% |
| Alsatians | 0.3 /100 | #280 | Tragic 5.4% |
| Immigrants | Western Africa | 0.3 /100 | #281 | Tragic 5.4% |
| Immigrants | Spain | 0.3 /100 | #282 | Tragic 5.4% |
| Immigrants | Ireland | 0.3 /100 | #283 | Tragic 5.4% |
| Brazilians | 0.3 /100 | #284 | Tragic 5.4% |
| Immigrants | Liberia | 0.2 /100 | #285 | Tragic 5.4% |
| Immigrants | Colombia | 0.2 /100 | #286 | Tragic 5.4% |
| Immigrants | Croatia | 0.2 /100 | #287 | Tragic 5.4% |
| Venezuelans | 0.2 /100 | #288 | Tragic 5.3% |
| Immigrants | Bosnia and Herzegovina | 0.2 /100 | #289 | Tragic 5.3% |